Publisher’s version / Version de l'éditeur:
Vous avez des questions? Nous pouvons vous aider. Pour communiquer directement avec un auteur, consultez la
première page de la revue dans laquelle son article a été publié afin de trouver ses coordonnées. Si vous n’arrivez pas à les repérer, communiquez avec nous à [email protected].
Questions? Contact the NRC Publications Archive team at
[email protected]. If you wish to email the authors directly, please see the first page of the publication for their contact information.
https://publications-cnrc.canada.ca/fra/droits
L’accès à ce site Web et l’utilisation de son contenu sont assujettis aux conditions présentées dans le site
LISEZ CES CONDITIONS ATTENTIVEMENT AVANT D’UTILISER CE SITE WEB.
Internal Report (National Research Council of Canada. Division of Building
Research), 1972-07-01
READ THESE TERMS AND CONDITIONS CAREFULLY BEFORE USING THIS WEBSITE. https://nrc-publications.canada.ca/eng/copyright
NRC Publications Archive Record / Notice des Archives des publications du CNRC :
https://nrc-publications.canada.ca/eng/view/object/?id=0e12fd87-03ef-48a5-a954-7316b307c73e https://publications-cnrc.canada.ca/fra/voir/objet/?id=0e12fd87-03ef-48a5-a954-7316b307c73e
Archives des publications du CNRC
For the publisher’s version, please access the DOI link below./ Pour consulter la version de l’éditeur, utilisez le lien DOI ci-dessous.
https://doi.org/10.4224/20338006
Access and use of this website and the material on it are subject to the Terms and Conditions set forth at
Physical properties of frozen wood pulp
ANALYZED
PHYSICAL PROPERTIES OF FROZEN WOOD PULP by
G. M. Williams
Report of tests on frozen wood pulp carried out in Montreal for the Montreal Engineering Company Limited during the summer of 1943 as part of an investigation on the properties of ice, under the direction of the National Research Council
of Canada. At the time of this work, Professor Williams was
on the staff of the College of Engineering, University of Saskatchewan.
Internal Report No. 398 of the
Division of Building Res earch
Ottawa July 1972
The possibility of major oil and gas developments in Northern Canada, particularly in offshore areas, has brought about an increased interest in the behaviour and properties of ice. This interest is not confined to the forces that ice covers might exert on structures, al-though that is a major problem. Ice covers can also be used as sur-faces for roads and airstrips, and consideration is being given to their use as platforms for drilling operations.
In 1943 the National Research Council of Canada undertook, with the assistance of several university and other groups, a major investigation of the properties of natural and reinforced ice. At the conclusion of the war the information obtained in this study was assembled in the CounciPs files. Some of it is relevant to current interests and needs, and it has been decided to make it available for limited distribution in the Internal Report Series of the Division of Building Research.
The present report gives the results of a study conducted by Professor G. M. Williams, who, in 1943, was a member of the College of Engineering, University of Saskatchewan, on the strength and deformation behaviour of frozen wood pulp. This work was done in a cold storage plant in Montreal as part of the activity under the direction of the Montreal Engineering Company. It is presented in the same form as it was in 1943, without revision.
Many individuals participated in the field and laboratory re-search associated with this wartime activity. The Division of Building Research is privileged to be able to make the results of their efforts available for application to present-day problems of national concern.
Ottawa, July. 1972
N. B. Hutcheon Director.
Page
1. Purpose of Investigation 1
2. Quarter sand Equipm ent 1
3. General Progress 2
4. General Program 3
5. Pulp and its Preparation 3
6.
Preparation of Test Specimens 57. Quick Tests
6
(a) Flexure 7
(b) Compression 8
(c) Tension Tests 9
(d) Bond Tests 10
( e) Shear Strength of Frozen Pulp and of
Welded Pulp 10
(f) Tension Tests of Wood Reinforcement 11
(g) Freezing Time for Pulp 11
(h) Tests of Reinforced Beams 12
( i) Unit Weights and Specific Gravity of
Frozen Pulp 13
( j) Modulus of Elasticity of Frozen Pulp 14
8. Sustained Loading Tests and Plastic Flow 14
(a) General 14
(b) Slip of Reinforcing Bars under Sustained
Loads 17
(c) Plastic Flow in Tension 17
(d) Plastic Flow in Flexure 18
(e) Plastic Flow in Compression 19
by
G. M. Williams
1. PURPOSE OF INVESTIGATION
This investigation was undertaken to establish the physical properties of frozen wood pulps of varying fibre content in
connec-tion with their possible use as a structural material. The work was
done during June. July and August 1943 in Room 71 of Harbour Cold Storage. Montreal for the National Research Council, Ottawa, with the cooperation and assistance of the Montreal Engineering Company
Limited, Montr eal,
2. QUARTERS AND EQUIPMENT
Freezing, storage and testing of test specimens was done in Room 71, which was equipped with sufficient refrigeration to
main-tain a temperature of 0° F. Since tests were to be made at both 0° F
and 15°F a Ten-Test partition was built. dividing the large room into two rooms having dimensions of approximately 28 by 90 ft and 38 by
90 ft , the former bounded by three exterior brick walls being held at
0° F and the larger one at 15°. Temporary partitions in an adjacent
non-refrigerated hallway facing the elevators furnished a work and
storage room and office space. Temperatures in different parts of
the two rooms varied slightly depending upon nearness to the dividing partition. outside walls and doors, but thermometers in the centres of the two rooms held steadily between the limits of 0° to 2 ° F and
14 to 16° F. Throughout the report the test temperatures are referred
to as 0° and 15° F.
The colder room was generally used for the freezing of test
specimens and for conducting sustained loading tests at that temperature. The 15° F room contained large work tables on which specimens were prepared for test, the 60, OOO-Ib Riehle testing machine which was used
for all quick tests, and machines for sustained loading tests. All quick
tests were made in the 15° room but specimens to be tested at 0° were stored at that temperature until placed in the machine.
For the purpose of shaping test specimens a supply of wood scrapers, carpenter's wood planes, miter boxes and saws were
pro-vided. Specimens requiring plane and parallel bearing surfaces were
"capped" with thin layers of pulp in much the same manner that con-crete test cylinders are prepared for test.
Metal wash tubs and steel drums together with a platform scale
were available for preparing and storing pulp mixtures.
Determina-tion of pulp content required a laboratory balance sensitive to O. 1 g. an electric hotplate oven and metal pans.
Measurements of test specimens and adjustment of testing equipment involved the use of steel scales graduated to 1/100 in. Deformation measurements in sustained loading tests were made with a Goodell-Pratt inside micrometer gauge with extension rods for
measurements up to lZt i.n.. , reading to 1/1000 in. with an accuracy
of about plus or minus O. 001 in.
3. GENERAL PROGRESS
Owing to delays in delivery of neces sary testing equipment the work did not get underway until 21 June when the first specimens were
frozen. In the meantime, the 60, OOO-ib Riehle two-screw testing machine
borrowed from McGill University, which had been set up on a level wooden platform in the 15° F room, was available for use and many
flexure and compression tests were made as specimens became available. Plastic flow or sustained loading tests were started 21 July when a
sufficient supply of cast-iron loading weights was finally available.
From that date until the close on 2 September the 35 dead-weight testing machines were in constant use to determine plastic flow rates of
ten-sion, compresten-sion, flexure and bond specimens. The test program
could be planned in advance only in a very general way subject to
con-stant change and modification as test data became available. Had the
long delay in getting the work underway been foreseen, another l Z or 15 testing machines of the dead weight type might have furnished a more complete story in certain respects, notably in flexure and shear, but it is believed that the more important physical characteristics have been
indicated as to general trend. Holding of the refrigerated space through
the month of September permitted deformation readings of a number of the plastic flow specimens to be continued for another 35 days, which
resulted in the definite confirmation of certain trends which had been indicated up to 1 September.
The staff of assistants consisted of two engineering students from Ecole Po.l.yt echni.que, Montreal. and three high school graduates. While they lacked experience and required constant supervision. they soon became expert at work which required repetition and practically no test results had to be discarded because of errors or neglect in
conducting the various tests. However, had an experienced engineer
been available to supervise tests after procedure became routine. some other angles which were neglected might have been followed up.
4. GENERAL PROGRAM
Tests by others had shown that physical characteristics of frozen water are influenced by rate or temperature of freezing. con-ditioning temperature prior to test, and direction of applied load
with respect to the optic axis or to the freezing surface. Another
important variable, not found in most structural materials. is the ten-dency to deform or flow under constant load which is only a small
fraction of that required to cause failure when quickly applied. In
addition to these variables there was a possibility that the test pro-gram might have to be multiplied by the number of pulp mixtures
or concentrations which it might seem advisable to include. The
first work was designed to establish the relation, in quick tests.
between pulp contents. temperature or rate of freezing, and tempera-ture of test.
Fortunately. these preliminary quick tests indicated that pulp contents and temperature of freezing were not variables insofar as flexural and compressive strengths were concerned, and that these
strengths were influenced mainly by temperature of test. Quick
tests made in the power testing machine included flexure of plain and reinforced beams. compression of cubes and cylinders, tension. shear,
shear of welded joints and bond of wood and steel reinforcement. As
such quick tests may give little or no indication of the structural value of a material which is plastic these tests were duplicated on other specim ens by the application of sustained loads. and noting the change
in deformation with time. In general. all tests were made at the two
temperatures of 15 and 0° F.
5. PULP AND ITS PREPARATION
All tests were made on water mixtures of ground wood lap. Ground wood lap is manufactured by disintegrating wood by pressing it against the face of a stone grinding wheel in the presence of a stream of water which serves to prevent burning of the wood fibre, and to
carry away the finely divided material. The resultant product, with a fibre content of I or 2 per cent is pumped and formed into thin sheets, in much the same manner as paper is made, with water reduced to about 50 per cent, and which may later be reduced in storage to an
average of about 40 per cent by further evaporation. Addition of
more water plus a small amount of stirring or mixing such as would be supplied by a pulp beater or concrete mixer will result in a
homo-geneous suspension of wood fibre of any desired pu.Ip content. The
addition of a small amount of water, together with stirring, changes the material from the paper form to that of a heavy gummy substance having considerable adhesiveness in the mass but easily shredded with
little tendency to adhere unless pressed or forced together. As
water is increased and pulp content approaches 10 per cent the mixture can be trowelled and tamped into a homogeneous mass with little effort.
At about 6 per cent it is quite plastic and semi-fluid and behaves much
like a good working bricklayer's mortar, flowing into and filling a
form with little tamping. A fibre content of 4 per cent or less appears
watery with a tendency for the fibre to settle out. The watery
appear-ance of the 4 per cent composition in contrast with the dry non-plastic condition of 12 and 14 per cent pulp is apparent in Photo No. 26.
Basing selection of pulp content on tendency to remain in sus-pension, at one extreme, and to result in a mixture which would re-tain some plasticity and flowing property with a reasonable applica-tion of energy; at the other, it seemed that a puIp content somewhere
between 4 and 8 per cent would be desirable. Within these limits the
consistencies are much the same as those of portland cement concretes used in structural work for which machinery has been developed for
mixing, transporting and placing. Most tests were made on one or all
of the 4, 6 and 8 per cent compositions but others were included as shown in the tables of test results.
Early tests were made on 4 per cent pulp prepared in the beater of the Pulp and Paper Institute at McGill University but, since this was the heaviest that could be prepared there, most of the needed pulp was worked up at the laboratory in small batches of several hundred pounds as required.
Large quantities could have been more efficiently prepared in
a power concrete mixer but hand pr ep a r ation of smaller quantities at
intervals reduced the possibility of the stock souring, and furnished a means of warming up after exposure to low temperatures in the test
rooms. Weighed quantities of the moist lap were torn up and soaked
which pieces of 4- by 4-in. timber with handles attached to one end were applied, in much the same manner as concrete tampers, except that the timber was given a rotary motion at the bottom of the stroke. The resultant laboratory product, having a concentration of 10 to 12 per cent pulp which could later be reduced as needed, appeared some-what lumpier and less uniform than that turned out by the beater at the Institute. Slightly higher flexural strengths were obtained with the Institute pulp than resulted for laboratory pulp in later tests.
Although pulp beaters used in the mills are not required to turn out concentrations of 4 per cent or greater, there would seem to be no mechanical difficulty involved in adding one or more additional power units to mill beaters and thereby increasing fibre content to 6 or 7 per cent.
6. PREPARATION OF TEST SPECIMENS
Test specimens for flexure, compression and plastic flow were generally molded and frozen in wooden beam forms made of Ii-in. dressed lumber. Most of these beams, cast in one or two layers, were 4 in. wide, 4 in. deep and 43 in. long. A few were 4 by 8 in.
by 85 in. cast in two layers. With form sides, bottoms and ends of such thickness, heat loss occurred mainly through the upper exposed face of the beams. After flexure tests in which the small beams were loaded at the 1/3 points* with a 40-in. span, cubes cut from near the ends were used for compression tests. Compression plastic flow specimens were cut from untested beams.
Tension test specimens were cast in wooden forms previously used in the University of Saskatchewan tests. These test specimens were 2 in. deep and 24 in. in over-all length with the reduced centre portions having widths of 3 and 4 in. respectively. As tested the load was applied parallel to the exposed frozen surface. For the purpose of measuring the tensile strength of welding planes at the junction of suc-cessive fillings a number of tension specimens were cast on-end after enclosing the open side of the forms and removing one of the end pieces.
Specimens for testing the bond strength of reinforcing rods, as well as cylindrical compression test pieces. were cast in watertight paper containers of 1 quart capacity having a diameter of 3. 3 in. and height of 8 in.
':. Also referred to as 4-point bending. This type of loading produces a constant bending moment over the central portion of the beam.
Shear test specimens to measure the strength of welded joints were made by joining the vertical faces of three cubes cut from beams, the centre cube projecting about I in. above the two outer ones, with the bases of the two outer cubes welded to a piece of 4- by 4-in. timber to prevent lateral spreading or tilting when load was applied downward on the upper horizontal face of the centre cube.
To determine the shearing strength of homogeneous frozen pulp free from ice seams or welds, specimens of similar shape were cut from 4- by 8-in. beams.
Tension tests of wood reinforcement were made on wood sam-p Ie s whos e ends were embedded in sam-pulsam-p in the grisam-p sam-portions of the
ten-sion forms with the centre 6 in. of the wood strip dammed off to prevent encasement.
Specimens were loaded in two directions to measure plastic
flow in compression. For loading parallel to the frozen face a specimen of sufficient length was cut from a beam and the 4- by 4-in. ends made plane and parallel. Preparation of similar specimens to be loaded per-pendicular to the frozen face involved cutting three cubes which were placed one above the other with welds at the two junctions and making the bearing faces plane and parallel.
Specimens were frozen at 15 and 0° F with most of the freezing done at the lower temperature. About 20 hours were required in still air to freeze a 2-in. beam layer or the 2-in. tension specimens. Beams poured in a single 4-in. layer were not completely frozen at the end of
24 hours. Casting in 2-in. layers resulted in less warping and distortion but caused the formation of an ice plane of varying thickness between the layers. This pure ice seam is always formed at the top of the first layer due to pure water being forced out through the frozen surface. No attempt was made in our tests to roughen or remove this ice layer prior to adding fresh pulp. The ice seam formed between successive layers is shown in Photo No. 13, welded beams, and in Photo. No. 24.
7. QUICK TESTS
The term "quick test" refers to tests made in the Riehle power testing machine. Generally the test was completed and the specimen destroyed within a period of 5 to 15 minutes. It was found that the application of strain at the rate of 1 in. per minute was satisfactory in flexure but entirely too fast to permit proper control of the poise of the weighing beam in compression tests. Since a plastic material may
in quick tests it was decided to adopt as standard speed the lowest
avail-able, which was O. 1 in. per minute. In a few cases a speed of 1.
a
in.per minute was used as indicated in the strength tabulations.
As individual test results and their variation may be of more im-portance than average values in the case of a new material, results of all separate tests are given and no test results have been omitted because of wide variation from general averages.
(a) Flexure
All beams were tested with 4-point loading with roller bearings
at supports and at points of application of load. All failures were tension
failures generally preceded by considerable deflection caused by plastic
flow in compression. There were no indications of failure due to diagonal
tension, shear or bearing. Ice seams at the neutral plane of specimens
frozen in two layers did not appear to be a source of weakness. All
computed values for failure strength are based upon elastic theory. Beams containing reinforcement are computed in the same manner as
a plain beam of the same cross-section. Photo No. 12 illustrates the
equipment used.
Tables 1 and 2 show results of early tests to determine effect of freezing temperature, temperature of test and pulp content.
These test results eliminated several factors as important
variables and considerably narrowed the test program. Rate of freezing
appeared to be of little importance and a 100 per cent increase in pulp content from 4 to 8 per cent had no appreciable effect on flexural quick
strength. Later. tests of specimens frozen quickly in 3/8-in. layers
in the wind tunnel indicated that the same relation held for tension test specimens.
In Table 3 are grouped other flexural tests on 4- by 4- by 43-dn,
beams for pulp contents ranging from 1 to 14 per cent.
In Table 3, A = 15° and B= 0° F. In each case the first letter
refers to the temperature of freezing and the second refers to the test temperature.
Although the average flexural strengths for the different pulp
concentrations do not differ greatly, there appears to be a slight increase
with increase of pulp content. This trend might be even more evident
had all pulp been worked up in the same manner. The slightly higher
values obtained for early specimens of 4 per cent pulp are probably due to the more complete beating and separation of the fibres of the lot pre" pared at the Canadian Pulp Institute.
In Table 4 are shown results of flexural tests of plain beams tested in the usual manner with frozen face up compared with similar test specimens tested with the frozen face below on the tension side, or rotated through 90° so that the frozen face was at the side.
A few large beams 4 by 8 in. in cross-section and 85 in. long were cast in 2 layers and tested with 4-point loading and span of 80 in. Although the number of large beams tested is rather small the results
seem to indicate flexural strengths somewhat lower than expected. This trend of lower strength with increase in size is consistent with similar tests on other structural materials. A few large beams were made by welding together four of the smaller 4- by 4-in. beams. The compression faces were made up of two 4- by 4- by 43-in. with beams with a butt joint at mid-span while the lower tension face was composed of one 43-in. beam at the centre with half lengths welded to either end. Photo No. 13 illustrates this type of welded beam. The welded beams failed at a lower failure strength and the test results are in fair
accord with tests of other welds, indicating that while welds are not as strong as homogeneous pulp they can develop a substantial percentage of the strength of the pulp body. Test results of large beams, homogeneous except for the ice plane at the junction of the 4- in. layers, are included in Table 5. In Table
6
are listed the tests on the built-up welded beams together with retests on the same beams after the fractures were re-welded.(b) Compression
Compression tests were made on small samples, generally 4-in. cubes. of all materials tested in beam form. After the flexure tests four cubes were cut from broken portions near the end of the span. Two were tested with the load applied parallel to the frozen surface (along the axis of the beam as cast) and two with the load applied per-pendicular to the frozen surface. As in the case of frozen water or ice, the compressive strength normal to the frozen surface was greater than that parallel.
River Ice Parallel
560 Perpendicular 905 Parallel 415 Perpendicular 840
These river ice specimens (see diagram no. 14) are the ones reported under plastic flow (compression) and had been subjected to sustained loading for a period of about two weeks. The "parallel" specimens had corrugated, bulging sides due to sustained loadings of 50 and 75 psi. It is not apparent why the ice at 15° F should test
higher than that at 0° F. Rate of plastic flow of these same specimens was greater at 0° F than at 15° F, contrary to what would be expected.
In Table 7 are grouped all of the compression tests of pulp cubes as well as a few tests of river ice and tap water ice frozen in beam molds. Table 8 includes compression tests of frozen pulp cylinders cast and frozen in cardboard cartons. The cylinder test pieces were cast as a unit and were free of ice planes and seams. Temperatures of freezing. as well as tests, were 00
F and 15° F for the three pulp contents of 4, 6 and 8%. These test results verify the earlier conclusions that, under these conditions of test, strength is dependent mainly upon temperature of test. Table 9 comprises
compression tests made on pulp prisms approximately 4 by 4 by 8 In.
which had been used previously in determining the specific gravity and weight per cubic foot of frozen pulp. Top and bottom surfaces of all compression test pieces were cushioned with Beaver Board to equalize the load. Compressive strength in quick tests appears to be little affected by pulp content.
(c) Tension Tests
Tension test specimens were frozen in molds (previously des-cribed) and were tested in the power machine. As indicated in Photo No. 3 the specimens were too long to be suspended in the usual manner so that a wooden frame resting on the weighing table of the machine served as the fixed upper head. Most specimens, after the original test, were welded and re-tested once. and a few twice. Table 10 includes test results of specimens having a minimum cross-section of 6 sq in. Tests of specimens having an 8-sq-in. section are grouped in Table II. All specimens fractured in the reduc ed sections well away from the grip ends. Results of tests of a few quick-freeze tension specimens frozen in thin layers in the wind tunnel are also included
In Table 10.
Welds were made by coating a fractured surface with pulp of the same composition. squeezing the two ends together, and trimming off the junction after freezing.
Tension specimens with ice seams normal to the direction of applied load were made by standing the tension forms on end and pour-ing layers on successive days so that there would be two or three weld planes in the sections of minimum cross -sectional area. Since the upper surfaces would not remain plane during freezing the boundaries between layers consisted for the most part of thin layers of pure ice binding irregular and rough pulp masses. These surfaces were not scraped Or roughened in any manner prior to placing the next layer. Although the results of tests reported in Table 12 are erratic most values are considerably in exces s of values that have been reported for pure ice in tension.
The test results of Tables 10 and 11 show a definite increase in tensile strength with increase in pulp content in quick tests.
(d) Bond Tests
Bond test specimens were made by casting wood and metal rods vertically in cylindrical watertight cartons about 8 in. high. Tests were made by pushing out the rods at a speed of O. 1 in. per minute. To prevent compression failure of wood above the specimen it was necessary to reduce the projecting height to less than 1 in. and the cylindrical test specimens had to be sliced into discs less than 1 in. thick in order that slippage of rod would result without compression failure in the wood. To prevent contact of the test bar with the lower bearing plate, the lower ends were "capped" with pulp after the end of the rod had been covered with a chunk of putty. After the pulp base was frozen the putty was dug out prior to test. Results of bond tests of wood contained in Table 13 are higher than those for steel
listed in Table 14. As discussed later under beam tests wooden reinforce-ment showed no signs of bond failure but steel reinforcereinforce-ment in beams slipped even though the ends were bent into the shape of a standard rein-forced concrete hook.
(e) Shear Strength of Frozen Pulp and of Welded Pulp
As described previously shear test specimens were built up by welding together 3 cubes with the bases of the two outer cubes welded to wooden blocks. Homogeneous pulp specimens, similar in shape, were also cut from the ends of 4- by 8-in. beams. While the two boundaries of each weld consist of pure ice the quantity of pulp in the mortar appears to influence strength of the joint in shear as indicated by the test results
of Table 15 covering welded specimens. As would be expected the shearing strength of pulp without ice planes (Table 16) was considerably higher. The values of 600 to 800 psi are approximately one half of the quick compressive strength, a relation found for portland cement concretes.
Cf) Tension Tests of Wood Reinforcement
The i-in. square white pine strips used as reinforcement in some beams were tested by embedding the ends in frozen pulp in the tension forms. The wood was clear select white pine, free from knots
and fairly straight grained. As shown in Table 17, four pieces selected at random varied nearly 300 per cent in tensile strength. The chief
defect of wood as tension reinforcement lies in the wide strength variation found for material which appears to be of uniform high quality. This method of gripping the ends of wood tension specimens overcomes one of the main difficulties met with in determining the tensile strength of wood. All four failures occurred well away from the embedded ends. Photo No. 18 shows this form of test specimen.
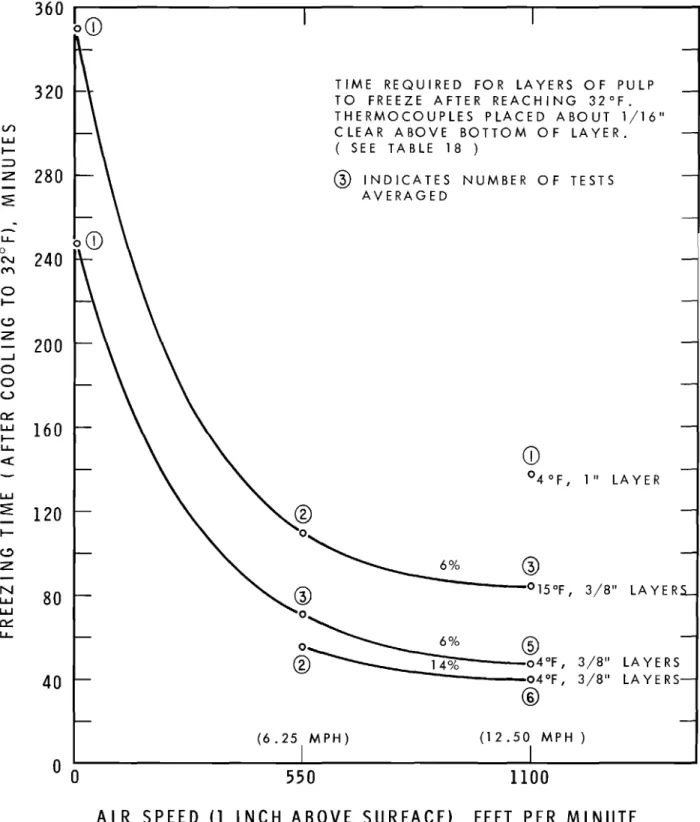
(g) Freezing Time for Pulp
Time required to freeze pulp under various conditions of air temperature and velocity, pulp content and thickness of layer was
determined in a wind tunnel about 8 ft long and 2 ft square, inside dimen-sions. Blast was furnished by a 22 -in. 8 -bladed fan mounted on a heavy cast-iron base at one end of the tunnel. Air velocity over the freezing surface was controlled by varying the distance between the inlet end of the tunnel and the fan. Test slabs of 80 sq in. were built up in a hori-zontal position on the floor of the tunnel and air velocities were measured 1 in. above the freezing surface by means of a Pitot tube and a Friez air meter graduated to give a direct reading of air speed in feet per minute for any test temperature. Temperatures were measured by means of copper -constantan thermocouples embedded near the bottom of the freez-ing layer, usfreez-ing a Leeds and Northrup potentiometer for measurfreez-ing vol-tage. This instrument was located in a room at ordinary air temperature and was connected to the thermocouples by means of a 150 -ft
lead-covered cable. Depth of test layer was controlled by the use of wooden strips whose depth was the exact thickness desired.
The freezing times reported are the length of time intervals
during which the potentiometer registered 0, while the temperature of the pulp in contact with the thermocouple was at 32° F. The approximate time
required at the beginning of each test for the pulp to drop to 32 ° F was
also noted and recorded. Time required to drop to 320, after placing,
is dependent upon temperature of the fresh pulp and that of the frozen layer on which it is placed, as well as time required to place the layer and to get the air blast in operation.
The attempt to compute theoretical output per day is of doubt-ful value without detailed knowledge of the type of equipment and plant
to be used. It is very unlikely that a plant of commercial size could
operate at 100 per cent efficiency which would require placing of a new layer and exposure to the blast at the instant the freezing mass
drops just under 32° F. The lost time in sequence of operations might
be an appreciable percentage of the freezing times listed in Table IS and shown graphically in Diagram No.1, so that actual production might be considerably less than the theoretical capacity.
Based on the results of Table IS the following estimates of production assume a plant operating efficiency of SO per cent. Air Speed
"
"
- 17. 5 m. p. h. - 12. 5 rri,p. h. 4°F 3/8-in. layers 4° F 3/S-in. layers 13in./day 10 in. /day Freezing times for the 14 per cent pulp were appreciablyshorter than for the 6 per cent. The individual results for 6 per cent
were also more variable. Some of the variation may be due to the
relatively thin layers and slight variation in the position of the thermo-couple with respect to the vertical boundaries of the layer as well as the
diameters of the thermocouple wires. In screeding off and troweling
the relatively wet 6 per cent pulp a variation of 1/16 in. in thickness
would result in a variation of 16 per cent in thickness. The procedure
involved in these tests was standardized and the electrical apparatus functioned perfectly so that the freezing times reported are probably a fair measure of the variable factors involved.
(h) Tests of Reinforced Beams
Quick tests, as well as plastic flow tests, were made on a few
beams reinforced with wood and steel. Tests are insufficient in
num-ber to permit definite conclusions except that reinforcement is generally effective in somewhat increasing the computed failure strength and
permits a much greater deflection prior to failure. Wood appears to
welded on might overcome the tendency toward early bond failure which is probably responsible for the relatively lower strength of this type of reinforcement. Since carrying capacity of a beam is probably controlled mainly by plastic flow on the compression side (discussed later under Plastic Flow of Beams) which requires that flexural stress be kept low, bond strength of the reinforcement may not be important under practical working conditions. The poor showing of steel with standard concrete specification hooks at the ends was unexpected.
Quick test results of reinforced beams in flexure are listed in Table 19. Variation in tensile strength of the i-in. square wooden re-inforcing, previously noted. may account for the results obtained with 4 per cent pulp. In contrasting results obtained for wood and steel reinforcement in beams it should be noted that the cross -sectional area of reinforcement in wood-reinforced beams was 5 to 10 times the area of steel in those reinforced with steel and that surface area per inch of length to resist bond was zi to 4 times as great for wood.
These tests show no advantage for hooked ends over plain. straight ends for steel.
Interesting results, but of little practical value, were observed in a retest of some of the beams reinforced with i-in. diameter steel rods with hooked ends. In the original tests, at a speed of O. 1 in. per minute. failures occurred with loads of 1300 to 1650 lb and computed flexural stress values of 900 to 1100 psi. These beams were later loaded at a rate of 1. 0 in. per minute during which time the loads carried were greater than during the original test with a deflection as great as that shown in Photo No. 16. The wide crack was apparent up to within
i
in. of the upper face of the beam; apparently the pulp beam and the wooden beam through which loads were applied at one-third points along the span were functioning together as an inverted "A" trus s with the two pulp halves of the pulp beam subjected mainly to tension. carried by the steel, and not to flexure as at the start of the test. Slippage of steel and straightening out of one of the hooks. first noted in the original test at low speed, is shown in Photo No. 17.(i) Unit Weights and Specific Gravity of Frozen Pulp
Since frozen specimens are not uniform in shape or dimensions. computations of weight per cubic foot based upon measured dimensions may be appreciably in error and determinations of unit weights of
The values listed in Table 20 are based upon volume displacement of a liquid (kerosene). Samples were approximately 4 by 4 by 8 in. homo-geneous and free of ice seams, and weighed about 41b each. Compressive strengths of these specimens are listed in Table 9.
(j) Modulus of Elasticity of Frozen Pulp
As pointed out in the second section, "Plastic Flow,II there is no constant relation between stress and strain for frozen water or
pulp. Even though applied loads are a small fraction of the quick ultimate strength, deformation continues to increase with time as the constant load is maintained. For elastic materials, for which a constant ratio between stress and strain is found to be independent of time so long as the stress is below the elastic limit, the relation
II
E"
= unit stress unit strainholds, but since strain varies with time, for pulp the tim e variable must appear and for pulp this equation might read:
II
E"
= unit stressunit strain x tX
Since the denominator is a variable, "E" cannot be a constant. Computation of liE" for pulp based upon the results of quick tests, in any form, is therefore meaningles s and of no value for structural pur-pos es where load is a constant for an indefinite period of time.
8. SUSTAINED LOADING TESTS AND PLASTIC FLOW
(a) General
Plastic flow, or continued deformation without increase in load, was observed in several types of quick tests in the power testing
machine. This effect was evidenced by the tendency of the weighing beam to drop while strain was steadily applied to the specimen. After being down for a period of time the beam would rise and, to maintain balance, the poise would be moved out for a short period after which the beam would again drop. This action occurred in compression at a speed of
O.1 in. per minute and in flexure tests at speeds of O.1 and 1. 0 in. per minute. In compression tests of cubes this alternate dropping and rising
of the weighing beam might have continued indefinitely or until the
specimen was reduced to a fraction of its original height. There is
no definite point of failure of a compression specimen. As slow
load-ing is continued lateral dimensions are increased so that after the specimen is reduced to a fraction of its original height the unit load on the enlarged area is considerably greater than at any earlier period of
the test. In a sense the material has become stronger than it was at
the start of the test, but deformation has been so great that it has lost
all value as a structural material. In the quick tests the first decided
drop of the beam was preceded by a reduced rate of movement of the poise so that there was no difficulty in detecting "maximum load"
except for the high pulp contents for which drop of beam was less pronounced.
The increase in strength accompanying excessive deformation is shown in Photo No. 21 which shows a 4-in. cube before and after
crushing. The specimen at the right originally had a cross -section of
13. 85 sq in. and loaded in the usual manner at the rate of O. 1 in. per
minute "failed" at 11. 000 lb or 795 psi. The rate of loading was then
increased to 1. 0 in. per minute and, as height decreased, lateral
dimensions increased so that the pulp spread beyond the limits of the
6- by 6-in. bearing plates. When the machine was stopped the
speci-men was carrying 44, 570 Ib, a unit stress of 1255 psi on the new area
of 36 s q in. Time required to reduce the specimen to the height shown
in Photo No. 21, after initial failure. was a little over 2 minutes. Beams, in flexure tests, performed in much the same manner
as cubes in compression. Plain beams would deflect as much as 3/8
to
i
in. with tension cracks opening up within the middle third of thelength before failure. Reinforced beams. especially those reinforced
with wood. would deflect as much as
Ii
in., requiring 12 to 15 minutesof operation of the machine at 0.. 1 in. per minute. A large part of the
total load would be registered within the first few minutes. with additional increments of 20 to 50 lb with long time intervals between, during which
the weighing beam would drop. Photo No. 12 illustrates the deflection
of a wood reinforced beam during test when the amount was about 1 in. This plastic flow under sustained load which may be a small fraction of the "quick test" strength indicates the relative unimportance
of all of the foregoing quick test results. Quick tests fail to give any
reliable indication of safe loads which may be used in practice and
their use in an attempt to measure structural behaviour of pulp will lead to unsafe design if factors of safety similar to those employed with
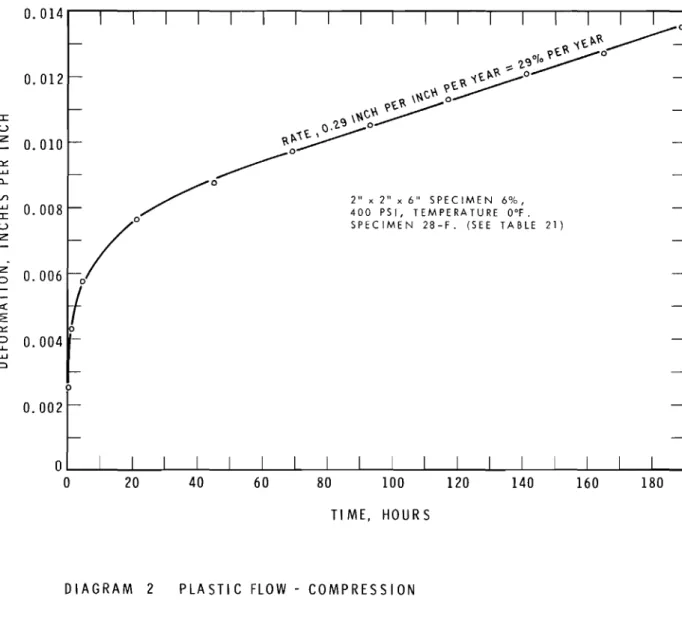
Diagram No. 2 shows graphically the deformation with time of
a specimen loaded in compression with a sustained load of 400 psi. The
extremely rapid rate of the first few hours tapers off at about 40 hours to a lower rate of O. 29 in. per inch per year which is at a rate of 29 per
cent per year. This deformation time relation is shown here as a typical
example of the reduction in rate of deformation with time when load is
a constant. The applied unit load was about 40 per cent of the ultimate
"quick test" value and the later 29 per cent rate per year did not de-crease with time.
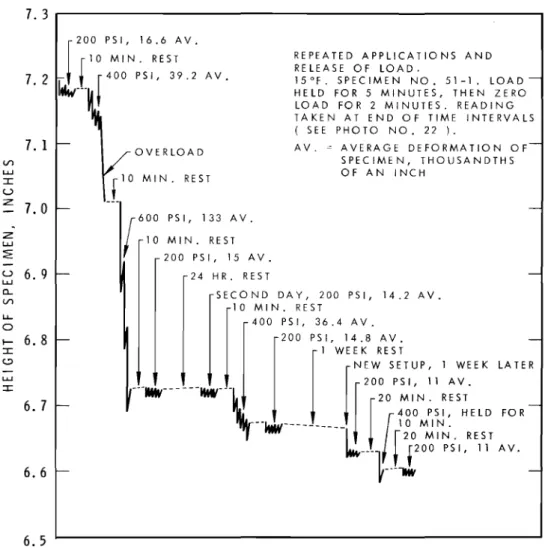
In Diagram No. 3 are shown results of tests in which a prism
was loaded and unloaded a large number of times. A load of 200 psi was
applied for 5 minutes. the load removed. and the specimen allowed to
rest for 2 minutes. This loading was applied a total of 5 times,
deforma-tion readings being taken just before release of load and again before a
new application. After a la-minute rest the sequence was repeated for
400 psi then with 600 psi. followed by a repetition of the 200 psi loading. After 24 hours without alteration of position of the specimen in the testing machine a series of 200 lb then 400 lb and finally 200 psi .loadings were
repeated. A week later the same specimen was subjected to further
load-ings of 200. 400 and 200 psi. The decrease in total deformation which
also represents a decrease in rate of deformation is apparent from the graph which also shows the absolute height of the specimen. originally
about 7.2 in., during the test. The appearance of the shortened test
piece together with surface deformations or bulges is contrasted with an identical untested specimen in Photo No. 22.
A beam was tested in somewhat the same manner by loading and
unloading it with rest intervals between and measuring deflection. The
results are not extensive enough to justify definite conclusions but it
is apparent that the trend of decreased deformations with repeated loadings
found for the prism loaded in compression is apparent here also. The
deflection and recovery after loading is shown in Diagram No.4.
These tests as well as all of the beam and compression specimens. described later, which were subjected to steady loading indicate that
rate of deformation decreases during the first 24 to 40 hours even though the load is sufficient to result in failure in a comparatively short period
of time. Smaller loadings will result in a decreased rate of deformation
not only during the initial period but throughout the test so that the rate
approaches or actually becomes zero. None of the test data obtained
throughout the work indicated a change in physical properties comparable to the work hardening of low carbon steel brought about by application of stress well beyond the elastic limit after which the yield point becomes higher with a loss of ductility or elongation.
In the sustained loading tests deflection or deformation readings were taken for periods ranging from a few days to two months. Since it is difficult to compare test data or draw conclusions from tabulated figures the results of bond tests of reinforcing bars, plastic flow in tension and deflections of beams subjected to sustained loadings are
shown in diagram form. Results of plastic flow of compression test specimens carrying sustained loadings are shown for the most part in terms of rate of deformation per year obtained from diagrams showing
relation between deformation and time.
(b) Slip of Reinforcing Bars under Sustained Loads
Sustained bond tests are shown in Diagram No.5. All tests were made with 6 per cent pulp. Only two specimens containing steel reinforce-ment were subjected to sustained loading. One which showed a small
rate of slip at 50 psi apparently failed soon after the load was increased to 75 psi although this was not verified by inspection at the close of the test. The other specimen showed slight slip at 25 psi for 13 days, showed a greater rate when the load was increased to 50 psi.
Wooden bars of larch 3/4 in. square and surfaced on two sides showed slight progressive slip for 50 psi at both 15° and 0° F.
One test of a i-in. round birch dowel bar showed movement at a slow rate for 75 psi at 15° F.
These tests are too few in number to permit of definite conclu-sions being drawn but they appear to indicate that a bond stress of 50 psi at 15° F might be safe for wood.
(c) Plastic Flow in Tension
Large tension specimens similar to those used in the quick tests were held in wooden grips, and were loaded by means of a beam and cast-iron weights as illustrated in Photo No.4. Since only four test pieces were involved it is again impossible to draw definite conclusions but it appears that there is little plastic flow for unit loads which may be as much as one third of the quick ultimate strength. For some unknown reason one specimen loaded to 100 psi persisted in shortening instead of lengthening as would be expected (See Diagram No.6).
These results seem to justify the statement that plastic flow or deflection in flexure for small sustained loads is due to plastic flow on the compression side of the beam.
(d) Plastic Flow in Flexure
Diagram No. 7 shows graphically the deflection-time relations
for 4- by 4- by 43 -Ln, beam s with 40 -In, span loaded at the third
points. At each temperature one beam was tested with the frozen face
up and one with the frozen face on a side. After application of load
sufficient to result in a fibre stress of 95 psi for a few days at 15° F the
load was increased to 165 psi. Deflections then increased for 3 days
after which there was no increase for a period of 10 days. Load on one
specimen was then increased to 305 psi and deflection increased rapidly at a uniform rate which would have resulted in fracture had the test been
continued. Two beams at 0° F were held at 100 psi with no progressive
deflection after the 2nd day.
Test results in Diagram 8 cover too short a period of time to be conclusive but appear to indicate no progressive deflection for stresses of 100 psi.
Deflections of 4 per cent and 6 per cent beams at 0° F over a
period of 1800 hr are shown in Diagram No.9. After applying
initial stresses of 100 psi followed for a short period by 150 psi load was increased to result in stresses of 200 psi for the remainder of the
test period. While the curve flattens slightly toward the end of the
period. the indications are that failure would have occurred had the test
been prolonged. Beams are at a disadvantage as compared with compression
test pieces since there is no increase in lateral dimensions which might
tend to reduce flexural stresses. It will be noted that load was removed
at 550 hr with some recovery, but reapplication of the load caused the same deflection at the end of another day which would have resulted had there been no removal of load.
Plastic flow of two 4- by 8-in. beams is illustrated in Diagrams
Nos. 10 and 11. Continuation of the loading of 200 psi would probably
have resulted in failure. Centre deflections in the span of 80 in. had
become O. 59 in. and O. 68 in. when the tests were discontinued. Release
of load for 24 hours resulted in a recovery of about O. 1 in. at 424 hours but 24 hours after loads were re -applied deflection was about the same as it would have been had loading been continuous.
Diagram No. 12 shows the time -deflection relations for beams
reinforced with wood during a 1200-hr test period. At the end of this
period the beam having a i-in. square tension rod was deflecting at a much lower rate than the beams of Diagram 9 for the same stress of
zoo
psi. The beam with 3/4-in. square tension and compression re-inforcement had almost reached equilibrium. These tests do not in-dicate whether tension or compression reinforcement is most effective. The beam with thet
-Ln. tension bar indicates that some reduction in deflection is due to reinforcement on the tension side. There was no indication of bond failure in any beams reinforced with wood in quick flexure or sustained loading tests.While these flexure tests are limited both in extent and duration they seem to indicate that plain beams will deflect indefinitely if stressed to ZOO psi.
(e) Plastic Flow in Compression
Results of sustained loading tests in compression are summarized in Tables Zl and ZZ. In Table Zl are included all compression specimens comprising pulps of 4, 6 and 8 per cent concentrations, tested at tem-peratures of
a
and 15° F, loads applied parallel and perpendicular to the frozen surface, and including loads ranging from 100 to 400 psi. Reported results of tests for the foregoing variables are plastic flow in per cent per year, or perc entage deformation in inches per inch per year.Specimens were prepared with plane parallel ends and mounted on steel plates in the loading frames (see Diagram No. 15) where load was applied through a loading beam with a 10 to 1 ratio. Cast-iron scale weights of l O, 5, Z and 1 Ib combinations were used to make up the required loads. Readings of deformation were taken between the upper and lower bearing plates by means of an inside micrometer of adjustable length which was read to the nearest O. 001 in. Readings were taken opposite the faces of test prism which were under the loading beam.
To attain unit loads of 300 and 400 psi it was necessary to reduce the lateral dimensions of the test pieces to Z in. by Z in. which in turn led to bending stresses of considerable magnitude owing to unavoidable
eccentricity which resulted in the attempt to centre the knife edge of the loading beam above the centre of the test piece of small area. Eccen-tricity of loading and its amount was apparent in the daily readings of deformation and the reported rates of plastic flow are larger than would have been found for specimens of larger cross -section. Only one of the larger test specimens loaded to 100 and ZOO psi showed evidence of appreciable eccentric loading and the test was continued without re-adjustment in order to observe the effect of such a loading without the accompanying buckling of the specimen which was always noted for the
smaller test pieces. This specimen is 24-1-X as listed in Tables 21 and 22.
Values reported in Tables 21 and 22 were obtained by plotting the time-deformation values to a large scale and determining the slope of a line which averaged the plotted points. Diagram No. 2 which shows the deformation with time of specimen 28-F illustrates the method. It was apparent soon after sustained loading tests of compression specimens were underway that a constant rate of flow was attained after the first few days only by those specimens which were on their way to early des-truction due to high unit stresses or eccentric loading or a combination of these two factors. Specimens carrying unit loads up to 200 psi and which were fairly centrally loaded without exception showed decreasing rates of plastic flow with time instead of constant rates, which other tests had indicated should be expected. The necessity for keeping
specimens under test for an indefinitely long period of time reduced the number of test pieces which could be loaded, although 24 dead -weight loading machines were available. Specimens kept under test until the equipment was dismantled, and first listed in the large group in Table 21, are reported again in Table 22 with rates of plastic flow computed for two later periods beyond the first 200 hr reported in Table 21. For specimens loaded to 100 and 200 psi the flow rates for the first 200 hr ranged from 1. 40 to 5. 46 per cent. These values had decreased and ranged from O. 76 per cent to 0 per cent toward the close of the work. Specimen 24-1-X in preliminary tests had shown the same rate as 22-1-X. Eccentric loading, apparent from the start in the final tests, resulted in an early flow rate of 11. 45 per cent per year but this was reduced to 3. 40 per cent for the last 800 hr. Specimen 22-1-X in final tests showed a
flow of O. 55 per cent. Specimen 26-L. a 2- by 2- by 6-in. specimen loaded to 300 psi was approaching a rate of about 1. 00 per cent per year when the test was discontinued.
Diagram No. 13 shows graphically the time-deformation relation for several specimens which were kept under test to the end of the work. The four specimens of Series 22 are directly comparable and indicate the effect of temperature and direction of loading on rate of flow.
The Series 53 specimens were each reinforced with a i-in. square wooden rod placed in the centre of the specimen and in the direction of the applied load. Their initial rates were 3i per cent per year and for the last 800 hr their rates were 0.34 and 0.33 per cent per year.
Rates of flow for river ice at 0° and 15° and for loads parallel and perpendicular to the freezing surface are included in Table 21. Note
that initial loads were 50 and final loads 75 psi. As would be expected, greatest flow occurred for loads applied parallel to the freezing surface (perpendicular to the optic axis), but the results seem inconsistent in
that greatest rates of flow occurred at 00
F, for both directions of
load-ing. This contradiction of results is not due to a mix-up of specimens or
interchange of report sheets. Both specimens loaded parallel to the
freezing surface were on their way to failure when the tests were dis-continued and the sides of the specim ens were wrinkled or corrugated as is apparent in Photo No. 22 for the pulp test specimen 51-1, referred to at the beginning of the discussion of plastic flow.
These tests would seem to indicate that rate of plastic flow for sustained loads in compression will be less than 1 per cent per year for
loads as high as 200 psi. Total deformation may range from 0.2 per cent
up to 0.6 per cent or more per year being less at 00
F than at 150
F and
occurring mostly at early ages. Reduction of unit loads to 100 psi will
reduce rate of flow to O. 5 per cent per year or less with a smaller total
deformation than for the 200 -lb load.
9. GENERAL CONCLUSIONS
It appears that the structural use of frozen pulp and the selection of allowable working stresses in order that rate of plastic flow and total deformation will be small should be based upon sustained loading tests
in flexure and in compression. While quick tests may indicate trends
which are established by sustained loading they are of little value and
their use may actually lead to unsafe designs. Quick tests may also be
misleading if applied to the selection of proportions of pulp which may
appear best suited for use structurally. While tensile and flexural strengths
are greater for the higher pulp contents in quick tests this relation does
not hold for compressive strength. Sustained loadings in compression
likewise indicate that rate of plastic flow appears to be independent of pulp content so that selection so far as structural values are concerned,
should be based upon combined cost of pulp and cost of forming structural units which will in turn be influenced by methods selected for production
of frozen material. Another factor of importance is the efficiency of the
welding material used in joining together the structural masses. Since
the weld material will probably not exceed a 6 per cent concentration it would seem that the use of a higher concentration for the structural units would be influenced by factors beyond the scope of the physical properties
covered in this report. Each weld is bounded by two ice planes whose
lower physical values, as compared to those of homogeneous pulp, should set the standards for use in structural design.
EFFECT OF FREEZING AND TESTING TEMPERATURES ON FLEXURAL STRENGTH
Beam dimensions: 4 by 4 by 43 in. Span: 40 in.
Loading: 4-pt bending
Pulp content: 4%
Test speed: 1.0 in. Imin.
Frozen at Tested at Average Strength, psi 15° F 0° F 15° F 0° F 15° F 15° F 0° F 0° F 880 1130 1025 920 935 905 1100 1080 905 1015 1060 1000 TABLE 2
EFFECT OF PULP CONTENT AND TESTING RATE ON FLEXURAL STRENGTH
Beam dimensions: 4 by 4 by 43 in. Span: 40 in.
Loading: 4-pt. bending
Pulp contents: 4, 6, and 8%
T est speed: O. 1 in. Imin.
Strength, psi Test Temperature Test speed 15° F O. 1 in./min 1. 0
O. 1
1.0 Pulp Content 4% 750 850 815 930 6% 675 775 790 960 8% 815 890 840 960FAILURE STRENGTH OF BEAMS OF VARIOUS PULP CONTENTS
Beam diInensions: 4 by 4 by 43 in. Span: 40 in.
Each r esu1t represents test of 1 beam
Loading: 4-pt. bending
Test speed: O. 1 in./min.
Strength, psi, at temperatures
Temperature Series No. 19 BA and BB 18 BA and BB 7BA and BB 7 BA and BB 7 BA and BB 6 BA and BB 8 BA 8 BA 8 BA 8 BA 8 BA 8 BA 8 BA and BB 8 BA and BB 8 BA and BB 9 AA and AB 9 BA and BB 14 AA and AB 205 400 835 710 905 785 615 840 740 680 715 720 545 720 520 720 695 725 1% Pulp 325 2% Pulp 455 4% Pulp 695 655 835 885 760 835 715 720 840 905
Strength. psi Temperature 15° F 0° F Series No. 14 AA and AB 620 770 15 BA and BB 750 815 21 AA and BB 650 765 24 BA and BB 660 680 24 BA and BB 575 655 43 BA and BB 625 655 43 BA and BB 505 605 43 BA and BB 565 715 Average 680 710 6% Pulp 11 AA and BB 695 760 16 BA and BB 675 790 20 BA and BB 605 675 20 BA and BB 750 680 20 BA and BB 685 690 20 AA 560 20 AB 880 20 BB 825 22 BA and BB 750 850 22 BA and BB 635 730 41 AA and BB 665 740 41 AA and BB 755 715 41 AA and BB 690 730 44 BA and BB 620 725 44 BA and BB 605 670 44 BA and BB 660 655 51 BA and BB 550 605 51 BA and BB 530 645 Average 650 725
Strength, psi Temperature 150 F 00 F Series No. 7% Pulp 12 BA and BB 750 875 8% Pulp 10 AA and BB 828 970 13 BA and BB 855 965 17 BA and BB 815 840 17 BA and BB 655 720 26 BA and BB 680 750 26 BA and BB 695 720 45 BA and BB 580 770 45 BA and BB 665 570 45 BA and BB 595 695 Average 715 765 10. 5% Pulp 55 BA and BB 750 775 55 BB 750 14% Pulp 57 BB 57 BB 990 905
FLEXURAL STRENGTH AS INFLUENCED BY POSITION OF FROZEN FACE OF BEAM DURING TEST
Beam dimensions: 4 by 4 by 43 in. Span: 40 in.
Test speed: O. 1 in. /min Loading: 4-pt bending Strength, psi 4% pulp, tested at 15° F Average 6% pulp, tested at 0° F Average Frozen face up 615 840 730 Frozen face up 600 680 700 660
Frozen face at side
680 740
710
Frozen face at bottom
745 700 735
FLEXURAL TESTS ON LARGE BEAMS
Beam dimensions: 4 by 8 by 85 in. (beams cast in 2 layers) Span: 80 in.
Loading: 4-pt. bending Test speed: O. 1 in./min.
Temperature 4% Pulp Average Strength, psi 15° F 0° F 340 600 410 695 455 460 400 585 6% Pulp 440 TABLE 6 625
FLEXURAL TESTS OF BUILT -UP (WELDED) BEAMS (See Photo 13)
Beam dimensions: 4 by 8 by 85 in. Span: 80 in.
Loading: 4-pt. bending
Test speed: O. 1 in./min
Strength, psi
Temperature of Test 15° F
Original Test Rewelded
0° F
Original Test Rewelded
4% Pulp 400 585 300 470 500 485
Temperature
COMPRESSION TESTS ON 4-IN. CUBES
Test speed: O. 1 in. Imino except as indicated
Compressive strength, psi
Load Applied Series No. 19 18 18 Parallel 830 990 950 Perpendicular 1040 975 950 Parallel 1% Pulp 970 2% Pulp 1100 Perpendicular 1290 1380 4% Pulp 1 990 1110 1225 1550 1(1. 0" /min) 1110 1340 1850 2420 2 940 1270 1260 1440 2{1. Oil/min) 1240 1520 1750 2400 3 950 1310 1350 1600 4 975 1205 1160 1440 5 985 1120 1310 1510 6 905 1200 1020 1165 7 1000 1190 1240 1520 6 1310 1670 9 1180 1420 15 955 1140 1210 1420 21 850 1095 1170 1470 40 985 1050 1180 1280 40 960 995 1220 1310
Temperature
Compressive strength, psi
Load Applied Series No.
Parallel Perpendicular Parallel Perpendicular
24 955 1175 1320 1840 24 875 1130 1370 1805 8 970 1225 1220 1450 8 945 1255 1385 1400 Average 950 1160 1235 1480 O. I"/min. 6% Pulp 11 960 1140 1345 1610 16 935 1270 1205 1610 20 1090 1130 1310 1775 20 1000 1180 1335 1740 20 1275 1665 22 1005 1205 1375 2010 22 1005 1205 1445 1880 41 980 1015 1125 1625 41 955 1025 1180 1590 51 1035 1410 1410 1750 51 1160 1375 1420 1670 Average 1010 1195 1320 1720 7% Pulp 12 1070 1290 1370 1600 8% Pulp 10 10 1080 990 1140 1105 1245 1450 1410 1480
Temperature
Compressive strength, psi
Load Applied Series No.
Parallel Perpendicular Parallel Perpendicular
13 17 26 26 Average 1180 1215 1460 1475 930 1145 1340 1540 1085 1245 1450 1875 1065 1280 1420 1860 1055 1190 1435 1610 10.5% Pulp 55 55 1540 1530 1645 1625 14% Pulp 57 1170 1200 1490 1560 57 1210 1005 1515 1545 River Ice 765 860 1215 1240 II II II 760 905 1055 1195 II II II 775 955 1255 II II II 1180 Average 765 905 1055 1195
Frozen Tap Water 1025 935 1200 850
II II II II II 650 600 1085 590
II II II II II 725 530
II II II II II 827 770
II II II II II 725 615
..
Average 790 690 1140 720
The results of tests on frozen tap water are inconsistent with relative
values usually obtained for the two directions of applied load. The inverted
COMPRESSION TESTS ON FROZEN PULP CYLINDERS
Dimensions of test specimens: 3. 3 in. in d iarn , by 6t in. high Test speed: O. I in. /min
Compressive strength, psi
Pulp Frozen at 15 0 F 0 0 F 15 0 F 0 0 F Content Tested at 150 F 15 0 F 0 0 F 0 0 F 1150 1105 1535 1390 4% 1150 1130 1460 1460 1035 1140 1440 1380 Average 1110 1130 1480 1410 1075 1130 1425 1395 6% 1100 1150 1440 1450 1120 1160 1510 1425 Average 1130 1145 1525 1410 985 1080 1450 1390 8% 1025 1135 1450 1430 1060 1195 1590 1490 Average 1025 1135 1495 1430
COMPRESSION TESTS OF FROZEN PULP PRISMS
USED IN SPECIFIC GRAVITY TESTS
Dimensions of prisms: 4 by 4 by 8 in. app r ox.
Test speed: O. 1 in. /min
Compressive strength, psi 15° F
Series Pulp Content Parallel to Freezing Surface
43 4% 865 870 880 Average 870 44 6% 920 940 940 Average 935 45 8% 930 930 950 Average 940 55 10.5% 940 930 955 960 920 Average 940 57 14% 950 960 Average 955
TENSION TESTS OF FROZEN PULP (SLOW FREEZE) Test specimens: cross -s ection 6 in. square, approx.
Test speed: O. 1 in. /min
Tensile strength, psi
15° F 0° F
Orig. 1 st 2nd Orig. 1 st 2nd
Pulp Content Test Weld Weld Test Weld Weld
258 370 340 320 284 271 350 368':' 4% 288 334>:' 170 369 343 346 244 394 288* 394 352 344':' 405 337 Average 305 310 370 331 260 423';< 274 335 258 313 288 366 342 6% 354 394':' 352 425 325 390 325';< 475 296 480 410 515 475 Average 350 368 425 340 466 520 438 8% ...1.. 328 410 348 _ .. I... 450 352 445 460':' 342 Average 458 340 490 415
6 quick freeze (3/8" layers in wind tunnel) 435 342
14 quick freeze (3/8" layers in wind tunnel) 645 252';'
700 690
14 slow freeze (2" layer) 625 442
520
Note: ,;< Broke outside of weld on retest
...1..
Broken in handling, before first test.
TENSION TESTS OF FROZEN PULP (SLOW FREEZE)
Test specimens: cross -section 8 in. square, app rox,
Test speed: O. 1 in./min.
Tensile strength, psi
150
F 00
F
Pulp Cant ent Orig. Test 1st Weld Orig. Test 1 st Weld
292 4% 315 300 320':' 305 274 244 240 Average 304 272 280 246 270';' 266 270 6% 368 365 465 300 400 275 425 255 318 305 410 355 340 345 Average 333 304 381 305 394 340 415 225 8% 353 285 435 415 422 325 432 90,;, Average 390 316 427
TENSION TESTS OF FROZEN PULP (SLOW FREEZE)
Test specimens: molded vertically in layers with ice planes with welds normal to direction of loading Test speed: O. 1 in. /min
Tensile strength, psi
Pulp Content 15° F 270 4% 410 420 120 195 270 6% 275 240 355
QUICK BOND TESTS OF WOOD IN FROZEN PULP
Test speed: O. 1 in. /min
Temperature of Test
Pulp content: 6%
Computed bond stress, psi
-l/Z"
diameter round birch dowelsAverage
-i
/z»
square white pine D2SAverage -3/4" square larch DZS Average 410 415 440 445 465 490 444 340 370 405 372 280 Z90 340 305
-l/Z"
diameter birch Z failuresin bond
Average
590 690
640
-4 failures in wood in compression Average
-l/Z"
square white pine 6 failures ofwood in compression
Average
520
361
-3/411 square larch 2 bond failure s
Average
358 445
QUICK BOND TESTS OF STEEL IN FROZEN PULP
Test speed: O. 1 in. /min
Temperature of Test
-1/211 diameter steel rod
Pulp content: 6% C omput ed bond stress, psi 116 117 122 134 136 157 159 Average
-1/411 diameter steel rod
Average
-1/211 diameter steel rod
Average
-1/411 diameter steel rod
Average 134 76 76 77 96 132 175 105 156 160 164 178 183 191 171 102 193 209 215 239 191
SHEAR STRENGTH OF WELDED JOINTS (See Photo 10)
Area of shear: 23 sq in., approx. Test speed: O. 1 in. /min
Shear strength, psi
%
Pulp in Weld Mortar 4 Average 6 Average 8 Average Tested at Tested at 15° F 0° F 340 465 430 470 430 480 390 510 375 555 393 496 435 440 440 480 410 575 380 585 480 605 415 537 410 530 455 550 455 565 470 585 480-
(bas e failed) -454 556SHEAR STRENGTH OF HOMOGENEOUS FROZEN PULP Test specimens cut from 4- by 8-in. beams
Area of shear: 15 sq in., approx
Test speed: O. 1 in. /min
Shear strength. psi
0/0
Pulp 15° F 0° F4 635':< 715
570 865
680 920
Average 662 833
':' See Photo No. 11. When test was stopped specimen
appeared as in photograph and was still carrying 510 psi (based on original area)
TABLE 17
TENSION TESTS ON WHITE PINE REINFORCEMENT Test specimens: 1/2 in. sq., ends embedded in frozen pulp
Test speed: O. 1 in. /min.
Tension strength. psi
Four rods - s elected at random 4600
7900 9400 12250
FREEZING TESTS ON PULP IN WIND TUNNEL (See Diagram 1)
Equipment: Friez air meter, Leeds and Northrup - Potentiometer,
copper constantan thermocouples
Thickness Time, Minutes, Additional Time,
of Layers, Temp. of for Pulp to Minutes for Temp. Number of
Pulp Content, 0/0 In. Air, 0 F Air Speed Reach 320 F to Drop Below 320 F Tests
6 3/8 4 550 ft/min. 2 to 4 Ave. 71 3 6-;\: rn , p. h. 6 3/8 4 1100 ft/min. 12i rn , p. h. 2 to 4 Ave. 47.5 5 6 3/8 4 0 5 247 1 6 1 4 lzi rn , p. h. 9 138 1 6 3/8 15 6-;\: rrn pc h, 4 to 6 129 1 92 1 6 3/8 15 12i rn , p. h. 4 to 6 Ave. 85 3 6 3/8 15 0 5 350 1 14 3/8 4 6± rn , p. h. 2 to 4 55.5 2 14 3/8 4 1zt rn, p. h. Z to 4 40. Z 6
FLEXURAL TESTS ON REINFORCED FROZEN PULP BEAMS Beam dimensions: 4 by 4 by 43 in.
Span: 40 in.
Test speed: O. 1 in. /min
Loading: 4-pt bending Strength, psi';' Surface Area per
%
inch of0/0
Reinforce- lengthPulp Reinforcement ment':":' sq. in. 15° F 0° F
4
t"
square white pineD2S in tension 1. 56 2.0 955 1010 1030 910 1035 825 925 1070 Ave. 1065 950
6
t"
square white pine 1. 56 2. 0 1035D2S in tension 6 セB square larch D2S in tension 3.52 3. 0 1150 1395 1060 1270 1100 1270 Ave. 1105 1310 6 1."4 square larch D2S 7.04 3. 0 1200 1635 1 in tension 7.04 3.0 1370 1720 1 in compression 1735 Ave. 1235 1695
6
i"
diameter round steel . 30 . 785 880 1175straight - no hooks 975 1125
810 1115
Ave. 890 1140
6
Reinforcement
i"
diameter round steelends hooked
%
Reinforce -ment':":' . 30 Surface Area per inch of length sq. in. .785 Ave. 15° F 00 F 885 1100 815 1030 840 1100 900 1100 860 1080* -
Computed as for plain elastic beam ':<':' - Based on beam section of 16 sq in.SPECIFIC GRAVITY AND UNIT WEIGHTS OF FROZEN PULP, HOMOGENEOUS AND FREE OF ICE LAYERS
Weight - Cu Ft Lb
Pulp Content Specific Gravity (Water
=
62.5 Ib cu ft )0.9357 4% 0.9320 0.9344 Ave. 0.9340 58.4 0.9404 6% 0.9406 0.9386 Ave. 0.9399 58. 7 0.9407 8%
o.
9413 0.9401 Ave. 0.9407 58.8 0.9420 10.5% 0.9489 0.9435 Ave. 0.9448 59.0 14% 3/8" layers quick 0.9524freeze in wind tunnel 0.9663
Ave. 0.9593 60.0 14% Slow freeze 0.9606 4" layer 0.9632 Ave. 0.9619 60.1 4% 6%
Welded Block approx l2i" x 12i" x 1611
sent to Quebec in August
Welded Block appr ox 12" x l2i" x l6i
58.2 59.5
Except where more than one value is given. the rate is for the
first 200 hours. Other values are for longer time intervals.
15° F Load, psi 100 200 300 セ Parallel 24-1 0.39 24-H 14.50 24-E 304.0 4% Perpendicular 27 -124-2 0.871. 31 24-1-x*24-1 11. 4510. 10 27-F24-0 196.0140.0 27-5 1. 31 6% Parallel 20-1 1. 45 22 -1 UNセVJN 35.4 20-D+ 20-F (9.20 38.4 53-2 (6.85++ 3.41 20-2 1. 53 22-2 3.08* 28-G (8.00 (3.96 Perpendicular 28-4 O.79 20-6 5. 70 20-E+ 1.75 28-2 4.58 28-1 1.40* 8% Parallel 26-1 1.00 26 ..0 9.85 30-1 0.96 Perpendicular 26-2 0.83 26-K 9.90 26-H (17.8 30-4 0.49 (12.9 River Ice Parallel Perpendicular 50 psi 20.80** 2. 62 75 psi 63. 5 5.25 Notes: * **
- Tests continued beyond 200 hours. See Table 22
- Sides were wrinkling or corrugating.Se€, photo No.
+ - Failed before any readings were taken.
++ - Reinforced with
til
s q wooden rod. Test continued.4% Parallel Perpendicular 24-4 27 -2 24-3 27-6 100 1. 62 1. 14 1. 07 1. 14 0° F Load, psi 200 24-N 24-0 300 (15.10 (10.70
--
+
24-F 24-6 400 139.0-- +
6% Parallel 20-3 0.26 22-l-X 3. 32* 20-N (12. 1 20-H 35.8 28 -2 1.40>:< 22 -3 3.19* (6. 1 28-F 29.0 53 -1 3. 50++ Perpendicular 20-4 1. 31 22-4 2.19* 20-0 (8.30 20-1 20. 50 (4.56 28-5o.
39 28-H (8.45 (6. 37 8% Parallel 26-4 1. 61 26-E 16.9 30-2 1. 31 Perpendicular 26-3 O. 17 26-L (3.72 30-5 1. 31 (2.80 (1. 18River Ice 50 psi 75 psi
Parallel 24.90** 116.0
Perpendicular 2.92 5. 57
Notes:
*
-
Tests continued beyond 200 hours. See Table 22.>:<*