HAL Id: hal-02386234
https://hal.archives-ouvertes.fr/hal-02386234
Submitted on 15 Jul 2020
HAL is a multi-disciplinary open access
archive for the deposit and dissemination of
sci-entific research documents, whether they are
pub-lished or not. The documents may come from
teaching and research institutions in France or
abroad, or from public or private research centers.
L’archive ouverte pluridisciplinaire HAL, est
destinée au dépôt et à la diffusion de documents
scientifiques de niveau recherche, publiés ou non,
émanant des établissements d’enseignement et de
recherche français ou étrangers, des laboratoires
publics ou privés.
Protein NMR resonance assignment without spectral
analysis: 5D SOlid-state Automated Projection
SpectroscopY (SO-APSY)
Henry Orton, Jan Stanek, Tobias Schubeis, Dylan Foucaudeau, Claire Ollier,
Adrian Draney, Tanguy Le Marchand, Diane Cala de Paepe, Isabella Felli,
Roberta Pierattelli, et al.
To cite this version:
Henry Orton, Jan Stanek, Tobias Schubeis, Dylan Foucaudeau, Claire Ollier, et al.. Protein NMR
resonance assignment without spectral analysis: 5D SOlid-state Automated Projection SpectroscopY
(SO-APSY). Angewandte Chemie International Edition, Wiley-VCH Verlag, 2019, 59 (6),
pp.2380-2384. �10.1002/anie.201912211�. �hal-02386234�
COMMUNICATION
Protein NMR resonance assignment without spectral analysis: 5D
SOlid-state Automated Projection SpectroscopY (SO-APSY)
Henry W. Orton,
[b]‡Jan Stanek,
[a,c]‡Tobias Schubeis,
[a]Dylan Foucaudeau,
[a]Claire Ollier,
[a]Adrian W.
Draney,
[a]Tanguy Le Marchand,
[a]Diane Cala-De Paepe,
[a]Isabella C. Felli,
[d]Roberta Pierattelli,
[d]Sebastian Hiller,
[e]Wolfgang Bermel,
[f]and Guido Pintacuda
[a] Abstract: Narrow proton signals, high sensitivity, and efficientcoherence transfers provided by fast magic-angle spinning at high magnetic fields make automated projection spectroscopy feasible in protein solid-state NMR. We present the first ultra-high dimensional implementation of this approach where 5D peak lists are reconstructed from a number of 2D projections for protein samples of different molecular size and aggregation state, featuring limited dispersion of chemical shifts or inhomogeneous broadenings. The resulting datasets are particularly suitable to automated analysis, yielding rapid and unbiased backbone resonance assignments. One of the major bottlenecks for the widespread use of NMR spectroscopy in structural biology is the difficulty to automate data acquisition and analysis of complex protein spectra. Specific information on individual nuclei is typically achieved by the combination of several 3D spectra which correlate shifts of sequential or proximal 1H, 15N and 13C nuclei.[1] Protein spectra
with higher (>3) dimensionality may yield multiple nuclear correlations within fewer experiments, increasing resolution, simplifying resonance assignment and thus pushing forward the size limits of the proteins amenable to site-specific NMR studies.[2] The acquisition of such spectra however requires
alternative approaches to sample the indirect time space, since regular sampling leads to impractical experimental durations and data matrices. Randomised non-uniform sampling (NUS)[3] is a
sparse sampling technique proposed to solve the first problem. NUS aims to reconstruct a high-dimensional spectrum from data acquired at randomly chosen time points, but it requires particular expertise in processing and analysis. Yet the issue of the size of the data matrix remains. Automated projection spectroscopy (APSY),[4] is an alternative tool which allows direct
inference of a high-dimensional peak list from a number of lower order projection spectra (typically 2D). APSY represents an elegant concept which allows to bypass spectral analysis and delivers an output that directly contains the positions of all resonances. As such it is in principle amenable to widespread access even by inexperienced spectroscopists.
APSY in solution NMR spectroscopy has suffered from a major drawback: the sensitivity required to implement APSY can only by provided by globular proteins with molecular sizes smaller than about 20 kDa (fast tumbling),[5] or by intrinsically
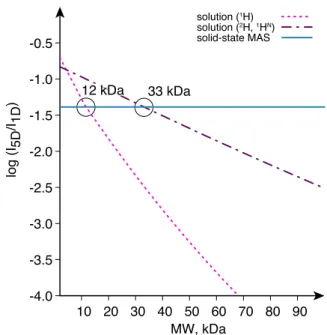
disordered proteins.[4b, 6] Figure 1 illustrates the rapid loss of
sensitivity with increasing molecular size for a 5D experiment in solution of a protonated and highly-deuterated molecule respectively. The deadlock is removed in proton-detected solid-state NMR at fast magic-angle spinning (MAS). Narrow proton signals, high sensitivity, and efficient coherence transfers can be obtained at high magnetic fields, independent of molecular mass, at 60 kHz MAS in deuterated proteins, reprotonated at the exchangeable sites,[7] and at 100 kHz MAS and above in
fully-protonated samples.[8] As illustrated in Figure 1, the efficiency of
hyperdimensional experiments in solids outperforms the solution case above 12 and 33 kDa respectively for a protonated and highly-deuterated protein. As demonstrated below, this makes five dimensional correlations by SOlid-state APSY (SO-APSY) feasible on microcrystalline and fibrillar proteins, which in turn allows their expeditious automated backbone resonance assignments.
We have developed a 5D experiment (H)NCOCANH (Figure 2a) which transfers coherences from each amide proton to the amide proton of the previous residue. This unidirectional coherence pathway is ensured by two cross-polarization (CP) steps between 1H and15N nuclei,two selective CP stepsbetween
bonded 15N and 13C /13C’ nuclei, and one 13C -13C’ scalar
transfer. In contrast to previous implementations,[9] this
experiment evolves the chemical shift of each of the nuclei (13C ,
Figure 1. Sensitivity of hyperdimensional NMR plotted over molecular weight
in solution and in the solid state with respect to 1D 1H spectra. The curves
show the calculated efficiency of a 5D amide proton linking experiment on a protonated molecule in solution (pink dotted curve), of the TROSY based variant on a highly deuterated molecule in solution (brown dashed curve) and of the analogous experiment in the solid state at fast MAS (cyan solid curve). Calculations assumed scalar transfers in solution, with transverse relaxation modelled using Redfield theory, and a mix of scalar and dipolar transfers in solids (see SI for details).
[a] Dr.J.Stanek,Dr.T.Schubeis,D.Foucaudeau,C.Ollier,Dr. A.Draney, Dr. T. Le Marchand, Dr. D. Cala-De Paepe, Dr. G. Pintacuda Centre de Résonance Magnétique Nucléaire à Très Hauts Champs (FRE 2034 CNRS, UCBL, ENS Lyon), Université de Lyon 69100 Villeurbanne, France
E-mail: [email protected] [b] H. W. Orton
Research School of Chemistry, Australian National University Canberra, ACT 2601, Australia
[c] Dr. J. Stanek
Faculty of Chemistry, University of Warsaw 02089 Warsaw, Poland
[d] Prof. Dr. I. C. Felli, Prof. Dr. R. Pierattelli
CERM and Department of Chemistry, University of Florence 50019 Sesto Fiorentino, Italy
[e] Prof. Dr. S. Hiller
Biozentrum, University of Basel 4056 Basel, Switzerland [f] Dr. W. Bermel
Bruker BioSpin GmbH
Silberstreifen, 76287 Rheinstetten, Germany ‡ These authors have contributed equally to the work.
Supporting information for this article is given via a link at the end of the document. -4.0 -3.5 -3.0 -2.5 -2.0 -1.5 -1.0 -0.5 10 20 30 40 50 60 70 80 90 log (I 5D /I 1D ) MW, kDa solution (1H) solution (2H, 1HN) solid-state MAS 33 kDa 12 kDa
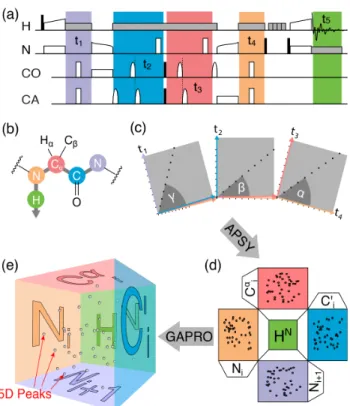
Figure 2. 5D (H)NCOCANH experiment and schematic for SO-APSY
acquisition and analysis. a) Time diagram of RF irradiation. High-power 90° and 180° are represented by black and white rectangles, respectively, and selective pulses by bell shapes. Cross-polarization transfers are represented as open shapes on two parallel channels, and grey rectangles indicate heteronuclear decoupling. The five chemical shift evolution periods are highlighted as colored fields. Additional details can be found in the SI. b) Coherence transfer pathway. c) Time-domain sampling scheme for the SO-APSY experiment in the indirect 4D space, where each projection is characterized by three polar angles , , and . d) Frequency-domain orthogonal projections. e) Reconstruction of the peak positions in the 5D space by Geometrical Analysis of PROjection (GAPRO algorithm).[4a]
13C’, 15N) traversed along the protein backbone. The experiment
generates a 5D dataset where each peak correlates the chemical shift of five consecutive backbone nuclei (Figure 2b). It can be acquired as a SO-APSY experiment by collecting a number of 2D projections, each characterized by projection angles , , and within the 4D indirect time space (Figure 2c-e).
The method was first established on a sample of uniformly
15N- and 13C-labelled and fully protonated microcrystalline GB1
protein (56 aa), packed in a 0.7 mm rotor and spun at 111 kHz on a 23.5 T NMR spectrometer (1H frequency of 1 GHz). Under
these conditions, the efficiency of the 5-step transfer is ensured by long R1 and coherence lifetimes, and the sensitivity amounts
to ~20% with respect to a basic experiment correlating 1H-15N
nuclei. The SO-APSY series was acquired using a newly developed TopSpin module for about 1.5 days at which point convergence was achieved with 24 projections (no additional 5D peaks were found by including the last projections). The first four projections, where the chemical shift of a single heteronucleus is evolved in the indirect dimension, are shown in Figure 3. Contrary to fully dimensional spectral data obtained with NUS, identifying resonances in APSY is straightforward and does not require prior knowledge.[10] The Geometrical Analysis of
PROjection (GAPRO) algorithm[4a] identifies robust peaks, as
long as they are supported (resolved) in at least Smin projections
(here 7), and the on-the-fly analysis yielded a list with all 54 expected 5D peaks (Table S8).
The experiment was then acquired on two, more challenging targets, a much larger microcrystalline protein (the 32 kDa Cu(I)-Zn loaded dimeric superoxide dismutase, SOD)[11] and a fibrillar
aggregate (D76N 2 microglobulin, 2mD76N).[12] Both samples
were uniformly 15N, 13C and 2H labelled with 100%
back-exchange of labile amide protons, and packed in a 1.3 mm rotor spun at 60 kHz MAS on a 1 GHz spectrometer.
For SOD, which contains 153 residues, but several dynamic regions and proline residues, a maximum of 115 peaks can be expected in the 5D experiment. The SO-APSY series was accomplished in 32 projections in 3 days. Despite the significant degree of peak overlap in the first (orthogonal) projections (Figure 3, middle row), the tilted projections contributed a total of 95 peaks. For 2mD76N, spectral overlap does not come from
protein size (only 62 residues S20-R81 are observed in solids), but from limited dispersion of chemical shifts and increased linewidths, characteristic for fibrillar samples. The SO-APSY series was acquired with 32 projections in about 2.5 days. GAPRO identified 46 correlations, proving that consistent 5D peak coordinates can be determined even within regions of severe overlap in orthogonal 2D projections (Figure 3, bottom).
The 5D experiment has the particular advantage over conventional 3D triple-resonance spectra that a single peak encodes amide shifts from two neighboring residues. This alone allows sequential linking of amide resonances along the protein backbone by matching shared 15N frequencies. In cases
where 15N resolution is limited or an amide proton is
unobservable, assignment of sequential residues can be accomplished with the acquisition of a second 5D experiment, (H)NCACONH. It performs a similar coherence transfer along the protein backbone, but in a reverse (i.e. forward) direction (Figure 4a), with comparable efficiency (Table S1). Such experiment was indeed acquired as a SO-APSY series for the three samples and yielded an equivalent number of signals (Table S9). Peaks from both experiments overlay in the 15N(i)– 15N(i+1) plane, and effectively connect consecutive 1HN(i) and 1HN(i+1) amide protons (two-way 15N linking).[9] A pair of forward
and backward 5D data sets also correlate consecutive amide (i and i+1) protons to pairs of 13C (i)–13C’(i) frequencies, effectively
building quartets of shifts (15N(i), 13C (i), 13C’(i), 15N(i+1)) that
unambiguously link amide protons at every second step of the assignment protocol, as shown in Figure 4c.
Five-dimensional peak lists are inconvenient for a conventional manual analysis, and their potential for sequential assignment is optimally exploited with a powerful automated assignment algorithm. We employed the FLYA software[13] which
is particularly flexible with respect to customized correlation schemes (see the SI for FLYA definitions, parameters and input data). In the case of GB1, a complete assignment of all backbone nuclei was obtained when providing two 5D peak lists from a pair of forward and backward SO-APSY experiments. The FLYA output schematic which compares the assigned peaks to a reference assignment[8a] is shown in Figure 5a.
In the case of SOD, the automated analysis by FLYA reveals 8 segments of robust (“strong”) assignments (Figure S3a), with 280 chemical shifts consistent with published data.[11]
Figure 3. Orthogonal SO-APSY projections from 5D (H)NCOCANH experiment of microcrystalline GB1 and SOD, and fibrils of 2mD76N. These projections
exclusively evolve a single nucleus in the indirect dimension: from left to right, intraresidue (i)15N,13C ,13C’,and sequential(i+1)15N with respect to the directly
detected amide proton (i) shifts. Crosses indicate experimental peaks identified by GAPRO algorithm,and peak labels indicate residue assignments obtained from automated analysis (see below).
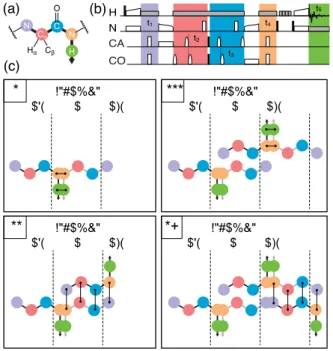
Figure 4. Sequential resonance assignment from a pair of 5D backward and
forward experiments. (a) Coherence transfer pathway of a forward (H)NCACONH experiment. (b) Time diagram of RF irradiation, with the same conventions of Figure 2a. (c) Schematic of resonance assignment, obtained by matching either 15N, 1HN pairs (odd steps) or quartets of 15N(i), 13C (i), 13C’ and 15N(i+1) chemical shifts (even steps).
known to be dynamic,[11] and signals were sparse in the regions
50-70 and 100-110 due to the presence of five proline residues. An almost complete assignment can be recovered for these regions (Figure 5b), if the 5D peak lists are supplemented with information on residue type, as for example that contained in 3D C –N–H correlations (in total 346 correct assignments). About 4% of chemical shifts were incorrectly assigned when compared to a reference assignment obtained by conventional
proton-detected 3D spectra. This reflects an inherent uncertainty that arises during automated assignment, which must be considered when inferring firm conclusions on protein site-specific dynamics or interactions. FLYA analysis of 5D peak lists obtained for 2mD76N leads to three regions of reliable assignments at the
fibril core (27-31, 34-45, 59-65), while many regions with reasonably complete observed correlations are assigned only tentatively (Figure S3b). We attribute this result to the significantly smaller distribution of chemical shifts in this sample and their decreased precision (increased line widths). Similar to SOD, this issue can be addressed by providing supplementary input for the automatic analysis. Notably, an additional unassigned 3D C –N–H peak list allows to extend the assignment to most of the fibril core, including regions 46-49, 56-58, 67-71 and 73-75 (Figure 5c) giving rise to 166 correctly assigned chemical shifts and 5 misassignments (3%).
Although a small number of incorrect assignments were identified within this study when compared to manually assigned 3D spectra, they do not form clusters spanning more than 1 or 2 residues, and are frequently at the extremities of long tracts of assigned residues. In effect, these misassigned shifts do not affect the prediction of dihedral angles , , which is the primary structural information encoded in 1HN, 15N, 13C , 13C and 13C’
shifts. Indeed, when using the widely applied TALOS+ algorithm,[14] the dihedral angles obtained from chemical shifts
are virtually identical, with only 1 outlier ( for residue T137 of SOD) among 214 angles reliably predicted in both reference and FLYA-derived data sets for SOD and 2mD76N (Figure 5d,e).
Additionally, it has been shown that reliable structural modelling can be obtained with up to 10% missing or incorrect proton chemical shifts provided that robust algorithms (such as CANDID[15]) are employed.[16] Therefore we would expect 5D
APSY of yet unassigned proteins in the solid state to offer appropriate data for subsequent modelling of structure and dynamics. 15Ni+1 ppm 13CO i ppm 13CAi ppm 15Ni ppm 1H i / ppm 1Hi / ppm 1Hi / ppm 1Hi / ppm
D
OS
1B
G
β2m
D76N 50 nm 100 µm Cα C N O Hα Cβ H N(a)
(b)
N H t1 t5 t4 CA t2 t3 CO(c)
!"#$%&" $'( $ $)(*
!"#$%&" $'( $ $)(***
!"#$%&" $'( $ $)(*+
!"#$%&" $'( $ $)(**
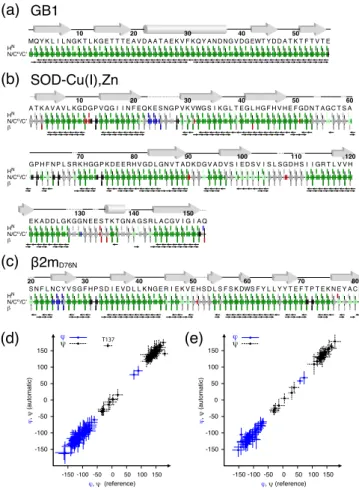
Figure 5. Graphical summary of automated assignments of microcrystalline
GB1 (a), SOD (b) and fibrils of 2mD76N (c) by FLYA, superimposed to the
amino acid sequence and to a sketch of secondary structure elements. Assignments in agreement or incompatible with the reference are colored in green and red, respectively. Assignments with low confidence levels in FLYA are colored in light green or in grey, depending on whether they can or cannot be confirmed by manual inspection. Additional assignments found by FLYA are shown in dark blue. Black arrows represent all correlations observed in the two 5D experiments. Dotted lines connecting grey arrows ( -strands) and cylinders (helices) denote flexible regions where resonances are missing or sparse. (d,e) Correlation of backbone dihedral angles , predicted by TALOS+ based on reference and automatically obtained 1HN, 15N, 13C , 13C
and 13C’ chemical shifts for SOD (d) and 2m D76N (e).
In summary, we have presented the first example of ultra-high dimensional (>3) automated projection spectroscopy in solid-state NMR (SO-APSY) and demonstrated its power with respect to automatic resonance assignment of samples of different molecular size and aggregation state. The approach was illustrated with the design of two new 5D pulse sequences that correlate backbone nuclei with amide protons. A module to acquire 2D projections and to reconstruct 5D peak lists was designed within the widespread software TopSpin, and is now readily accessible to the NMR community. SO-APSY tolerates higher peak overlap and yields data prone to automatic analysis, thus accelerating the identification of sequential correlations. We anticipate that in a context where even faster MAS rates and longer coherence lifetimes are available, SO-APSY techniques will become a key for rapid and simple spectroscopic analysis, broadening the range of targets amenable to NMR.
Acknowledgements
The work was funded by the European Research Council (ERC) under the European Union’s Horizon 2020 research and innovation programme (ERC-2015-CoG GA 648974), by the CNRS (IR-RMN FR3050), and by the EU-project iNext (GA 653706). HO was supported by the Westpac Foundation with a Future Leaders Scholarship, and JS by the EC’s REA with a MSCA fellowship (GA 661799). The project was co-financed by the Polish National Agency for Academic Exchange (contract No PPN/PPO/2018/1/00098).
Keywords: solid-state NMR • proton detection • NMR
resonance assignment • projection spectroscopy • automation
[1] M. Sattler, J. Schleucher, C. Griesinger, Prog. Nucl. Magn. Reson.
Spectrosc. 1999, 34, 93-158.
[2] a) M. Nowakowski, S. Saxena, J. Stanek, S. erko, W. Ko mi ski, Prog.
Nucl. Magn. Reson. Spectrosc. 2015, 90-91, 49-73; b) W. T. Franks, K. D.
Kloepper, B. J. Wylie, C. M. Rienstra, J. Biomol. NMR 2007, 39, 107-131;
c) R. Linser, B. Bardiaux, V. Higman, U. Fink, B. Reif, J. Am. Chem. Soc.
2011, 133, 5905-5912; d) M. Huber, A. Böckmann, S. Hiller, B. H. Meier,
Phys Chem Chem Phys 2012, 14, 5239-5246; e) B. J. Wylie, M. P. Bhate,
A. E. McDermott, Proc. Natl. Acad. Sci. USA 2014, 111, 185-190; f) S.
Xiang, V. Chevelkov, S. Becker, A. Lange, J. Biomol. NMR 2014, 60,
85-90.
[3] M.Mobli,J.C.Hoch,Prog.Nucl.Magn.Reson.Spectrosc. 2014, 83, 21-41.
[4] a) S. Hiller, F. Fiorito, K. Wüthrich, G. Wider, Proc. Natl. Acad. Sci. USA
2005, 102, 10876-10881; b) S. Hiller, C. Wasmer, G. Wider, K. Wüthrich,
J. Am. Chem. Soc. 2007, 129, 10823-10828.
[5] A. D. Gossert, S. Hiller, C. Fernández, J. Am. Chem. Soc. 2011, 133,
210-213.
[6] a) R. L. Narayanan, U. H. Dürr, S. Bibow, J. Biernat, E. Mandelkow, M. Zweckstetter, J. Am. Chem. Soc. 2010, 132, 11906-11907; b) M. G.
Murrali, M. Schiavina, V. Sainati, W. Bermel, R. Pierattelli, I. C. Felli, J.
Biomol. NMR 2018, 70, 167-175.
[7] a) J. R. Lewandowski, J. N. Dumez, Ü. Akbey, S. Lange, L. Emsley, H. Oschkinat, J. Chem. Phys. Lett. 2011, 2, 2205-2211; b) M. J. Knight, A. L.
Webber, A. J. Pell, P. Guerry, E. Barbet-Massin, I. Bertini, I. C. Felli, L. Gonnelli, R. Pierattelli, L. Emsley, A. Lesage, T. Herrmann, G. Pintacuda,
Angew. Chem. Int. Ed. Engl. 2011, 50, 11697-11701; c) E. Barbet-Massin,
A. J. Pell, J. S. Retel, L. B. Andreas, K. Jaudzems, W. T. Franks, A. J. Nieuwkoop, M. Hiller, V. Higman, P. Guerry, A. Bertarello, M. J. Knight, M. Felletti, T. Le Marchand, S. Kotelovica, I. Akopjana, K. Tars, M. Stoppini, V. Bellotti, M. Bolognesi, S. Ricagno, J. J. Chou, R. G. Griffin, H. Oschkinat, A. Lesage, L. Emsley, T. Herrmann, G. Pintacuda, J. Am.
Chem. Soc. 2014, 136, 12489-12497.
[8] a) L. B. Andreas, K. Jaudzems, J. Stanek, D. Lalli, A. Bertarello, T. Le Marchand, D. C. De Paepe, S. Kotelovica, I. Akopjana, B. Knott, S. Wegner, F. Engelke, A. Lesage, L. Emsley, K. Tars, T. Herrmann, G. Pintacuda, Proc. Natl. Acad. Sci. USA 2016, 113, 9187-9192; b) J. Stanek,
L. B. Andreas, K. Jaudzems, D. Cala, D. Lalli, A. Bertarello, T. Schubeis, I. Akopjana, S. Kotelovica, K. Tars, A. Pica, S. Leone, D. Picone, Z. Q. Xu, N. E. Dixon, D. Martinez, M. Berbon, N. El Mammeri, A. Noubhani, S. Saupe, B. Habenstein, A. Loquet, G. Pintacuda, Angew. Chem. Int. Ed.
Engl. 2016, 55, 15504-15509; c) J. Struppe, C. M. Quinn, M. Lu, M. Wang,
G. Hou, X. Lu, J. Kraus, L. B. Andreas, J. Stanek, D. Lalli, A. Lesage, G. Pintacuda, W. Maas, A. M. Gronenborn, T. Polenova, Solid State Nucl.
Magn. Reson. 2017, 87, 117-125.
[9] a) S. Xiang, K. Grohe, P. Rovó, S. K. Vasa, K. Giller, S. Becker, R. Linser,
J. Biomol. NMR 2015, 62, 303-311; b) L. B. Andreas, J. Stanek, T. Le
Marchand, A. Bertarello, D. Cala-De Paepe, D. Lalli, M. Krej íková, C. Doyen, C. Öster, B. Knott, S. Wegner, F. Engelke, I. C. Felli, R. Pierattelli, N. E. Dixon, L. Emsley, T. Herrmann, G. Pintacuda, J. Biomol. NMR 2015,
62, 253-261.
[10] A. Klein, S. K. Vasa, R. Linser, J. Biomol. NMR 2018, 72, 163-170.
[11] M. J. Knight, A. J. Pell, I. Bertini, I. C. Felli, L. Gonnelli, R. Pierattelli, T. Herrmann, L. Emsley, G. Pintacuda, Proc. Natl. Acad. Sci. USA 2012,
109, 11095-11100.
[12] T. Le Marchand, M. de Rosa, N. Salvi, B. M. Sala, L. B. Andreas, E. Barbet-Massin, P. Sormanni, A. Barbiroli, R. Porcari, C. Sousa Mota, D. de Sanctis, M. Bolognesi, L. Emsley, V. Bellotti, M. Blackledge, C. Camilloni, G. Pintacuda, S. Ricagno, Nat. Commun. 2018, 9, 1658.
[13] E. Schmidt, P. Güntert, J. Am. Chem. Soc. 2012, 134, 12817-12829.
[14] Y. Shen, F. Delaglio, G. Cornilescu, A. Bax, J. Biomol. NMR 2009, 44,
213-223.
[15] T. Herrmann, P. Güntert, K. Wüthrich, J. Mol. Biol. 2002, 319, 209-227.
[16] P. Güntert, Prog. Nucl. Magn. Reson. Spectrosc. 2003, 43, 105-125.
GB1
β2m
D76NHN
N/Cα/C’
MQY K L I L NGK10T L KGE T T T E A20V D A A T A E K V F30KQY ANDNGV D40GEWT Y DD A T K50T F T V T E