HAL Id: hal-02326448
https://hal.archives-ouvertes.fr/hal-02326448
Submitted on 22 Oct 2019
HAL is a multi-disciplinary open access
archive for the deposit and dissemination of
sci-entific research documents, whether they are
pub-lished or not. The documents may come from
teaching and research institutions in France or
abroad, or from public or private research centers.
L’archive ouverte pluridisciplinaire HAL, est
destinée au dépôt et à la diffusion de documents
scientifiques de niveau recherche, publiés ou non,
émanant des établissements d’enseignement et de
recherche français ou étrangers, des laboratoires
publics ou privés.
Ecuador-Southwest Colombia Convergent Margin
J.-y. Collot, G. Ratzov, P. Silva, Jean-Noël Proust, S. Migeon, M.-j.
Hernandez, F. Michaud, A. Pazmino, D. Barba Castillo, A. Alvarado, et al.
To cite this version:
J.-y. Collot, G. Ratzov, P. Silva, Jean-Noël Proust, S. Migeon, et al.. The Esmeraldas Canyon: A
Helpful Marker of the Pliocene-Pleistocene Tectonic Deformation of the North Ecuador-Southwest
Colombia Convergent Margin. Tectonics, American Geophysical Union (AGU), 2019, 38 (8),
pp.3140-3166. �10.1029/2019TC005501�. �hal-02326448�
of the North Ecuador
‐Southwest Colombia
Convergent Margin
J.‐Y. Collot1 , G. Ratzov1, P. Silva2, J.‐N. Proust1,3 , S. Migeon1,4, M.‐J. Hernandez1,4,5, F. Michaud1,4, A. Pazmino6, D. Barba Castillo7, A. Alvarado2 , and S. Khumara1,8
1Université Côte d'Azur, IRD, CNRS, Observatoire de la Côte d'Azur, Valbonne, France,2Instituto Geofísico, Escuela Politécnica Nacional, Quito, Ecuador,3Université de Rennes, CNRS, UMR6118, Geosciences, Rennes, France,4Sorbonne Université, Paris, France,5Departamento de Geología, Escuela Politécnica Nacional, Quito, Ecuador,6Instituto Oceanográfico de la Armada del Ecuador, Guayaquil, Ecuador,7Petroamazonas EP, Quito, Ecuador,8Universidad Industrial de Santander, Escuela de Geología, Bucaramanga, Columbia
Abstract
Deciphering the migration pattern of the Esmeraldas submarine Canyon (EC) and its history of cut‐and‐fill allows constraining the Pliocene‐Pleistocene tectonic evolution of the Ecuador‐Colombia convergent margin. Swath bathymetry, multichannel seismic reflection, and chronological data show that the EC is a 143‐km‐long, shelf‐incising, river‐connected canyon that started incising slope apron deposits in the Manglares fore‐arc basin ~5.3 Ma ago. The EC inception appears contemporaneous with the subduction of the Carnegie Ridge that is believed to have initiated 5–6 Myr ago and is considered an indirect cause of the EC formation. During its two‐stage left‐lateral migration, the EC upper‐half scoured deep incisions providing evidences for uplift episodes in the Manglares Basin that are correlated with mid‐Pliocene and Pleistocene regional tectonic events. Glacioeustatic variations contributed significantly to shape the EC and its upslope tributaries by increasing the rate of canyon incision during rapid sea level falls. Faults, folds, and diapirs have structurally controlled the location of the EC and of its tributary canyons, including the Ancon Canyon, which served as the main spillway of the Manglares Basin prior to be cut from its source ~170 kyr ago by the growth of a fault‐related anticline. The margin wedge that hosts the EC is highly unstable as it is cut by active faults and shaken by large subduction earthquakes. Several mass transport deposits have dammed the EC, one of them between >~65 and ~37 kyr causing an impoverishment of detrital material in the trench sedimentation and a possible interruption of the paleoseismological record.1. Introduction
Submarine canyon systems are steep‐sided valleys that incise continental margins and serve as conduits for particle transport to the deep ocean (Menard, 1955; Normark & Carlson, 2003; Shepard, 1981). The main cause for the origin of submarine canyons is continental slope erosion by density currents and mass wasting events (Pratson et al., 1994; Shepard, 1981). Many studies have shown that the canyon morphology responds to external forcing such as sea level changes, sediment supply variations, and tec-tonic processes (Babonneau et al., 2004; Baztan et al., 2005; Huyghe et al., 2004; Laursen & Normark, 2002). Along convergent margins, tectonic and basement structures deflect the canyon thalweg (Greene et al., 1991; Huyghe et al., 2004; Kukowski et al., 2001; Mountjoy et al., 2009) (Harris & Whiteway, 2011). The relative convexity or concavity of canyon longitudinal profiles reflects the compet-ing influence of preexisting depositional relief, tectonic deformation, and erosion of the seafloor by sedi-mentary processes (Covault et al., 2011). Because submarine canyon systems are not purely erosive but are, as well, long‐term sedimentary constructions resulting from alternating periods of incision and fill (Amblas et al., 2012; Baztan et al., 2005; Deptuck et al., 2007), investigating preserved nested canyons imaged on seismic data, and analyzing the canyon modern seafloor morphology may help pinpoint the temporal response of canyon systems to seafloor deformation. Therefore, canyons can be used as helpful markers of tectonic deformation to decrypt the recent geomorphic and structural evolution of active margins (Mountjoy et al., 2009).
©2019. American Geophysical Union. All Rights Reserved.
Key Points:
• The Esmeraldas Canyon (EC) started incising the Manglares Basin ~5.3 Ma ago contemporarily with the Carnegie Ridge subduction initiation
• The EC migration and incisions reveal Plio‐Quaternary fore‐arc uplift episodes and the conspicuous influence of glacioeustatic variations • The Ancon Canyon, the main
spillway of the Manglares fore‐arc basin, was abandoned ~170 kyr ago favoring the basin infill
Correspondence to:
J.‐Y. Collot, jean‐yves.collot@ird.fr
Citation:
Collot, J.‐Y., Ratzov, G., Silva, P., Proust, J.‐N., Migeon, S., Hernandez, M.‐J., et al (2019). The Esmeraldas Canyon: A helpful marker of the Pliocene‐Pleistocene tectonic deformation of the North
Ecuador‐southwest Colombia conver-gent margin. Tectonics, 38, 3140–3166. https://doi.org/10.1029/2019TC005501 Received 24 JAN 2019
Accepted 22 JUL 2019
Accepted article online 31 JUL 2019 Published online 24 AUG 2019 Corrected 4 SEPT 2019
This article was corrected on 4 SEPT 2019. See the end of the full text for details.
In northwestern South America, the Esmeraldas Canyon (EC; Collot et al., 2005) and the Patia and Mira Canyons (Ratzov et al., 2012) cut across the North Ecuador‐southwest Colombia convergent margin, imme-diately north of the Carnegie Ridge collision zone (Figure 1; Gutscher et al., 1999). The canyons traverse the Manglares fore‐arc basin (Marcaillou & Collot, 2008), breach the subduction front and deliver sediment to the Ecuador‐Colombia trench turbidite system (Migeon et al., 2017; Ratzov et al., 2012). In contrast with the Patia and Mira Canyons (Figure 1) that are presently river disconnected (Ratzov et al., 2012), the EC is one of the few shelf‐incising canyons in the world that remain river‐connected during sea level high stands (Harris & Whiteway, 2011). In this study, we use multibeam bathymetric data, seismic reflection profiles, and a few dredgings and cores collected along the EC and its tributary canyons to (1) explore their morphol-ogy and sedimentary architecture and identify loci of active deformation and mass wasting, (2) investigate the temporal evolution of the canyons cut‐and‐fill structure to constrain the timing of the Late‐Neogene defor-mation of the Manglares Basin and North Ecuadorian coastal region, and (3) analyze the temporal relation-ship between the Carnegie Ridge subduction and the EC development.
2. Geological and Structural setting of the EC
The EC features a major transverse boundary between two structural domains of the Ecuador Colombia margin, where the Nazca Plate underthrusts obliquely (N83°E) the South America forearc at 4.74 cm/year (Nocquet et al., 2014). Southwest of the canyon, the offshore margin wedge comprises a 20‐ to 40‐km‐wide shelf that includes the Esmeraldas Platform (Figure 1) and overhangs a 20‐ to 30‐km‐wide, steep outer wedge slope dominated by subduction erosion and mass wasting (Marcaillou et al., 2016; Ratzov et al., 2010; Sage et al., 2006). Northeast of the canyon, the margin wedge reaches 120 km in width and includes a narrow, 10‐ to 20‐km‐wide shelf and the 80‐ to 100‐km‐wide, deep‐water Manglares fore‐arc basin (Marcaillou & Collot, 2008). The basin seafloor is deformed by the Ostiones Swell and the NE trending Ancon fault system border-ing the Manglares High (Collot et al., 2008; Figure 1). Near the EC mouth, the margin front consists of a nar-row accretionary wedge that widens to ~35 km, north of the Patia Canyon (Marcaillou et al., 2008; Mountney & Westbrook, 1997).
In northern Ecuador, the coastal range, which reaches an altitude of ~300 m (Reyes, 2013), is cut by the NNW trending Esmeraldas River (Figure 1). In this region, the basement of the margin consists of Cretaceous ocea-nic terranes (Gossens & Rose, 1973; Juteau et al., 1977; Reynaud et al., 1999) overlain by a Late Cretaceous‐ Paleocene volcano‐sedimentary sequence and the thick Cenozoic Borbon sedimentary basin (Cantalamessa et al., 2007; Deniaud, 2000; Di Celma et al., 2010; Evans & Wittaker, 1982; Jaillard et al., 1995). Gentle NE trending antiforms and east trending faults, including the Canande Fault that separates the Borbon and Manabi Basins (Figure 1), deform the coastal range (Reyes & Michaud, 2012). Beneath the Manglares Basin, the mafic basement, which has been identified from its 4.0‐ to 5.0‐km/s velocity structure (Agudelo et al., 2009), forms structural highs buried beneath the Ostionies Swell and the Manglares High (Figure 1). Basin deposits that overlay the mafic basement reach 2.5–3 km in thickness (Collot et al., 2008) and include five major seismic units (A to E) separated by prominent unconformities U1–U4 tentatively dated by correla-tion with regionally compiled chronostratigraphic charts of the onshore Borbon and Manabi Basins (Marcaillou & Collot, 2008). In a seismic stratigraphy study, Lopez Ramos (2009) identified eight seismic units deposited duringfive major eustatic cycles (C1–C5). Five regional unconformities among the eight identified were dated on the basis of the correlation between a seismic stratigraphy onlap chart of the Manglares Basin and a similar chart of the adjacent Tumaco‐Borbon Basin constrained by well log and bios-tratigraphical data. Because the sedimentary environments and ages of Seismic Units A to D can benchmark the temporal evolution of the canyon, their seismic facies, equivalent onshore formations, lithology, and ten-tative ages are summarized in Figure 2.
The strong tectonic activity of the EC region is supported by (1) the background seismicity (Manchuel et al., 2011), (2) the 1906, 1942, 1958, 1979, and 2016, Mw 7.8 to 8.8 megathrust earthquakes (Kanamori & McNally, 1982; Mendoza & Dewey, 1984; Nocquet et al., 2016), (3) the strong seafloor deformation along the Ancon fault system (Collot et al., 2008; Ratzov et al., 2011), (4) the shelf uplift during the Pleistocene (Michaud et al., 2015), and (5) the uplifted Pleistocene marine terraces along the Ecuador northern coast (Pedoja et al., 2006).
3. Data and Methods
3.1. Multibeam Bathymetric Data
The bathymetric map of the EC (Figure 3) was constructed from swath bathymetry data collected during the 2005 Amadeus and Esmeraldas cruises (RV L'Atalante), using a SIMRAD EM12D multibeam system (13 kHz, 162 beams) (Collot et al., 2005). This data set was completed by higher‐resolution multibeam swath
Figure 1. Geological context of the Esmeraldas Canyon; (a) Inset: the red frame is the location of the study area north of the Carnegie Ridge subduction; NAS =
North Andean Sliver. (b) Simplified geological and structural setting of the Esmeraldas Canyon modified from Collot et al. (2009). Thick black arrow is relative convergence between Nazca Plate and NAS (Nocquet et al., 2014). Onshore blue dashed line shows estimated limit of the Borbon basin.
data collected on the upper canyon segment using SIMRAD EM122 (12 kHz, 288 beams) and EM710 (100 kHz, 256 beams) echosounders during the 2012 Atacames cruise (RV L'Atalante), and an EM302 multibeam system operated by INOCAR (RV Orion) in 2013. The RV L'Atalante bathymetric data were processed using the CARAIBES software (IFREMER). The full data set allowed constructing a uniform digital elevation model with a 150‐m grid spacing, using the nearest neighbor algorithm of the GMT software (Wessel & Smith, 1998).
3.2. Seismic Reflection
Multichannel seismic reflection (MCS) data were acquired during the 2005 Amadeus and 2009 Scan cruises. Scan MCS data were recorded using a 4000‐ci (65.5 L), 20‐ to 80‐Hz frequency air gun seismic source, and a 640‐channel, 8‐km‐long streamer. Shots were fired every 25 m, providing a 160‐fold cover-age. Scan MCS data were processed by SINOPEC (China Petroleum and Chemical Corporation) for PetroEcuador through classical steps (Yilmaz, 2001) including multiple elimination, spherical divergence compensation, predictive deconvolution in the Tau‐P domain, prestack noise attenuation, stacking, and prestack time migration. Amadeus MCS data were collected using a 150‐ci air guns source set up in Generator Injector mode, combined with a 300‐m‐long, six‐channel streamer. Shots were fired at 18.5 km/h (10 knots) every 25 m providing a threefold coverage. Amadeus seismic lines were processed
Figure 2. Onshore‐offshore chronostratigraphic correlations; (a) composite chronostratigraphic chart of the Borbón and Manabi Basins modified from 1 = Deniaud
(2000), 2 = Ordonez et al. (2006), 3 = Evans and Wittaker (1982), 4 = Lopez Ramos (2009), and 5 = Reyes (2013); (b) correlation between the Borbon and the Manglares Basins after 6 = Marcaillou and Collot (2008): Seismic Units A to E and U1 to U5 unconformities; 4 = Lopez Ramos (2009): Seismic Units U1 to U8 and B1 to B8 unconformities, and C1 to C5 are eustatic cycles; 7 = this work: double arrows with red labels represent the age ranges of rock samples dredged at Sites D11 to D14 along the Esmeraldas Canyon (Table 1); 8 = this work: seismic facies of Units A0 to E with unconformities U0 to U5; Yellow circled numbers = proposed correlation between Esmeraldas Canyon incision Phases 1 to 4 and onshore unconformities; simple vertical arrow denotes the most recent uplift of the coastal range (Pedoja et al., 2006; Reyes, 2013).
with Seismic Unix (Center of Wave Phenomena, Colorado School of Mines) for band‐pass filtering, spherical divergence correction (water velocity)—NMO velocity analysis and correction, threefold stack and constant water velocity time migration. The seismic data are used to identify Regional Seismic Units A to E and characterize the variability of the sedimentary and structural environment of the EC. Lower, middle, and upper canyon fill series were interpreted along individual seismic lines with no a priori genetic relationship between each series along the canyons.
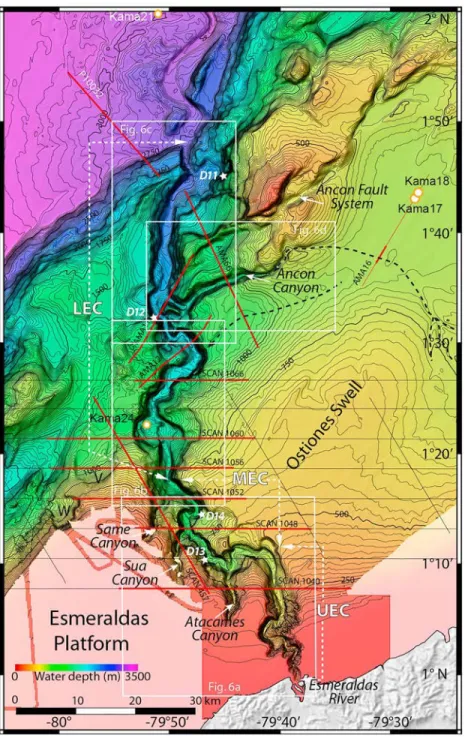
Figure 3. Multibeam bathymetric map of the Esmeraldas Canyon and its tributary canyons; contour interval is 25 m. Solid red lines are multichannel seismic re
flec-tion lines shown in this study. White dots with“Kama” show the location of sediment cores. White stars are dredging Sites D11–D14. Black dashed lines show paleosedimentary transport systems from the Manglares Basin. White frames are the location of Figures 6a to 6d. UEC = Upper Esmeraldas Canyon; MEC = Middle Esmeraldas Canyon; LEC = Lower Esmeraldas Canyon; V and W are slump scars.
3.3. Dredges and Cores Data
Rocks were dredged at four sites (Figure 3) along short depth intervals of the canyon walls. Dredging sites were relocalized using the bathymetry data, dredge‐cable length, and ship location. However, the global characters of the dredging technique make it difficult to pinpoint the provenance of the samples on the seabed. The samples were dated using microfauna (Table 1). Four 3.75 to 8.28‐m‐long sediment piston cores recovered (Figure 3) using a Kullenberg‐type corer were analyzed and dated to calculate Pleistocene sedi-mentation rates (Gastaud, 2010; Migeon et al., 2017).
4. Results
4.1. General EC Morphology
The EC extends over a length of ~143 km along its course from the mouth of the Esmeraldas River, down to the Colombia trench, where the canyon sharply cuts the subduction front at a depth of ~2,750 m (Figure 3; Silva Chamorro, 2007). The EC valley is 2.5–12 km wide, locally more than 1,000 m deep with respect to the surrounding seafloor. Its thalweg exhibits an overall sinuosity of 1.53 and thus presents a meandering pat-tern (Leopold & Wolman, 1957). It is 0.25–1.4 km wide (Figure 4) and flanked by 20–30° steep walls reaching in places more than 40° (Figure 5). From its head region, the canyon incises the narrow shelf and follows the junction between the Esmeraldas Platform and the Ostiones Swell, prior to winding through the lower mar-gin wedge. The overall NS trending course of the canyon is diverted twice allowing defining three distinct canyon segments (Figure 3): (a) the 42‐km‐long, Upper Esmeraldas Canyon (UEC) trends NS; (b) the 33‐ km‐long, Middle‐slope Esmeraldas Canyon (MEC) trends predominantly W to NW; and (c) the 68‐km‐long, Lower‐slope Esmeraldas Canyon (LEC), which course returns roughly to its NS initial direction. Four tribu-tary canyons join the main canyon. Upslope, the NS trending Atacames, Sua, and Same Canyons incise the edge of the Esmeraldas Platform and the upper margin slope (Michaud et al., 2015). Further down slope, the ENE trending Ancon Canyon (AC) originating from the Manglares Basin incises the lower margin wedge. 4.2. The UEC
4.2.1. Morphology
The short UEC trends perpendicular to the upper margin slope. It is connected with the mouth of the Esmeraldas River in a water depth of 20 m (Figure 6a), while downstream, the UEC breaches transversally the shelf along deeply incised meanders forming a winding shelf valley with up to 30–40° steep walls (Figure 5), prior to incising the margin upper slope to ~800 m of water depth. Bathymetric Cross Sections 1 and 2 of UEC (Figure 4) generated from the multibeam bathymetric data grid reveal V‐shaped, asymmetric sections that incise the shelf by up to 500 m. Downstream, Cross Section 3 reveals a U‐shaped thalweg across the upper margin slope, and narrow, slant terrace tA (Figure 6a).
4.2.2. Seismic Structure
Seismic Units A to E and bounding unconformities initially interpreted by Marcaillou and Collot (2008) are identified on Line SCAN‐1040 (Figure 7) together with new Seismic Unit A0 and its basal unconformity U0. The line shows that the UEC together with the Atacames and Sua Canyons settled across the structural tran-sition from the thickly sediment‐filled Manglares Basin to the thinner sedimentary cover of the Esmeraldas Platform. The transition is marked by the basement top (U5) that shallows from a ~3.0‐s TWTT (two‐way tra-vel time) depth east of the UEC to less than 1.5‐s TWTT deep, west of the Sua Canyon. Two structural features accommodate the lateral transition: (1) a basement fault network that deformed Unit E and gently folded Units D and C beneath the Atacames Canyon and UEC, where angular unconformity U2 truncates Unit C reflectors, and (2) diapiric intrusions interpreted on the basis of the subvertical, nonreflective core of Unit C anticline structures between the UEC and Sua Canyon. The UEC incised Units A and B, likely reaching the top of Unit C. Unit C exhibits relatively uniform and well‐bedded seismic facies, while Unit B consists of stacks of wedge‐ and lens‐shaped stratified bodies returning low angle, either weak or strong, and by places chaotic reflections when channelized. This remarkable contrast reveals a major change in the sedimentary environment after the formation of unconformity U2. Slant terrace tA (Figure 7) exhibits a reflectivity sequence similar to that of the adjacent Unit A and top of Unit B, from which the sequence is offset downward by ~ 0.25‐s TWTT, and it is thus thought to be an elongated slump block. Similar failures affect the opposite flank of the canyon (Figure 7). Further south on the shelf, a curved linear depression following the canyon eastern rim (LD in Figure 6a) mimics the shape of the meanders, suggesting an area prone to block slumping.
4.3. The Middle Esmeraldas Canyon (MEC)
4.3.1. Morphology of the MEC and Its Tributary Canyons
The MEC trends nearly parallel to the regional bathymetric contours and shows a sinuous course. Two linear MEC stretches trend NW for ~8 km (Figures 6a and 6b). Cross Sections 4–6 (Figure 4) show that the MEC is U‐shaped and asymmetric, showing a steep (30–40°) southern flank (Figure 5), and a northern flank indented by terraces tB, tC, and tD that are ensconced within arcuate, south to west facing gentle scarps (Figure 6a). Mound M is a higher isolatedflat‐topped relief between terraces tC and tD that features an out-lier preserved from the canyon erosion. On bathymetric Cross Section 7 (Figure 4) the canyon is deep and V shaped, suggesting that near the northern end of the MEC (Figure 6b), the canyon actively incises the upper margin slope. The Atacames, Sua, and Same tributary canyons are V shaped (Figure 5) andflanked by slant terraces. Their mouths are truncated and are slightly overhanging the MEC thalweg, indicating that the tri-butary canyons may be presently less active than the MEC.
4.3.2. Seismic Structure of the MEC and Its Tributary Canyons
The structural and sedimentary environments of the MEC and its tributary canyons, as well as elements of their paleocourse, are interpreted from Lines SCAN‐1040, 1048, 1052, and 457. Along Line SCAN‐1048 (Figure 8), unconformity U1, which truncates Unit B reflectors, down cuts more severely Unit B across two depressions interpreted as paleoincisions: Incision 2 beneath terrace tD (Common Depth Point [CDP] 8700‐9200, Figure 8), and Incision 1 partially beneath terraces tC (CDP 9300‐9800, Figure 8). The latter is bounded eastward at CDP 9800 by a buried scarp interpreted as the easternmost bound of the paleo‐MEC. A buried levee complex inferred on the eastern rim of Incision 1 (Vc in Figure 8), supports the idea that the paleo canyon/channel was active during Unit A early sedimentation stage.
Unit A shows a chaotic lower sedimentary series (La) within Incision 1, suggesting that mass transport deposits (MTDs) laid down in the paleocanyon. Above the MTD, thinly stratified middle series Ma pinches out away from the paleocanyon axis, and upper series Ua is more draping. Both Ma and Ua series might represent confined inner levees (e.g., Babonneau et al., 2004). Similarly, beneath terrace tD, Unit A consists of wedge‐shaped, low‐amplitude, and thinly layered reflectors supporting canyon inner levees confined into Incision 2. Therefore, the arcuate seafloor morphology of terraces tC and tD (Figure 6a) combined with the
Table 1
Lithology and Age of Samples Dredged From the Esmeraldas Canyon During the Amadeus Cruise
Dredge
N° Sample
Water depth
(m) Description Age
DAMA11 D11‐E1 1,500–2,250 Dark gray siltstone with levels offine sands, bioturbations with pellets
Early to Middle Pleistocene,*B and*P D11‐E3 Gray siltstone with bioturbations Lower Early Pleistocene,*B and*P D11‐E6 Yellowish siltstone with bioturbations Early Pleistocene,*B and*P
D11‐E11 Siltstone Early Pleistocene,*B and*P
DAMA12 1,850–2,170
D12‐E4 Siltstone Lower Early Pleistocene,*B and*P
D12‐E6 Siltstone Pliocene to Upper Early Pleistocene,*P
D12‐E8 Siltstone Upper Early to Middle Pleistocene*B,*P, and
* R
D12‐E9 Siltstone Late Pliocene to Middle Pleistocene,*B,*P,
and*R D12‐E14, E16,
E18
Siltstone Pliocene to Middle Pleistocene,*P
DAMA13 D13‐E1 850–1,050 Gray siltstone with lenses of sandstone and bioturbation Late Miocene to Late Early Pliocene,*B and *
P
D13‐E2 Siltstone with lenses of laminated sandstone Upper Early Pliocene,*B and*P D13‐E4 Poorly compacted Silt with fractures Pliocene,*B and*P
D13‐E6 Mudstone Upper Early Pliocene,*B and*P
DAMA14 D14‐E1 900–1,250 Olive gray siltstone with bioturbation Upper Early to Middle Pleistocene D14‐E3 Siltstone with pellet facies Early to Middle Pleistocene,*B,*P, and*R D14‐E4 Poorly compacted mudstone Pliocene to Early Pleistocene*B and*P
Note. Ages were estimated from determination of *B = benthic foraminifera; *P = pelagic foraminifera; *R = radiolarian, *D = diatom; location of dredging sites in Figure 3.
stratigraphic series thatfill their underlying paleoincisions (Figure 8), suggest that canyon paleomeanders underlay the terraces.
At the junction between the MEC and the Same Canyon, Line SCAN‐1052 (Figure 9) reveals primary ele-ments of the canyon setting up and evolution. A tight fold intruded by a diapiric structure deforms Unit D beneath the canyon easternflank. The canyon, which truncated the fold western flank during Incision 2 (Figure 9), wasfilled by (1) chaotic lower series Lb interpreted as including a MTD unconformably overlain (Incision 3) by (2) down lapping, low‐angle highly reflective series Mb, which is unconformably covered (Incision 3′) by (3) poorly reflective, down lapping series Ub. The latter is presently dissected (Incision 4)
Figure 4. Esmeraldas and Ancon Canyons bathymetric sections; (a) Esmeraldas Canyon depth Cross Sections 1 to 16. (b) Ancon Canyon depth Cross Sections 17 to
20. VE = vertical exaggeration; (c) Longitudinal depth profiles of the Esmeraldas and Ancon Canyons; UEC, MEC, and LEC as in Figure 3; Esmeraldas Canyon: MTD = mass transport deposit; note the variable depth of Incision 2 and sediment infill indicating potential uplift variations along the canyon valley (vertical black arrows); Ancon Canyon: blue star is the westward projection of the ~1,000‐m depth of the buried canyon bottom on Line AMA16 (Figure 5); (d) Location map of depth cross sections and longitudinal profiles; Kp = knick points.
by the Same and Esmeraldas Canyons. The seismic configuration of series Mb an Ub indicates downslope deposition, which reflects either localized progradational wedges or imbricate confined levees.
Line SCAN‐457 (Figure 10) reveals critical elements to understanding the origin of the Same and Sua tribu-tary canyons. Between CDP 1050‐1350, a sediment‐filled, flat‐bottomed, 0.5‐s TWTT‐deep paleoincision is interpreted beneath the Same Canyon. Interestingly, this erosional feature is not observed 4 km upslope beneath the Same Canyon on Line SCAN‐1048. On Line SCAN‐457, the incision sediment fill associated with the Same Canyon consists of seismic series similar in both vertical succession and seismic facies with Lb, Mb, and Ub series described downslope across the MEC on Line SCAN‐1052. These close similarities allow infer-ring that a gravity‐driven event that sourced immediately downslope of Line SCAN1048 excavated the slope down to the Same Canyon junction with the MEC (Figure 6a), and plugged the MEC with MTD Lb. On Line SCAN‐1040, near the edge of the Esmeraldas Platform, the Sua Canyon incises Unit A along the axis of a syncline (Figure 7) that is also detected further downslope along Line SCAN‐457 (Figure 10). On this
line, beneath the Sua Canyon, Unit B deepest reflectors lap onto U2 unconformity on both flanks of the syncline, so that the unitfills locally a structural paleovalley. Similarly on Line SCAN‐1040 (Figure 7), the Atacames Canyon incises Units A and B along a syncline axis.
4.3.3. Dredging Along the MEC Flanks
Dredging at site D13 along the steep MEC westernflank (Figure 6a) collected siltstone with lenses of lami-nated sandstone as well as poorly compacted mudstone. The siltstone was dredged from an outcrop of Unit B as indicated by seismic interpretation, and the dredged samples possibly include bits from overlying Unit A.
Figure 6. Detailed bathymetric maps of the Esmeraldas and the Ancon Canyon. Contour interval is 20 m. Location of Boxes A, B, C, and D in Figure 3; UEC, MEC,
LEC as in Figure 3; Kama 24 = sediment core. tA–tO are terraces; LD in Figure 6a is linear depression; Q in Figure 6c is flat floor piggy‐back basin, and S1 and S2 are mass transport deposits; white arrows in Figure 6d show particleflow direction.
Some D13 samples are dated Late Miocene to late early Pliocene, and others late Pliocene‐early Pleistocene (Table 1).
Dredge D14 along the steep northwesternflank of terrace tD (Figure 6a) recovered bioturbated siltstone, poorly compacted mudstone and black siltstone rich in organic matter. These rocks were dredged from an outcrop of Unit A, interpreted as confined levees on Line SCAN‐1048 (Figure 8), and dated Pliocene to Middle Pleistocene (Table 1).
4.4. The LEC
4.4.1. Morphology of the LEC
Along its path to the trench, the LEC incises the lower margin slope, obliquely to the NE trending regional bathymetric contours. The canyon shows a few bends and meanders, overhanging terraces and short linear stretches trending dominantly NS, NW, and NE (Figure 3). The longitudinal depth profiles of the western and eastern rim of the EC exhibit clear differences (Figure 4c). While the depth profile of the western rim is shallower than that of the eastern rim on the upper margin slope, they reach a similar depth near latitude 1°28′N. From this point downslope, the depth difference of the profiles is reversed with a shallower eastern
Figure 7. Seismic Reflection Line SCAN‐1040 shows the structural transition between the Manglares Basin and the Esmeraldas Platform across the Esmeraldas,
Atacames and Sua Canyons; location in Figures 3 and 6a; 457 is Cross Line SCAN‐457; capital letters A to E are regional Seismic units, and U0–U5 are uncon-formities; CDP are Common Depth Points; VE is vertical exaggeration in the water column; deep faults in red deform the thick sedimentary basin beneath the canyons, and diapiric structures intrude Unit C forming anti/synclines beneath the shelf; note the drastic change in seismic facies between Unit C basinfloor deposits and Unit B slope apron in the Manglares Basin.
rim that also exhibits a more complex morphological pattern. These differences point to various tectonic and sedimentary influences as discussed further below.
At latitude 1°22′N, the LEC valley enlarges up to ~11 km and hosts several nested terraces (Cross Section 8, Figures 4 and 6b). At latitude 1°30′N, it tightens and draws a large meander along which the LEC eroded the Manglares Basin by up to 730 m (Cross Section 10, Figure 4), carving a steep outerflank (Figure 5). In map view, the large meander does not exhibit a smooth bend but it does consist of a series of short linear stretches at 90° angles, trending NE or NW (Figure 6b), thus suggesting a structural control. The terraces show a variety of shape, morphology and altitude relative to the canyon thalweg pointing to diverse origins and evo-lution. Few have a subhorizontal seafloor (e.g., tL and tO), whereas nearly all (e.g., tG and tK) are slant (Figure 6). Terrace tH that stands near the canyon bottom, dips north, and shows a rough morphology (Figure 6b). Cross Sections 9 and 10 (Figure 4) reveal slant terrace tK perched on the canyon easternflank and horizontal terrace tL that is bypassed by the large canyon meander. Horizontal, terrace tM (Figures 6b and 6c) is ensconced to the SW in a 100‐ to 200‐m‐high semicircular scarp, whereas to the NW, it overhangs the lower margin by ~300 m, suggesting that its northwesternflank was tectonically deformed by the Ancon fault system. From the confluence with the AC northward, the LEC trends roughly NS (Figure 6c) crossing a structurally complex lower margin wedge. The LEC is characterized by an entrenchment achieving ~1,200 m in height along its easternflank (Cross Section 13, Figure 4), with 20–30° slopes (Figure 5). Bathymetric Cross Sections 12 to 15 (Figure 4a) reveal a U‐shaped, ~2‐km‐wide thalweg that contrasts with the V‐shaped and ~0.5‐km‐ wide thalweg in Cross Sections 11 and 16 thus potentially reflecting effects of local tectonics. At the AC con-fluence, the LEC shows sharp changes of course between 2‐ and 4‐km long, linear stretches trending
Figure 8. Seismic Reflection Line SCAN‐1048 shows evidence for Canyon Incision 1 beneath terrace tC, and Incision 2 beneath terrace tD; axial Incision 4; Incision
3 has not been observed; location in Figures 3 and 6a; seismic units, unconformities, VE and CDP as in Figure 7; D14 is projection of rock dredging (Table 1); 457 and 465 are Cross Lines SCAN; continuity between the base of Incision 1 and U1 suggests synchronicity. La, Ma, and Ua are lower, middle, and upper series of Unit A; Vc is buried levee complex; thin dotted lines limit fuzzy zones that suggest diapirs west of the Esmeraldas Canyon and possibly seismic artifacts or gas east of it; note that the reflective section of Unit B forms a monocline across the canyons indicating uplift of the Esmeraldas Platform.
successively NW, north, and NE suggesting a local structural control. Subhorizontal terraces tN and tO (Figure 6c) likely differ in origin as terrace tN formed in a structurally depressed seafloor area bounded by NE trending scarps, whereas narrow, N‐S elongated terrace tO emplaced within the canyon valley, only ~100 m above the canyon floor. Further north (Figure 6c), smooth, 10‐km‐wide, slant amphitheater‐ shaped terrace tP overhangs a morphologically chaotic body (S1) that rims the canyon easternflank. Ratzov et al. (2007) interpreted these features as the results of a massive gravity‐driven event. North of latitude 1°43′N, the LEC valley widens considerably to ~8 km before reaching its mouth (Cross Section 16, Figure 4a). At latitude 1°45.5′N, the LEC thalweg abruptly changes course counterclockwise by ~80° and drastically reduces its width to ~0.5 km along the ~5‐km‐long stretch that breaches the subduction front (Figure 6c). Cross Section 16 (Figure 4) and Figure 6c show that this stretch separatesflat seafloor Q to the west from the contrasting eastern chaotic morphology of Feature S2. Feature S2 is bounded eastward by a ~1,200‐m‐high scarp (Cross Section 16, Figure 4) that includes a 500‐m‐high cliff with a ~40° slope (Figure 5).
4.4.2. Seismic Structure of the LEC
The seismic structure of the LEC terraces provides key information about the canyon relative temporal evo-lution. On Line SCAN‐1056 (Figure 11), terrace tG tops a structural block that consists of poorly reflective lower series c that resembles to adjacent Unit C, strongly reflective series b that is similar in dip and facies to the base of Unit B, and series a that returns low‐amplitude reflectors similar to those of Unit A. The ~140‐m vertical offset between the block and truncated adjacent Units A, B, and C, as well as the coherency of the block internal architecture suggest that terrace tG tops a slump block. A short subhorizontal reflector underlies by 0.1‐s TWTT both the canyon flat‐floored thalweg and the toe of terrace tG pointing to a 2.5‐km‐ wide,flat‐floored paleothalweg (Incision 2 in Figure 11) overlain by deposits left by channelized gravity flow predating the setting up of the slump block (Phase 2′ in inset, Figure 11).
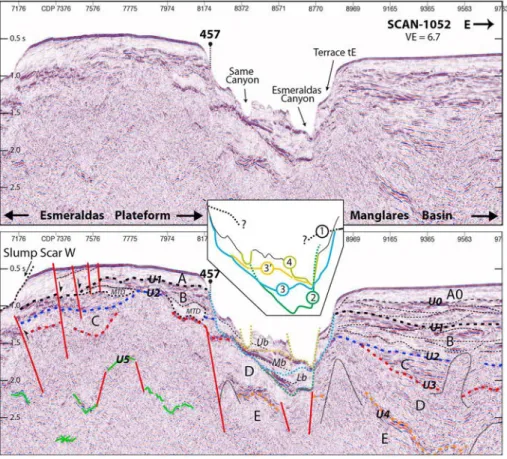
Figure 9. Seismic Reflection Line SCAN‐1052 shows evidence for cut‐and‐fill phases at the junction between the Esmeraldas and Same Canyons; location in
Figures 3 and 6b; 457 is Cross Line SCAN‐457; seismic units, unconformities, CDP and VE as in Figure 7; thin dotted lines limit fuzzy zones that include a diapi-ric structure beneath the canyon easternflank; solid red lines are faults; Note active faults on the western part of the line; Lb, Mb, and Ub are lower, middle, and upperfill series in the canyon; MTD = mass transport deposit, Inset: incision Phases 1, 2, 3, and 4; 3′ denotes local unconformity truncating Mb reflectors.
Line SCAN‐1060 (Figure 12) images the result of multiple incision and infilling phases of the LEC recorded beneath terraces tH, tI, and tF. On this line, the LEC cuts Units A to D down to Unit E, where the base of the canyonfill is a 5‐km‐wide, U‐shaped, and slightly westward dipping erosion surface. Beneath terraces tH and tF, the canyonfill counts four seismic series: thinly stratified and reflective series Lc; subtransparent series
Mc1; chaotic to poorly stratified unit Mc2 topped by a high‐amplitude, undulating reflector overlain by poorly reflective; and chaotic series Uc that is incised by the LEC. Beneath terrace tI, well‐stratified subhorizontal ser-ies Ls* overlain by poorly reflective wedge Us* onlap unconformity U1 and resembles to adjacent Units A and A0. In contrast, the seismic facies of the series underlying terraces tH and tF differ from that of Units C to E, against which they are in sharp erosive contact. Therefore, the canyon stratigraphic sequence and unconformi-ties suggest that four main phases prevailed in the construction of that part of the LEC. During incision Phase 1 (inset, Figure 12), the canyon carved into Units B and C beneath terrace tI, drawing a meander in map view (Figure 6b), prior to befilled with series Ls* and Us*, likely during deposition of Units A and A0. During Phase 2, the canyon shifted westward, cut series Ls* and Units C to E, thus deepening and enlarging its valley (Incision 2). Then, series Lc, Mc1, and Mc2 were deposited in the paleocanyon. Series Lc may be composed of turbidites thatfilled the canyon floor, whereas series Mc1 would reflect more homogeneous muddy sediment, and series Mc2 likely consists of massflows with an irregular and strongly reflective topography similar to that described by Piper et al. (1999) and Joanne et al. (2013). Subsequently, series Uc that is interpreted as a MTD emplaced across the canyon during Incision Phase 3, likely blocked the passage of gravityflows along the can-yon, prior to be incised during Phase 4 (inset in Figure 12). We interpret the steep, semicircular scarp that over-hangs terrace tH (Figure 6b) as the source area from which Uc material failed into the canyon.
Line SCAN‐1066 (Figure 13) shows unconformity U1 to truncate strata of Units B and C upslope of terrace tK, thus generating a paleovalley that isfilled with a well bedded and reflective series similar to Ls* on Line SCAN‐ 1060. These observations provide an additional evidence for the early Phase 1 of the LEC to be coeval with
Figure 10. Seismic Reflection Line SCAN‐457 shows the stratigraphic context of the Same and Sua Canyons, and the evolution of seismic units northward across
the margin upper slope; location in Figure 3; Bold numbers (1060) are Cross Lines SCAN; seismic units, unconformities, CDP and VE as in Figure 7; Lb, Mb, and Ub are lower, middle, and upperfill series in the Same Canyon; incision phases as in Figure 9; thin dotted lines limit diapiric structures (CDP 250 and 2750) and uninterpreted fuzzy zones (CDP 1800‐2050).
unconformity U1. A second phase of canyon incision sharply truncated Ls* strata and underlying margin units, carving a wide, highly reflective and flat‐floored paleocanyon similar to the image of Incision 2 on Line SCAN‐ 1060 (Figure 12). The homogeneous weakly reflective infill of Canyon Incision 2 beneath terrace tK denotes, however, a simpler canyonfill history rather than its multistage infill on Line SCAN‐1060. The infill of Incision 2 was then sharply truncated, when the canyon shifted westward and deeply incised the margin. On Line AMA12 (Figure 14a),flat terrace tL emplaced in a paleoincision that cuts unconformity U1. The incision depth and geometry, as well as its infill character mirror those of Incision 2 underlying terrace tK (Figure 13) suggesting that both paleoincisions are coeval, and that terraces tL and tK, which stand astride the LEC thalweg,filled former LEC meanders. Line AMA11 (Figure 14b) across terrace tM reveals an alter-nation between chaotic and thinly stratified, reflective series Ud on lapping strongly reflective series Ld thin-ning away from the LEC and echoing coarse‐grained channelized sediments. Dredging at site D12 (Figures 6c and 14b) recovered compacted mud and siltstone derived from series Ld and possibly Ud. Siltstone sam-ples are dated Pliocene to Middle Pleistocene (Table 1) suggesting that terrace tM recorded the canyon evo-lution since its initiation (Figure 2), as discussed further below.
4.5. The AC
4.5.1. Morphology of the AC
The AC strikes NE, parallel to the Ancon fault system (Figure 3). It is ~35‐km‐long from the 875‐m water depth of the Manglares Basin, down to its confluence with the EC at a water depth of 2,200 m (Figure 6d). Along its course, the AC shows a remarkable and unusual 100‐m‐high saddle (Gastaud, 2010) that
Figure 11. Seismic Reflection Line SCAN‐1056 shows evidence for a slump block beneath terrace tG in the Esmeraldas Canyon; location in Figures 3 and 6b; 417
and 457 are Cross Lines SCAN; seismic units, unconformities, CDP and VE as in Figure 7; solid red lines are faults; note evidence for aflower structure on the western part of the line; Slump scar V is indicated in Figure 3; thin dotted lines as in Figure 9; inset: incision Phases 1, 2, and 4, and local slump Phase 2′.
divides the canyon in two segments with oppositeflow directions. (1) The short eastward dipping stretch incises loosely the basin slope, thus heading toward the Manglares Basin (Figures 4c and 6d), where the can-yon has no seafloor expression, although its buried incision is imaged on seismic sections up to a triple col-lector east of the Ostiones Swell (Figure 3). (2) The prominent westward dipping segment consists of short 2‐ to 4‐km‐long, linear stretches with V‐shaped cross sections and flanked by small terraces (Figure 4b). Where joining the EC, the AC divides in two short reaches that incise the margin topography by up to 700 m. While the AC southern reach is shallower than the northern one and seems abandoned, the northern reach bends westward and connects smoothly with the EC. These observations indicate that the east and west dipping AC stretches were once part of a single west dipping canyon carrying spillover particles coming from the Manglares Basin.
4.5.2. Seismic Structure of the AC
Line AMA66 (Figure 14d) cuts across the AC and shows that margin layers are deformed into a large anti-cline, the apex of which is incised by the AC. In map view, the AC cuts sharply the anticline axis indicating that the canyon did establish prior to the anticline growth. The lack of evidence of lateral migration of the AC valley supports a rapid topographic inversion. Presumably, strong canyon erosion overcame the anticline growth, thus keeping pace with uplift. Further upslope in the Manglares Basin, Line AMA 16 (Figures 3 and 15) shows evidence for the upper valley of the AC to be buried beneath 0.17‐s TWTT of sediment, provid-ing indication for the canyon to be cut from its main source of sediment supply.
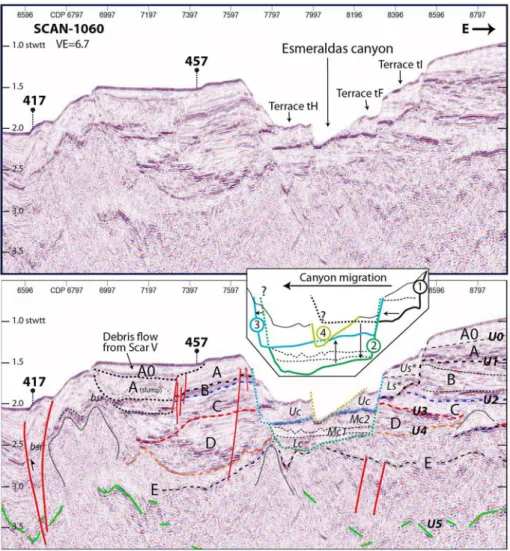
Figure 12. Seismic reflection Line SCAN‐1060 shows evidence for cut‐and‐fill phases and lateral migration of the Esmeraldas Canyon across terraces tH to tI;
loca-tion in Figures 3 and 6b; seismic units, unconformities, CDP and VE as in Figure 7; Lc, Mc1, Mc2, Uc are lower, middle, and upperfill series beneath terraces tH and tF; Ls* and Us* are lower and upperfill series beneath terrace tI; Solid red lines are faults; note the active fault with a reverse component on the western part of the line; thin dotted lines limit diapiric structures; inset: incisions Phases 1, 2, 3, and 4 and left‐lateral migration of the canyon; Uc denotes mass transport deposits on top of series Mc2.
5. Discussion
5.1. From Basin Subsidence to the EC Onset
Although the geological history of the North Ecuador margin is long and complex, we will consider its evolution only from Unit C to put the formation of the EC in its paleoenvironment and tectonic con-text. From its low‐amplitude layered seismic facies and large‐scale basin shape (Figure 7), Unit C is interpreted as a basin floor structure filled with fine‐grained sediment. The overlying Unit B consists of superimposed lens‐shaped bodies showing lateral changes of seismic facies from narrow, high‐ amplitude packages to low‐amplitude reflections that suggest occurrences of migrating nested channel fills and lobe deposits (Figures 7–9 and 11). This organization provides evidence for either a slope fan possibly fed by a canyon (e.g., Covault et al., 2007), or a network of deltaic channels, (Heller & Dickinson, 1985; Shanmugam, 2016). The coalescent lobes and scarce distributary channels imaged in Unit B, together with the lack of evidence of a fossil feeder canyon onshore support a multiple source ramps or better, a slope apron origin (Stow & Mayall, 2000).
The sharp contrast between the slope apron paleoenvironment of Unit B and that of underlying Unit C basin floor sediment (Figure 7) implies a significant change in regional paleotopography and paleodepth that is coeval with unconformity U2. Unit C, which is inferred to be a time equivalent of the Viche Formation (Figure 2; (Marcaillou & Collot, 2008), deposited at bathyal depths (Cantalamessa et al., 2007; Evans & Wittaker, 1982) during the Lower to Middle Miocene subsidence of the Manglares Basin (Lopez Ramos, 2009). Unit B is considered a time equivalent of the Lower Onzole and Angostura Formations based on regio-nal correlations (Marcaillou & Collot, 2008; Figure 2) and Late Miocene to late Early Pliocene sediment
Figure 13. Seismic reflection Line SCAN‐1066 shows evidence for cut‐and‐fill phases and left lateral migration of the Esmeraldas Canyon across terraces tK;
loca-tion in Figures 3 and 6b; seismic units, unconformities, CDP and VE as in Figure 7; Ls* is lowerfill series equivalent to Ls* in Figure 12; Incision 1 is continuous with unconformity U1 suggesting synchronicity. Sedimentfill of Incision 2 is equivalent to series Lc, Mc1, and Mc2 in Figure 12; axial Incision 4; Incision 3 has not been observed here; bsr is bottom‐simulating reflector.
recovered in dredge D13. Both the Lower Onzole and Angostura Formations were deposited in variable water depths including very shallow waters (Cantalamessa et al., 2007; Deniaud, 2000; Evans & Wittaker, 1982; Ordonez et al., 2006; Reyes, 2013). Accordingly, the middle to upper Miocene shelf detrital sediments of these formations are interpreted to change laterally to slope apron deposits on the Manglares Basin southern flank. Hence, unconformity U2 marks a major ~12‐ to 13‐Ma‐old tectonic episode (Figure 2) that deformed and uplifted the margin prior to Unit B deposition. Uplift of the Esmeraldas Platform went on during and after deposition of Unit B as shown by Unit B internal MTDs (Figure 9) and the warping up of Unit B across the EC and platform (Figures 8 and 9). These views imply that the EC, which bypasses the Esmeraldas Platform, postdates unconformity U2. Indeed, Incision 1, which is the EC oldest incision interpreted on seismic sections, truncates Units B and C and correlates spatially with unconformity U1 (Figures 8, 12 and 13) dated from the Miocene‐Pliocene boundary (Figure 2), suggesting that the EC inception occurred ~5.3 Ma ago.
5.2. Lateral Migration and Deepening of the EC: A Response to Uplift Events and Glacioeustatic Variations
Seafloor deformation commonly affects submarine canyon systems (Greene et al., 1991; Huyghe et al., 2004; Laursen & Normark, 2002; Mountjoy et al., 2009). In Ecuador, in the region of terraces tL and tM, the EC migrated eastward (Figure 16) possibly driven by local uplift in response to seaward verging, reverse faulting along the lower margin slope (Figures 1 and 12). In contrast, south of latitude 1°28′N, the canyon valley has steadily migrated toward the left bank of the canyon as revealed by geomorphological evidences (Figures 6a and 6b) and the systematic left‐hand shift of nested incisions beneath terraces tB, tC, tD, tI‐tF, and tK (Figures 12 and 13). The canyon migration differs from meander avulsions and cutoff loops that could occur on both sides of a channel on a stable passive margin in relation to sea level variations (Babonneau et al., 2004; Sylvester et al., 2011). Here, because EC Incision 1 is spatially associated with the Ostiones Swell and because the canyon migrated left‐laterally by steps between Incisions 1, 2, and 3 (Figures 8, 12 and 13), we suggest that the canyon migration responded to the tectonic growth of the NE trending Ostiones Swell (Figure 16). Additionally, each step of the canyon migration was accompanied by a deep incision in the margin, reaching 400–600 m in depth. Such remarkable deepening of the canyon requires strong erosion driven by an increasedflux of particles funneled in the canyon likely in response to glacioeustatic variations
Figure 14. Seismic reflection lines AMA across the Lower Esmeraldas Canyon and Ancon Canyon; seismic units, unconformities, CDP and VE as in Figure 7; (a)
Line AMA12 across terrace tL showing a mirror image of Line SCAN‐1066 structures in Figure 13, where Incision 2 cuts U1; present‐day Incision 4 is shown; (b) Line AMA11 cuts across terrace tM and the Ancon fault system; D12 is rock dredging (Table 1); Ld, and Ud are lower and upper series; (c) location map; (d) Line AMA66 showing the apex of an anticline incised by the Ancon Canyon; solid red lines are fault branches of the Ancon fault system; terrace tP features the scar of a slump mass failed in the Esmeraldas Canyon; Inset is a zoom on an abandoned spillway channel from the Manglares Basin.
and uplift events. On the one hand, local uplift events related to the tectonic activity of the Ancon fault system and subduction front contributed to the deep erosion of the LEC north of latitude 1°28′N. On the other hand, the growth of the Ostiones Swell, which controlled the evolution of the EC south of this latitude, occurred during the Late Miocene to Pleistocene regional tectonic events that uplifted the coastal range such as the Businga anticline structure (Evans & Wittaker, 1982; Reyes, 2013), which shows a common NE structural direction with the Ostiones Swell (Figure 1).
The depth distribution of Incision 2 along the EC (Figure 4c) supports the occurrence of an uplift of variable amplitude that postdates at least Incision 2. The EC stretch imaged on Lines SCAN 1052 and 1060 shows Incision 2 to be deeper than the EC thalweg and to have preserved part of its infilling (Figure 12), although Incision 3 deeply cut the margin during the subsequent uplift phase (Figure 9). In contrast, upstream and downstream of the canyon stretch crossed by SCAN Lines 1052 and 1060, the preserved traces of Incision 2 reveal shallower than the canyon thalweg (Figure 4c). Considering the longitudinal depth profile of Incision 2 to have been roughly linear, this observation means that the canyon stretches located upstream and downstream of the one crossed by SCAN lines 1052 and 1060 were uplifted by ~300–450 m since the infill of Incision 2.
Precise ages of the regional uplift events associated with the EC incisions are difficult to estimate but can be bracketed. According to Reyes and Michaud (2012), the lower part of the Upper Onzole Formation, named Lower Borbon and Sua members (Figure 2), extends along most of the Ecuador coastal range. Reyes (2013) reported a regional Middle Pliocene uplift episode marked by an angular unconformity that truncates the Lower Borbon member deposits (Figure 2). According to this author, the Canande Fault, interpreted as a north dipping, reverse fault, may have been reactivated at that time, thus uplifting the crustal block north of the fault (Figure 1). The Middle Pliocene uplift episode, which succeeded the EC inception, could be asso-ciated with Incision 2 of the EC (Figure 2). In this hypothesis, the sedimentfill of Incision 2 would be coeval with the Middle Borbon member. The Pliocene to Early Pleistocene age of sediment dredged at Sites D14 and D12 (Table 1) is consistent with this suggestion. Incision Phase 3 may result from one of the latest coastal uplift events identified by Evans and Wittaker (1982) as post–late Pliocene. Indeed, south of the Canande Fault (Figure 1) in the region of Jama, the Upper Borbon member consists of shallow marine deposits dated 1.6 ± 0.06 Ma (Cantalamessa et al., 2005) to 0.8 ± 0.1 Ma (Reyes, 2013) from40Ar/39Ar dating on ash pro-ducts. The member overlies unconformably the Middle Borbon member, pointing to a prominent early Pleistocene uplift event (Reyes, 2013). The subsequent uplift of the Upper Borbon member to an altitude of ~400 m southeast of Jama (Reyes, 2013) together with uplifted marine terraces dated 98 and 220 ka in the Punta Galera region (Pedoja et al., 2006) support a middle to late Pleistocene phase of uplift (Figure 2). Therefore, in addition to Incision 2 of the EC that reflects a mid‐Pliocene uplift event, Incisions 3 and 4 are tentatively associated with early Pleistocene, and middle to late Pleistocene uplift events that affected both the coastal and offshore regions of Ecuador. Considering the variable depth of Incision 2 along the EC (Figure 4c), and a ~1.8‐ to 2‐Ma age for Incision 3, a 0.15–0.25 mm/year
Figure 15. 3Seismic reflection line AMA16 showing the buried section of the Ancon canyon; ages of black and pink
Pleistocene uplift rate is inferred to have affected dominantly the regions of the Ostiones Swell axis, the Ancon fault system and the subduction front.
Pliocene‐Pleistocene sea level oscillations likely played a fundamental role in the development of the EC as suggested in other areas (Baztan et al., 2005; Bertoni & Cartwright, 2005). Although, recurring periods of rapid sea level fall would have contributed to the EC erosion (Bertoni & Cartwright, 2005; Rasmussen, 1994), the very short, distance (<1 km) between the present‐day EC head at the mouth of the Esmeraldas River and the−120‐m bathymetric contour (Figure 6a), a marker of the young-est low sea level stand, points to a long‐term canyon‐river connection that discards any major control of sea level changes on sedimentfluxes enter-ing the UEC. On the contrary, the 10‐ to 40‐km across‐shelf distance between the small rivers mouth (Figure 1) and the heads of the Atacames, Sua, and Same Canyons, which coincide with the 120‐m depth curve (Figure 6a), indicate that, during the Pliocene to Quaternary net sea level falls, especially over the last ~600 kyr when the sea level low stands dropped from ~−80 to −120 m (Hansen et al., 2013; Miller et al., 2005), an additionalflux of particles was funneled to the EC via the tributary can-yons, thus increasing the EC overall erosive power. In addition, the high flux of water produced during the Pleistocene melting periods of the Andean glaciers, combined with lahars related to the volcanic activity that intensified during the early Pleistocene (Barberi et al., 1988) likely aug-mented offshore sediment delivery, and hence assisted the youngest can-yon incision phases.
Middle Pliocene Incision 2 occurred when the average, long‐term sea level started lowering below the modern sea level, that is, ~3.5–3.0 Ma ago (Hansen et al., 2013), and the incision depth was possibly increased dur-ing the prominent sea level fall at 3.3 Ma (Miller et al., 2005). Considering that ensuing Incision 3 occurred during an early Pleistocene uplift event, the incision was definitely affected by the middle to late Pleistocene ~100‐kyr glacioeustatic cycles. In this hypothesis, what-ever the origin of series Mb and Ub infilling the Same Canyon and the EC near at their junction, the change of the reflectivity within the series and the occurrence of their bounding unconformities (Figures 9 and 10) sug-gests a variation of the sediment supply controlled by sea level variations. Accordingly, series Mb and Ub could have been emplaced during middle to late Pleistocene periods of low sea level stands and continuous sea level rises (Rasmussen, 1994). The MTD of series Uc in Line SCAN 1060 (Figure 12) may be coeval with series Mb and Ub (Figure 9). Elsewhere along the EC (Figures 8, 11 and 13), the post Incision 3, canyon infill series were either nondeposited or fully eroded together with the trace of Incision 3 and locally older incisions, as a result of the combined effects of both the most recent uplift events and high‐amplitude sea level fluctuations, giving way to deep axial Incision 4.
5.3. Longitudinal Canyon Depth Profile Anomalies as Evidences for Recent Margin Vertical Deformation
According to Covault et al. (2011), recent canyons and channel systems across convergent margins show convex‐up longitudinal depth profiles, such as in the San Antonio Canyon in Chile (Hagen et al., 1996), the Kushiro Canyon in Japan, (Noda et al., 2008), and La Aguja and Patia Canyons in Colombia (Ratzov et al., 2012; Restrepo‐Correa & Ojeda, 2010). Although running across a convergent margin, the EC shows an overall linear, 1° dipping longitudinal depth profile indicating that the canyon is close to equilibrium,
Figure 16. Geological interpretation of the study area showing simplified
bathymetry, cut andfill canyon terraces, slump scars, slump blocks and mass transport deposits; note that left‐lateral migration of the southern half of the Esmeraldas Canyon is associated with the tectonic growth of the Ostiones Swell.
that is, that the erosion roughly balances tectonic growth (Figure 4c). This linear profile contrasts with the convex‐up profile of the nearby Patia Canyon where tectonic uplift overcomes canyon erosion (Figure 7b in Ratzov et al., 2012). Two major differences between the geological settings of these canyons may account for this distinction. (1) Margin contraction faulting and folding is more active northwest of Tumaco than in the deep‐water Manglares Basin (Collot et al., 2004; Figure 1); (2) gravity flows along the EC are frequent as indi-cated by the canyon permanent connection with its feeder‐river and the growing trench turbidite system (Migeon et al., 2017), whereas they have largely decreased along the Patia Canyon as substantiated by its dis-connection from its river, its damming by a landslide, and the quasi inactivity of the channel‐levee system in the Colombia trench (Ratzov et al., 2012).
The EC longitudinal depth profile shows, however, a 50‐m‐high bulge and knick points reflecting potential tectonic causes (Figure 4c). The bulge visible along the MEC thalweg between 900 and 1,400 m of water depths is not related to sedimentary causes such as a MTD, which would have dammed the canyon, but sug-gests that active seafloor bulging locally overcomes the canyon erosion. Knick Point 1 located immediately downstream of the bulge suggests active downcutting by the canyon as gravityflow strives to reestablish a smoothed out profile (e.g., Huyghe et al., 2004). Cross Section 7 in Figure 4a, which cuts the canyon upstream of Knick Point 1, is V‐shaped and contrasts with the U‐shaped sections directly upstream and downstream (Cross Sections 6 and 8 in Figure 4a), thus supporting active local incision in response to the bulging of the MEC thalweg. The area of active bulging along the MEC depth profile extends perpendicularly to the NE trending axis of the Ostiones Swell (Figure 16), thus supporting the active growth of the swell and uplift of the Esmeraldas Platform.
Knick Point 2 at 2,100 m of water depth features a 50‐m‐high jump of the thalweg. It roughly coincides spa-tially with the crossing of the LEC by the NE trending Ancon fault system suggesting a causal link. Near the mouth of the EC, Knick Point 3 coincides with the sharp bend and the narrowing of the LEC thalweg, a sad-dle and a 3.5° slope toward the trench, pointing to the canyon forcing its way through an obstacle, here a massive avalanche deposit as discussed further below.
5.4. Role of Structural Features in the Localization of the EC and Its Upper Margin Tributary Canyons
Diapiric structures are ubiquitous beneath the upper margin slope where they are dominantly hosted in Unit E. They deform seismic units below the EC valley and its tributary canyons (Figures 7 and 9), suggesting that diapiric structures have had a key influence on their location. In the region of the Atacames and Sua Canyons, diapiric intrusions have folded both Unit C and unconformity U2 (Figures 7 and 10), thus creating syncline paleovalleys between diapiric highs prior to thefirst incision stages of the canyons. The tributary canyons may have been initially chartered by the small intervening synclines, which likely guided the early gravityflows, prior to incise more deeply Unit B (Figures 7 and 10). The tributary canyons were possibly ali-mented by slope sediment remobilization, although particles delivered by small rivers (Figure 1) that brea-ched the shelf during sea level low stands likely contributed to the tributary canyons development. In contrast with the Atacames and Sua Canyons, the Same Canyon likely originated from a gravity‐driven paleoscar (Figure 10, CDP 1050‐1350), as the scar propagated headward (e.g., in Farre et al., 1983; Pratson & Coakley, 1996) andfilled up with MTD and overlying thinly stratified sediment. The MTD experienced differential compaction (Joanne et al., 2010), which would have contributed to destabilize overlying sedi-ment, thus easing the development of the Same Canyon.
Although crustal faults are difficult to identify below the EC, seismic diffractions as well as vertical offsets of basin and oceanic basement reflectors advocate crustal faults. Because the canyon consists of a succession of linear stretches with preferential north, NW, and NE directions, such faults are suspected to tectonically con-trol directly or indirectly the canyon path. For example, faults and folds associated with the EC flanks (Figures 8, 9, 11 and 12) may have controlled the canyon setting and evolution, as well as the fault‐related, gentle folds of Units C and D that underlay the UEC (Figure 7) possibly facilitated the canyon localization. On a larger scale, the N‐S trend of the LEC, which is oblique to the NW facing margin slope gradient, may be controlled by deeper crustal structures.
The interaction between the EC and the NE trending Ancon fault system may have disturbed the course of the canyon in the form of an apparent left‐lateral offset of the short canyon segment facing terrace tN (Figure
6c). Conversely, a right‐lateral offset of the canyon could be suggested on the basis of the abrupt widening of the canyon thalweg from <1 km south of the canyon‐fault intersection to ~2 km north of it, according to the canyon erosion model across a strike‐slip fault proposed by Appelgate et al. (1992). However, enhanced erosion of the EC western wallflanking terrace tN, in response to focused additional gravity flows carried along the AC, likely contributed to the apparent left‐lateral offset.
5.5. Slope Instability and Role of MTD in Damming the EC
Gravityflows along the EC were likely blocked by MTDs identified along the canyon valley (Figures 8, 9 and 6a). The recent MTD underlying terrace tH (Uc in Figure 12) dammed the EC prior to be partly eroded. Core Kama 24 collected on terrace tH (Figure 6b) recovered 3.73 m of sandy turbidites blanketing the slump mass (Leclerc, 2016).14C dating of wood fragments sampled at 224 and 308 cm along the core provided, respec-tively, 145 years BP ± 15 and 10,725 years BP ± 30 ages, indicating that the MTD emplaced prior to 10,725 years. The steep arcuate scarp from which this MTD originated (Figure 6b) together with two other relatively fresh morphologic scars (V and W in Figure 3) supports a highly unstable upper margin slope asso-ciated with the Esmeraldas Platform uplift and active faulting (Figure 1 and CDP 6600 in Figures 11 and 12; CDP 7200‐7600 in Figure 9). This instability is critically augmented in the EC as basal erosion over steepens itsflanks. Interestingly, the slump block that underlies terrace tG (Figure 11) did not crumbled down so far but remained suspended and partially obstructed the canyon valley.
At the canyon mouth, a massive landslide may have blocked the LEC (Figure 16). At this location, the drastic width reduction of the LEC valley from ~8 to 2 km suggests that the wide canyon valley that once reached the trench, has been plugged before the canyon changes its course by 80° to breach the deformation front (Figure 6c). The contrasting morphologies between the left (Q) and right banks (S2) of the narrow canyon stretch support this interpretation, which is reinforced by the large slump scars overhanging both Features S1 (tP in Figure 14d) and S2. Accordingly, if this assumption were true, the delivery of particles to the trench would have been mostly interrupted when the canyon mouth was dammed. Seismic Line 10032 (Figure 17) shot across the trench turbidite system reveals two remarkable unconformities separating sedimentary series with contrasting reflectivity. The highly reflective and thinly stratified series Ue features levee deposits that laid over the poorly reflective and well‐stratified strata of series Me. Series Me laps onto an erosive unconformity that tops underlying highly reflective and tectonically deformed series Le. The relative weak reflectivity of series Me may indicate a more homogeneous unit enriched in pelagic sediment and con-taining comparatively less turbidite deposits than series Ue and Le. The change from Le to Me thus suggests a sharp decrease of turbidite supply in the trench over a long time laps that we interpret as the damming of the canyon valley by the landslide. During this period, probably only thefinest‐grained fraction of turbidites was able to overspill the dam and deposit in the trench.
A return to a turbidite‐enriched sedimentation such as interpreted in series Ue and retrieved in core KAMA 21 in the trench channel‐levee system (Figure 3; Migeon et al., 2017), occurred when the landslide was cleared enough by gravityflows and the canyon broke the plug. This scenario suggests that when the canyon was plugged, turbidite dominant sedimentation accumulated in the canyon valley upstream of the plug. Breaking the plug favored terraces formation possibly as terrace tO by resumption of the canyon incision. The unconformities separating series Ue, Me, and Le are tentatively dated 27 kyr ± 6.7 kyr for the shallowest and 65 kyr ± 6.7 kyr for the deepest on the basis of a mean sedimentation rate of 0.67 cm/year obtained from core KAMA21 (Migeon et al., 2017). The 65‐kyr age is, however, underestimated since the sedimentation rate of turbidite‐depleted series Me is likely lower than that of series Ue. These ages imply (1) that prior to ~65 kyr an event caused a slope collapse sufficiently large to clog the canyon and (2) over ~38 kyr were neces-sary for the canyon activity to breach the dam. Because the EC is considered the main source for sediment to be remobilized during regional large earthquakes (Migeon et al., 2017), landslide events blocking the EC have significant implications as they may introduce time gaps in the trench paleoseismology records. 5.6. Timing of the Deformation and Abandonment of the AC
As illustrated along the Chilean margin, tectonic deformation can block the development of a canyon (Bernhardt et al., 2015). In the Manglares Basin, the AC, which acted as the main spillway of the basin, was deformed recently by a growing anticline associated to a crustal splay fault (Collot et al., 2008). The youngest basin horizon to be truncated by the AC along Line AMA16 (Figure 15) is dated 195 kyr ± 35
kyr. This age is obtained from an average sedimentation rate of 0.62 mm/year calculated on the basis of14C dates obtained from foraminifers sampled in cores Kama17 and 18 located along Line AMA16 (Figure 3; Gastaud, 2010). A small levee complex built on the buried canyon northern rim (Figure 15) above the dated truncated horizon, implies that the canyon was active ~195 kyr ago. The top horizon of the canyon fill, which is dated 164 kyr ± 30 kyr along Line AMA16, benchmarks the canyon abandonment. A conservative ~1,050‐m initial water depth of the canyon thalweg beneath the saddle, based on the ~1,000‐ m depth of the buried canyon bottom on AMA16, implies that the anticline responsible for the saddle had to grow up by ~50 m (Figure 4c) between 195 and 165 kyr at an ~1.6‐mm/year rate to reach a 0° downstream slope, so that the canyon ceased being a spillway channel of the Manglares Basin. Since the canyon abandonment, the anticline kept growing at ~1.6 mm/year to reach the present‐day 750‐m water depth in the saddle. After the closure of the AC, the sediment pathway from the Manglares Basin to the EC migrated southward and remained active for a short time period as indicated by an abandoned erosive channel (Figures 3 and 14d). This tectonic process illustrates a mechanism by which a fore‐arc basin fills up.
5.7. Potential Role of Carnegie Ridge Subduction on the EC Formation
The uplift of the Ecuador forearc that accompanied the construction of the submarine slope apron and the development of the EC over the last ~12–13 Ma occurred during a global convergence rate decrease between Nazca and South American Plates (Pardo‐Casas & Molnar, 1987; Somoza & Ghidella, 2012). However, the South American Plate has been advancing over the Nazca Plate at least since ~5.8 Myr so that the trench migrates westward at 17–28 mm/year (Gripp & Gordon, 2002; Heuret & Lallemand, 2005). According to Lallemand et al. (2005), continental advancing upper plates correlate with low slab dips (<30°) and upper plate back‐arc compression. Such a geodynamic framework encountered in Ecuador (Lonsdale, 1978; Manchuel et al., 2011; Nocquet et al., 2014; Trenkamp et al., 2002) favored uplift and contraction across the subduction zone, though the subduction of the Carnegie Ridge (CR) likely influenced the Pliocene‐ Pleistocene deformation pattern (Aalto & Miller, 1999; Gutscher et al., 1999; Lonsdale, 1978; Pedoja et al., 2006). Indeed, the inception of the EC ~5.3 Ma ago coincides with (1) an uplift of the northern Ecuador coastal area (Di Celma et al., 2010) (Reyes, 2013), (2) an ~1‐km uplift of most the coastal range since the early Pliocene as deduced from detrital apatite and zircon ages (Vacherat et al., 2017), and (3) a rise of elevated exhumation rates that initiated between 5.5 and 3.5 Ma within the Western and Northeastern Cordilleras, which Spikings et al. (2010) tentatively associated with the subduction of the Carnegie Ridge. A reappraisal of the Carnegie Ridge subduction model proposed by Collot et al. (2009), using the plate convergence kine-matic result of Nocquet et al. (2014), suggests that the Carnegie Ridge entered subduction ~5–6 Ma ago, slightly later than the 8 Ma proposed by Daly (1989). Considering that the structures of the subducted CR were as irregular as those resulting from the along‐strike variations of width, topography, and crustal
Figure 17. Seismic reflection Line 10032 across the Colombia trench fill, near the mouth of the Esmeraldas Canyon; faults
in red; Le, Me, and Ue are lower, middle, and upper trenchfill series; dotted lines are unconformities between series; note Me low reflectivity contrasting with Ue and Le higher reflectivity; ages of unconformities are derived from14C dating on sediment from KAMA 21 core (Migeon et al., 2017); see Figure 3 for location.