HAL Id: hal-02417796
https://hal.archives-ouvertes.fr/hal-02417796
Submitted on 18 Dec 2019
HAL is a multi-disciplinary open access
archive for the deposit and dissemination of
sci-entific research documents, whether they are
pub-lished or not. The documents may come from
teaching and research institutions in France or
abroad, or from public or private research centers.
L’archive ouverte pluridisciplinaire HAL, est
destinée au dépôt et à la diffusion de documents
scientifiques de niveau recherche, publiés ou non,
émanant des établissements d’enseignement et de
recherche français ou étrangers, des laboratoires
publics ou privés.
Darwin2.3
C. Carmouze, C. Vaglio-Gaudard
To cite this version:
C. Carmouze, C. Vaglio-Gaudard. The Similarity/Transposition theory to Assess Accurately
PWR-MOx 15x15 Used Fuel Inventory with Darwin2.3. International Conference on Nuclear Fuel Cycle
(GLOBAL - 2017), Sep 2017, Seoul, South Korea. �hal-02417796�
The Similarity/Transposition theory to Assess Accurately
PWR-MOx 15x15 Used Fuel Inventory with Darwin2.3
Coralie CARMOUZE, Claire VAGLIO-GAUDARD
Commissariat à l’Energie Atomique et aux énergies alternatives (CEA) DEN, DER, SPRC, 13108 Saint Paul les Durance - France
Email: coralie.carmouze@cea.fr
Abstract – The DARWIN2.3 package, dedicated to the characterization of spent fuels from reactors, benefits from a broad
experimental validation database for the isotopic inventory of 17x17 PWR mixed oxide (MOx) fuels. However, a lack is to notice for fuels in 15x15 configurations: indeed, no data are available in the post irradiation examination (PIEs) database for these fuels. Under those circumstances, the CEA has decided to study the possibility to make use of the experimental validation available for MOx fuels to assess accurately 15x15 PWR-MOx fuels depletion calculation results. This paper focuses on preliminary investigations on the use of the similarity/transposition approach on 17x17 PWR-MOx fuel rod depletion calculations to use in 15x15 PWR-MOx fuel rod characterization.
I. INTRODUCTION
The DARWIN2.3 package1,2, developed by the CEA in
collaboration with its industrial partners (AREVA, EDF), is the French reference for fuel cycle studies. It is dedicated to the characterization of used fuels from reactors in terms of material balance, decay heat, activity, radiotoxicity, neutron, α, β and γ sources and spectra. DARWIN2.3 benefits from a broad experimental validation database for the isotopic inventory of 17x17 PWR mixed oxide (MOx) fuels but a lack is to notice for fuels in 15x15 configurations: indeed, no data are available in the post irradiation examination (PIEs) database for these fuels. Under those circumstances, the CEA has decided to study the possibility to make use of the experimental validation available for MOx fuels to assess accurately 15x15 PWR-MOx fuels depletion calculation results.
This paper focuses on preliminary investigations on the use of the similarity/transposition theory on 17x17 PWR-MOx fuel rod depletion calculations to use in 15x15 PWR-MOx fuel rod characterization. This kind of approach is generally used for criticality applications4,5 and
for reactors in operation6,7. A first relevant use of this
theory on fuel depleted calculations has been done for Sodium Fast Reactor (SFR) blankets3 but, this paper
presents the first use of this approach on PWR-fuels depletion calculations.
First, the method is briefly described, then the inputs data are defined and after all, the results of the bias transposition and the nuclear data uncertainty reduction are presented and analyzed.
II. CALCULATION METHODS AND SIMILARITY/TRANSPOSITION APPROACH
II.A. Calculation tools and methods
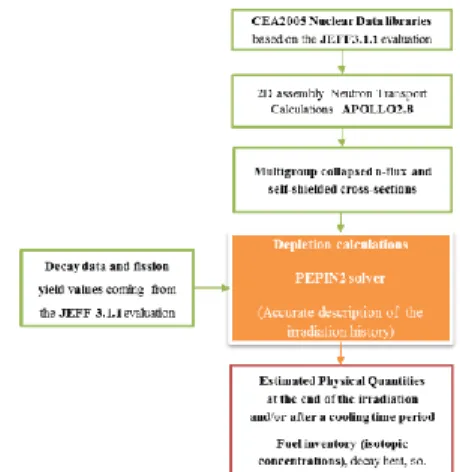
DARWIN2.3 performs the nuclide depletion calculation (PEPIN2 solver), fed by libraries on the one hand, and neutronic data on the other hand (Fig. 1). All the decay data and fission yield values come from the JEFF-3.1.1 evaluation8, whereas the self-shielded cross-sections
and neutron spectra are provided by deterministic neutron transport codes: APOLLO2.89 for Light Water Reactors
studies, resolving the Boltzmann equation on 2D infinite assembly. It is to notice that DARWIN2.3 has been experimentally validated for LWR and SFR fuels.
Fig. 1. DARWIN2.3 calculation route for PWR fuels depletion calculations
It should be noted that the accuracy of the DARWIN2 results depends mainly on the APOLLO2 assembly calculation. The PWR reference calculation route is based
on the CYCLE2008 neutron calculation scheme, using the CEA2005 cross-section library in a 281-group-structure energy mesh (SHEM) processed from the JEFF-3.1.1 evaluation. The neutron energy spectrum is calculated in the 2D assembly geometry, using a Pij multicell model with the UP1 interface current method based on linearly anisotropic interface fluxes. The fuel pellets are split into four rings, in order to give an accurate representation of
238U absorption as well as a fission products concentration
profile. Local spectrum calculation is performed in the SHEM 281-energy-group structure. Moreover, optimized self-shielding calculations and refined burnup steps for the depletion calculation are involved in this calculation scheme2.
In the case of MOx assembly calculation, the UO2
environment is taken into account.
For the need on this study the calculation scheme was optimized. After the 281 energy-groups self-shielding calculations, the cross-sections are collapsed on a 26-energy-group structure to compute the neutron-flux. This 26-energy-group-structure is derived from the LWR application field10.
II.A. Similarity/Transposition approach
This approach11 is based on sensitivity/uncertainty
calculations; statistical nuclear data adjustments equations; integral experiment selection and similarity quantification between selected experiment and an application system.
This approach is used in order to transpose an experiment-over-calculation discrepancy (supposed due to nuclear data uncertainties) into a computational bias. This method also gives the a posteriori uncertainty for an integral response knowing the a priori uncertainty due to nuclear data, the experimental uncertainty and a correlation factor.
The first step consists in quantifying the similarity between a pair of systems by using the sensitivity information relative to nuclear data. Sensitivity analyses produce energy dependent sensitivity coefficients that give the relative change in the depleted isotopic concentrations system values as a function of relative changes in the Nuclear Data (ND) by isotope, reaction and energy. These sensitivity coefficients are calculated by using a perturbation theory and can be written as (1) and (2) in our case.
Let A and E be the subscripts referring to an application and an experiment. Let I be the calculation of the isotopic concentrationintegral value.
SA is the sensitivity coefficients vector of IA to ND for the
case of application (1) and SE is the sensitivity coefficients
vector of IE to ND for the experimental cases (2). d refers
to uncertain nuclear data.
𝑆𝐴= 𝜕𝑑𝜕𝐼𝐴𝑔 𝑑𝑔 𝐼𝐴, g = 1, 2,…, N (1) 𝑆𝐸= 𝜕𝐼𝐸 𝜕𝑑𝑔 𝑑𝑔 𝐼𝐸, g= 1,2, …, N (2)
where N is the number of nuclide-reaction pairs (x the number of energy groups).
The sensitivity coefficients are computed for each isotope, each reaction and each of the 26 energy groups by the APOLLO2 deterministic neutron transport code9 involving a direct perturbation method. This method consists in a reference calculation of the integral parameter of interest (here, the isotopic concentration) and in np calculations
where the uncertain parameters (here, the nuclear data) are perturbed one by one. A one percent perturbation is applied. It is to notice that the linearity of the response to the ND perturbation should be provided.
Moreover, in this study the parameter of interest is not only the isotopic concentration but the isotopic concentration ratio i/238U in the fuel rod because the experimental results
are available on that form to reduce experimental uncertainties. Nevertheless, the relative sensitivity of a ratio is equal to the difference of the relative sensitivity of the numerator and the denominator, as expressed in the formula (3). S (i U 238 ⁄ )= σ (i U 238 ⁄ ) .∂σ∂ (i⁄238U) S (i U 238 ⁄ )= σ (i U 238 ⁄ ) . (2381U) 2 ⌊238U. ∂ ∂σ(i) − i. ∂ ∂σ( U 238 )⌋ S (i U 238 ⁄ ) =σi.∂σ∂ (i) −238σU. ∂ ∂σ( U 238 ) S (i U 238 ⁄ )= S𝑖 − SU238
(3)
where i is the final concentration of the isotope i.
Then, uncertainty analysis propagates the nuclear data uncertainty information to the isotopic concentration values of the system by using the sensitivity coefficients. The result is an estimate of the a priori uncertainties in the calculated values of the depleted isotopic concentrations systems due to cross-sections, radioactive decay constants, branching ratios and fission yields uncertainties.
The a priori uncertainty due to nuclear data for IA
(resp. IE) are given by the equations (4) and (5). 𝐷𝜎 is the prior nuclear data covariance matrix (N x N).
𝜀𝐴2= 𝑆𝑡 𝐴𝐷𝜎𝑆𝐴 (4)
𝜀𝐸2= 𝑆𝐸𝑡 𝐷𝜎𝑆𝐸 (5)
Finally, a similarity factor can be calculated. This correlation coefficient, given by the equation (6), measures
the similarity between the application system and one integral experiment system in term of related sensitivity and uncertainty. Its value ranges from 0 to 1. A value of 0 means that the experiment system and the application system are not correlated, the experimental information is not of any utility. While a value of 1 indicates a full correlation between the systems, the experimental information should be fully exploited.
𝑟𝐴,𝐸= 𝑆𝐴
𝑡 𝐷 𝜎𝑆𝐸
𝜀𝐴 𝜀𝐸 (6)
where 𝐷𝜎 is the prior nuclear data covariance matrix (7). This matrix represents the uncertainties and the correlations between the different energy groups and the different reactions.
𝐷𝜎 = ( (𝑋𝑟𝑟)
(… )
𝑣𝑎𝑟 (𝑇, 𝑏𝑟, 𝛾) ) (7) where Xrr are the microscopic cross-sections
covariance (r for reaction = fission, capture, etc. ; X for an isotope X) read from the CEA COMAC library12,
expressing the correlation between the energy groups and the partial cross-sections (e.g. capture-fission). The correlations between different isotopes are not yet available and so, are not taken into account. var (𝑇, 𝑏𝑟, 𝛾) is the variance matrix for the decay data (half-lide period, branching ratios) and the fission yield, resulting from the JEFF-3.1.1 library8; the correlations are not taken into
account for these data. Concerning the different nature data (e.g. fission yield vs. branching ratio), it is supposed that the data come from specific and independent measures, so they are supposed to be independent. Concerning the same nature data: the decay periods and the branching ratios involved in this study are not correlated though, the independent fission yields are strongly correlated but these correlations were not yet available when this study started. Meanwhile efforts have been made at CEA to provide an a posteriori correlation matrix for JEFF-3.1.1 fission yields. By the way, since the similarity/transposition approach is based on the nuclear data adjustment theory11, the use of
reliable variance and covariance nuclear data is of importance for the quality of its application.
After all, the bias transposition is a direct application of the similarity analysis. It enables to transpose the experimental result of a given application to another application thanks to the quantified similarity between this pair of systems. This approach supposed the absence of calculation bias, meaning that the calculation-over-experiment discrepancies are only due to nuclear data and experimental uncertainties. Then, the calculation-over-experiment bias can be directly transposed to a
computational bias on the application system with an associated reduced a posteriori ND uncertainty. This could be expressed with the equations (8) and (9).
(𝐼𝐴∗−𝐼𝐴 𝐼𝐴 ) = (𝑟𝐴,𝐸. 𝜀𝐴 𝜀𝐸 1 1+(𝛿𝐸 𝜀𝐸) 2) ( 𝐸−𝐼𝐸 𝐼𝐸 ) (8) 𝜀𝐴∗2= (1 − 𝑟𝐴,𝐸2 1+(𝛿𝐸 𝜀𝐸) 2) 𝜀𝐴2 (9)
where E is the experimental value and 𝛿𝐸 the associated experimental uncertainty.
III. SELECTED EXPERIMENT AND 15X15 PWR MOX APPLICATION
III.A. Nuclides of interest
To highlight the pertinence of the use of similarity/transposition approach, this preliminary study focuses on a restricted list of nuclides. This list consists of major actinides, 241Am and fission products of interest for
criticality burnup credit application. The regarding nuclides are as follow:
234U, 235U, 236U, 238Pu, 239Pu, 240Pu, 241Pu, 242Pu, 241Am, 103Rh, 149Sm, 155Gd, 133Cs
III.B. Description of the selected integral experiment
The experiment is selected in the fuel inventory validation database of DARWIN2.32,14: the French Post Irradiated Examination database. The experimental fuel inventory values result from the destructive analysis of rod cuts extracted from French PWR-irradiated fuels.
For this study the DAMPIERRE 2 experiment was selected. It concerns fuel rods from 17x17 MOx assemblies where all the nuclides of interest were measured. The MOx fuel is characterized by a 3-region enrichment (high, medium, low). The E05 sample (Fig. 2) was selected, it was irradiated in the assembly central zone with an initial weight ratio Pu/(U+Pu) equal to 6.7%. The burnup reached by the irradiated sample was close to 40 GWd/t.
Fig. 2. 17x17 REP-MOx assembly
III.C. Description of the application case
The application case should be representative of a real one. A 15x15 square lattice assembly with a PWR-MOx fuel from the GÖSGEN nuclear power plant is selected for this study, all the characterization data are available in the literature. As the experimental case, the MOx fuel is characterized by a 3-region enrichment. The study focuses on a fuel rod with a similar spatial position (i.e. equivalent environment, Fig. 3) and with an initial weight ratio Pu/(U+Pu) equal to 8.7 %. As for the experimental case, the selected average burnup is 40 GWd/t.
Fig. 3. 15x15 REP-MOx assembly
IV. RESULTS AND ANALYSES
IV.A. Similarity between the integral experiment and the application case
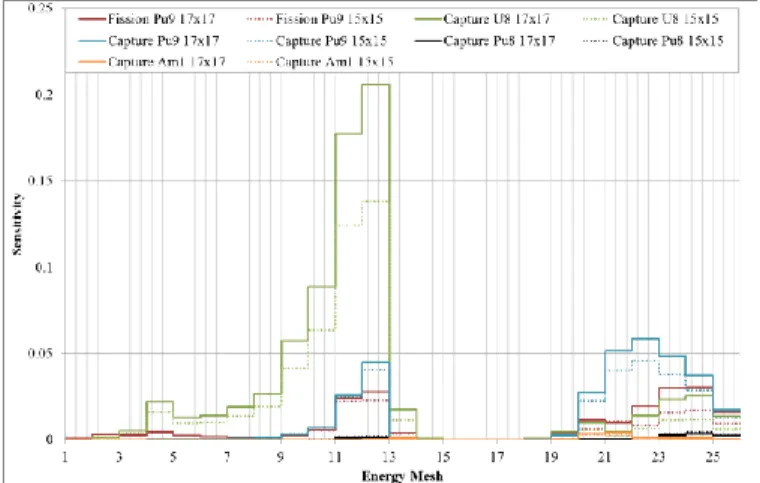
As explained above, the first step consists in sensitivity/uncertainty analyses. As an illustration, let us focus on the 239Pu depleted concentration. For this nuclide,
the sensitivity analysis shows, for the both systems (17x17 and 15x15), a significant sensitivity to first 239Pu fission,
then to 238U radiative capture and, to a less extend, to 239Pu, 238Pu and 241Am capture. The Fig. 4 presents these
sensitivity profiles versus the energy groups for each system (17x17 and 15x15).
Fig. 4. 239Pu concentration-sensitivity profiles to nuclear data
TABLE I gives the similarity factor between the depleted isotopic concentrations of the 17x17 and 15x15 PWR-MOx fuel rods and the a priori ND uncertainty.
TABLE I
A priori ND uncertainties and similarity factor for the isotopic
concentrations of the selected nuclides
r 17x17, 15x15 ε 17x17 ε 15x15 238Pu / 238U 0.99 2.1% 2.0% 239Pu / 238U 0.99 1.6% 1.3% 240Pu / 238U 0.99 2.1% 1.6% 241Pu / 238U 0.99 1.6% 1.4% 242Pu / 238U 0.99 3.0% 2.1% 241Am / 238U 0.99 1.5% 1.3% 234U / 238U 0.96 0.8% 0.6% 235U / 238U 0.99 0.3% 0.3% 236U / 238U 0.99 1.5% 1.5% 103Rh / 238U 0.99 1.6% 1.5% 155Gd / 238U 0.99 21.4% 22.1% 149Sm / 238U 0.99 4.0% 4.0% 133Cs / 238U 0.99 1.4% 1.3%
The correlation coefficients are very close to one for all the nuclides of interest. This was predictable because the sensitivity profiles are close to each other but it is an interesting result because the initial fuel compositions are close but not similar. Nevertheless, the studied fuel rods are in the same neutron spectra conditions.
The a priori uncertainties due to nuclear data are from 0.3% on 235U concentration to 22.1% on 155Gd
concentration. For this nuclide, a parallel study about the nuclear data uncertainty contributors has been performed. It has shown that the major contributor to the ND uncertainty on the depleted 155Gd concentration is the 155Eu
(n,γ) microscopic cross-section (21%).
Also, all these results highlight that it is consistent to proceed to the bias transposition.
IV.B. Bias transposition and uncertainty reduction
TABLE II
Results of the bias transposition for MOx 15x15 fuel rod ( 𝐸 𝐼17𝑥17− 1) ± δE 𝐼∗ 15𝑋15 𝐼 15𝑋15 − 1 𝜀15𝑥15∗ Uncertainty Reduction 238Pu / 238U 4.8 ± 0.4 % 4.5% 0.5% 75% 239Pu / 238U 5.4 ± 1.7 % 2.0% 0.9% 31% 240Pu / 238U -3.3 ± 0.4 % -2.5% 0.4% 75% 241Pu / 238U 6.0 ± 0.5 % 4.6% 0.5% 64% 242Pu / 238U -3.7 ± 1.1 % -2.3% 0.8% 62% 241Am / 238U 3.5 ± 0.6 % 2.6% 0.5% 62% 234U / 238U 2.3 ± 0.5 % 1.1% 0.3% 50% 235U / 238U 0.6 ± 1.6 % 0.0% 0.3% 0% 236U / 238U 2.2 ± 1.4 % 1.2% 1.1% 27% 103Rh / 238U -8.4 ± 5.3 % -0.6% 1.5% 0% 155Gd / 238U 7.5 ± 2.7 % 7.6% 2.8% 87% 149Sm / 238U 5.6 ± 1.6 % 4.8% 1.5% 63% 133Cs / 238U -1.2 ± 1.8 % -0.4% 1.1% 15%
The result, summarized in TABLE II, show that the transposition of the (E/I17x17 – 1) values to the 15x15 MOx fuel case generally allows a strong reduction of the a priori ND uncertainty. It ranges from 15 to 87% for 155Gd.
However, for 235U and 103Rh no reduction is observed.
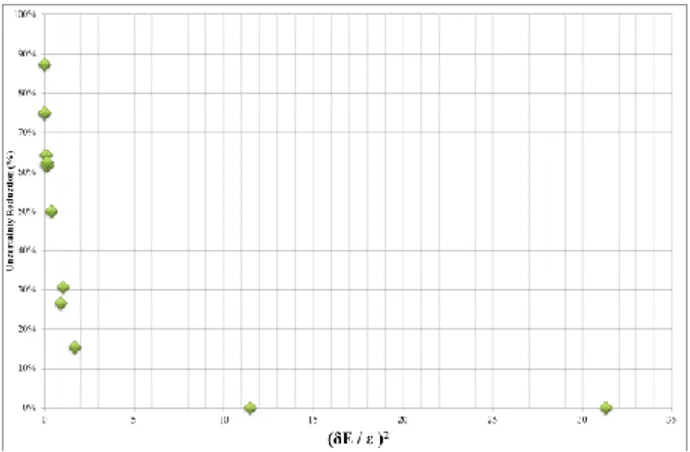
Actually, the bias transposition and uncertainty reduction results depend on the similarity factor (>0.95 for all nuclides) and on the ratio between the experimental uncertainty and the a priori ND uncertainty. This method is valuable if, from one side, the similarity factor between the experiment and application case is high and if, from the other, the experimental uncertainty is lower than the a priori nuclear data uncertainty. The Fig. 5 clearly illustrates this statement, as the following focus on 235U and 155Gd results. For the first one, the a priori ND uncertainty is quite small compared to the experimental uncertainty (δE = 1.6%, ε = 0.3%) so, the bias transposition is not
valuable. In contrast, the 155Gd concentration (δE = 2.7%, ε
= 21.4%) corresponds to a favorable situation and the bias transposition is clearly valuable.
Fig. 5. Uncertainty reduction versus the experimental on nuclear data uncertainty ratio
V. CONCLUSIONS
This paper focuses on preliminary investigations on the use of the similarity/transposition theory on 17x17 PWR-MOx fuel rod depletion calculations to use in 15x15 PWR-MOx fuel rod characterization. This theory involves sensitivity and uncertainty analysis methods.
To highlight the interest of the approach, this application was firstly limited to one plutonium vector, one average burnup (≈ 40 GWd/t) and to a list of thirteen isotopes of interest: 234 to 236U, 238 to 242Pu, 241Am, 103Rh,
155Gd, 149Sm, 133Cs. Moreover, the 17x17 PWR-MOx
experimental data used in this study come from the DARWIN2.3 validation database (MOx-DAMPIERRE2).
This study highlights the interest of the use of the similarity/transposition approach for 15x15 PWR-MOx fuel depletion calculations. The similarity factors, i.e. the correlation relative to nuclear data uncertainties, between the depleted isotopic concentrations of the both systems (17x17 and 15x15) reach 0.99. This high degree of correlation is necessary for an accurate assessment of the computational bias and uncertainty due to nuclear data.
The predicted computational bias is comprised between -2.5% and 7.6% and the nuclear data uncertainty reduction can reach 87%. Higher is the similarity between the depleted isotopic concentrations of the systems and, lower is the ratio between experimental uncertainty and nuclear data uncertainty; better is the nuclear data uncertainty reduction.
These first results are encouraging; the use of such approach could help to characterize accurately depleted isotopic concentrations of fuels with no experimental data by using experimental available data of similar depleted fuels.
The next step consists in confirming the results of this study by broadening its applicability range by working on
a larger range of burnup, isotopic Pu vector, initial Pu amount and various spatial positions of the rod in the case of application. Moreover, the impact of the cross-sections covariance matrix should be evaluated as well as the fission yield covariance matrix.
ACKNOWLEDGMENTS
The autors are thankful to AREVA NC and EDF for their financial support.
The autors are grateful to Guillaume Krivtchik of the CEA Reactor Studies Department for his precious help to compute the similarity/transposition calculations.
REFERENCES
1. A. TSILANIZARA et al., “DARWIN: an evolution code system for a large range of applications”,
Nuclear Science and Technology, Suppl. 1, p. 845-849
(2000).
2. L. SAN FELICE et al., “Experimental validation of the DARWIN2.3 package for fuel cycle applications”,
Nuclear Technology, vol. 184, pp. 217-232, (2013).
3. J-F. LEBRAT and J. TOMMASI, “The use of representativity theory in the depletion calculations of SFR blanckets”, Nuclear Energy, vol. 101, pp. 429-433 (2017).
4. C. CARMOUZE et al. “MOx powders calculation improvments: criticality calculation in the context of OECD NEA benchmark”, Proc. of the Int. Nuclear
Fuel Cycle Conference, Seoul, Korea, (2017).
5. C. VENARD, A. SANTAMARINA et al., “The R.I.B.
tool for the determination of computational bias and associated uncertainty in the CRISTAL criticality-safety package”, Proc. of the Nuclear
Criticality-Safety Division Topical Meeting (NCSD), Richland
(WA), USA, (2009).
6. O. LERAY, C. VAGLIO-GAUDARD et al.,
“Sensitivity and uncertainty analysis applied to the JHR reactivity prediction”, Proc. Of the Int. Conf.
PHYSOR, Knoxville, USA, (2012).
7. N. DOS SANTO, P. BLAISE, et al., “A global approach of the representativity concept application on a high-conversion light water reactor MOx lattice case”, Proc. Of the Int. Conf. M&C, Paris, France, (2013).
8. A. SANTAMARINA et al., “The JEFF-3.1.1 nuclear data library”, JEFF Report 22, NEA/OECD, (2009).
9. R. SANCHEZ et al., “APOLLO2 year 2010”, Nuclear
Engineering and Technology, vol. 42, pp. 474-499,
2010.
10. A. SANTAMARINA, et al., “APOLLO2.8 : a validated code package for PWR neutronics calculations”, Proc. of the International Conference on
Advances in Fuel Management ANFM-IV, Hilton Head
Island, USA, (2009).
11. V. ORLOV et al., “Problems of fast reactor physics related to breeding”, Energy Review, vol. 4, pp. 991-1075, (1980).
12. P. ARCHIER et al., “COMAC: nuclear data covariance matrice library for reactor applications”, Proc. of the
International Conference of the Physics of Reactors
(PHYSOR), Kyoto, Japan, (2014).
13. N. TERRANOVA et al. “Covariance Matrix Evaluations for Independent Mass Fission Yields”,
Proc. Int. Workshop on Nuclear Data, Santa Fe (NM), USA, (2014).
14. B. ROQUE et al., “The French Post Irradiation
Examination Database for the Validation of Depletion Calculation Tools,” Proc. of Int. Conf. Nuclear Criticality Safety (ICNC), Tokai-Mura, Japan, (2003).