HAL Id: hal-02363343
https://hal.archives-ouvertes.fr/hal-02363343
Submitted on 30 Jan 2020HAL is a multi-disciplinary open access archive for the deposit and dissemination of sci-entific research documents, whether they are pub-lished or not. The documents may come from teaching and research institutions in France or abroad, or from public or private research centers.
L’archive ouverte pluridisciplinaire HAL, est destinée au dépôt et à la diffusion de documents scientifiques de niveau recherche, publiés ou non, émanant des établissements d’enseignement et de recherche français ou étrangers, des laboratoires publics ou privés.
Mass Spectrometry of Mitochondrial Membrane Protein
Complexes
Luc Negroni, Michel Zivy, Claire Lemaire
To cite this version:
Luc Negroni, Michel Zivy, Claire Lemaire. Mass Spectrometry of Mitochondrial Membrane Protein Complexes. Jean-Jacques Lacapère. Membrane protein structure and function characterization, 1635, Springer, pp.233-246, 2017, Methods in Molecular Biology, 9781493971497. �10.1007/978-1-4939-7151-0_12�. �hal-02363343�
Mass spectrometry of mitochondrial membrane protein complexes Luc Negroni 1,2, Michel Zivy3 and Claire Lemaire4*
1: CNRS-UMR5248, Université de Bordeaux, F-33000 Bordeaux, France. 2: IGBMC, CNRS-UMR 7104, F-67404 Illkirch.
3: CNRS, PAPPSO, UMR Génétique Quantitative et Evolution – Le Moulon, F-91191 Gif-sur-Yvette, France.
4: CNRS-UMR9198, CEA-IBITECS, Université Paris-Sud, I2BC, F-91191 Gif-sur-Yvette, France.
*Corresponding author
Summary
The ATP production (oxidative phosphorylation) involves five complexes embedded in the inner membrane of mitochondria. The yeast Saccharomyces cerevisiae is mainly used as a model for the study of oxidative phosphorylation; mutants are easy to produce and are still viable due to their ability to grow using the fermentation pathway. Here we present a process for analyzing mitochondrial respiratory complexes using native electrophoresis (BN-PAGE) coupled to LC-MS/MS. BN-PAGE (i) permits the separation of functional respiratory complexes, thus allowing in-gel activity detection of most of the respiratory complexes and (ii) provides convenient samples for bottom-up proteomics. Combining BN-PAGE and LC-MS/MS leads to the identification of the subunit composition of membrane complexes and offers the possibility to highlight potential interacting proteins.
Key Words:
S.cerevisiae; respiratory complexes; OXPHOS; BN-PAGE; mass spectrometry. 1. Introduction
The assembly of membrane oligomeric complexes is a difficult process to study by classical proteomic techniques, because of the physico-chemical characteristics of their subunits of which many display one or more transmembrane segments. These membrane complexes control essential biological processes such as energy transduction. In particular, mitochondrial oxidative phosphorylation, which produces ATP, the energy source of the cell, involves five respiratory complexes called also OXPHOS that are inserted in the inner mitochondrial membrane. In mammals, the complexes I (NADH dehydrogenase), II (Succinate dehydrogenase), III (Cytochrome bc1), IV (cytochrome c oxidase) and V (ATP synthase) are formed of 48, 4, 10, 11 and 17 subunits respectively, with many intrinsic membrane proteins. At the moment, we have a reasonable understanding of the structure and mechanism of action of these complexes (see 1 for review) but the way they are assembled is not completely understood. In man, defects in this process are responsible for many neuromuscular or generalized syndrome diseases (2).
With the exception of complex I, the respiratory complexes are conserved from Saccharomyces cerevisiae to man. The yeast Saccharomyces cerevisiae is thus an obvious choice for the study of the respiratory complexes because this organism can survive to a total respiratory deficiency, growing by fermentation. Previous studies have shown that the lack of one subunit often leads to the degradation of several other subunits of the same complex and induces the accumulation of assembly intermediates (3). The complexes also interact with each other, forming larger complexes associations called “supercomplexes” (4) that can be disrupted in mutants.
Here we present a strategy for the analysis of the complexes and supercomplexes of membrane proteins. The first step is a Blue Native-Polyacrylamide Gel Electrophoresis (BN-PAGE) that separates the complexes and the supercomplexes under native conditions (5). This technique gives an image of the assembly state of the different complexes and reveals the assembly intermediates (called sub-complexes) in mutants. Their composition was usually determined using two-dimensional BN/SDS gel electrophoresis in combination with western blot (6), a difficult and incomplete approach because of the absence of some specific antibodies.
We and others have shown that the tandem mass spectrometry LC-MS/MS is well adapted to the identification of mitochondrial proteins (7-10) including membrane proteins (11, 12). In this chapter, we present a strategy that combines one dimension BN-PAGE of mitochondrial proteins and LC/MS-MS. The complexes are stained by colloidal blue or revealed by in-gel activities, and the corresponding bands are cut and digested with trypsin or proteinase K. The peptides are then analyzed by nano-LC-MS/MS. This approach has been successfully applied in several studies on mitochondrial proteins (13, 14 and 15). Here we present the process we used to identify the composition of respiratory complexes II, III, IV and V in wild type strain and in one complex III mutant. It allows a rapid identification of most of the respiratory subunits present in the various complexes or supercomplexes and in assembly intermediates that accumulate in the mutant. Interestingly, we show that partial trypsin digestion and cyanogen bromide treatment improve significantly the peptide coverage of hydrophobic proteins and that 2D-LC-MS/MS allows a significant increase in the number of identified peptides versus 1D-LC-MS/MS.
2. Material 2.1. Equipment
1. Sample hydrolysis: Polypropylene 96 well microplates or polypropylene PCR 12 well tubes (0.2 mL) strips and corresponding storage Box holder (VWR International); Thermomixer (Eppendorf) and Modular Heating Blocks for microplates (VWV International); if large series of in-gel digestions are performed, the protocol can be easily adapted for automatic digestion with ProGest Protein Digestion Station (Genomic Solutions).
2. LC-MS/MS system: Ultimate LC: Famos autosampler / Switchos II / Ultimate (Dionex-LC Packings, France); nanospray ion trap mass spectrometer, LCQ XP Plus, (Thermo Electron); non-coated capillary probe (20 µm i.d., New Objective, Cambridge, USA).
3. Columns: Particil SCX cartridge (300 µm x 5 mm), PEPMAP100 C18 cartridge (300 µm x 5 mm); PEPMAP100 C18 Reverse phase (75 µm x 15 cm) from Dionex LC-Packings.
2.2. Buffers and media 2.2.1. Culture media
1. Medium 1: 1.25% (w/v) bacto yeast extract, 2.5% (w/v) bactopeptone. Weigh 5 g of bacto yeast extract and 10 g of bactopeptone. Complete to a volume of 400 mL with water. Autoclave at 120°C, 20 min.
2. 10% galactose: Weigh 10 g of galactose. Complete to a volume of 100 mL with water. Autoclave at 120°C, 20 min.
3. YPGAL medium: 1% (w/v) bacto yeast extract, 2% (w/v) bactopeptone, 2% (w/v) galactose. Just before use, mix 400 mL of medium 1 and 100 mL of 10% galactose. 4. Lactate medium: 0.5% (v/v) lactic acid, 0.75% (w/v) bacto yeast extract, 0.75% (w/v).
bactopeptone. Sample 5.9 mL of lactic acid. Add 800 mL of water. Adjust the pH to 4 with a solution of 10N KOH. Then add 7.5 g of bactopeptone and 7.5 g of bacto yeast extract. Check the pH to be 4.5. Add water to a volume of 1 L. Autoclave at 120°C, 20 min.
2.2.2. Preparation of mitochondria
1. Sorbitol buffer A: 1.2 M sorbitol, 50 mM Tris-HCl, pH 7.5, 10 mM ethylenediaminetetraacetic acid (EDTA), and 0.3% (v/v) 2-mercaptoethanol. Stored at 4°C.
2. Sorbitol buffer B: 0.7 M sorbitol, 50 mM Tris-HCl, pH 7.5, 0.2 mM EDTA. Stored at 4°C. 2.2.3. BN-PAGE for yeast respiratory complexes
1. Acrylamide/Bis solution: 40% solution 29:1.
2. Gel Buffer (3x): 1.5 M ε-amino-n-caproic acid and 150 mM Bis-Tris. The pH is adjusted to 7 with HCl at 4°C. The buffer is filtered on Millipore 0.45 µm.
3. PMSF 100 mM: weigh 17.4 mg of PMSF in 1mL of ethanol (see Note 1)
4. Ammonium persulfate: prepare a 10% (w/v) solution in water and store at 4°C for up to one month.
5. 5% acrylamide solution: Mix 625 µL of acrylamide:bis-acrylamide solution and 1.67 mL of gel buffer (x3). Complete to 5 mL with H2O. Add 3 µL of TEMED and 30 µL of 10% ammonium persulfate.
6. 10% acrylamide solution: Mix 1.3 mL of acrylamide:bis-acrylamide solution, 1.67 mL of gel buffer (x3) and 2 g of glycerol. Complete to 5 mL with H2O. Add 2.5 µL of TEMED and 25 µL of 10% ammonium persulfate.
7. Stacking gel (3%): Mix 375 µL of acrylamide: bis solution and 1.67 mL of gel buffer (x3). Complete to 5 mL with H2O. Add 5 µL of TEMED and 50 µL of 10% ammonium persulfate. 8. BN sample buffer: 750 mM ε-amino-n-caproic acid, 50 mM Bis-Tris and 0.5 mM EDTA. The
pH is adjusted to 7.0 with a concentrated HCl solution at 4°C. The buffer is filtered on
Millipore 0.45 µm filter. Then 5% (w/v) Serva Blue G-250 is added. The buffer is sonicated in a bath sonicator to solubilize the Serva Blue G-250.
9. Cathode buffer A: 15 mM Bis-Tris, 50 mM Tricine. The pH is adjusted to 7.0 with a
concentrated HCl solution at 4°C. The buffer is filtered on Millipore 0.45 µm filter. Then 0.02% (w/v) Serva Blue G-250 is added and the buffer is sonicated as the BN sample buffer.
10. Cathode buffer B: same as cathode buffer A except that no Serva Blue G-250 is added. 11. Anode buffer: 50 mM Bis-Tris. The pH is adjusted to 7.0 with a concentrated HCl solution at
4°C. The buffer is filtered on Millipore 0.45 µm filter.
12. Molecular weight markers: High Molecular Weight Calibration Kit for Native Electrophoresis (Amersham Biosciences).
2.2.4. In-gel activities
1. Reaction solution for complex cytochrome c oxidase activity:
In 9 mL phosphate buffer (0.05 M, pH 7.4) dissolve 5 mg of 3,3'-diaminobenzidine tetrahydrochloride (DAB) (see Note 2) and 10 mg of cytochrome c.
2. Reaction solution for complex complex V activity:
Pre-incubation solution: 270 mM glycine and 35 mM TRIS. Adjust the pH to 8.3.
Incubation solution: add 14 mM MgSO4, 0.2% (w/v) lead nitrate and 8mM ATP to the pre-incubation solution.
2.2.5. In-gel digestion
1. Destain buffer: 10% acetic acid, 50% methanol in distilled H2O. 2. Wash buffer: 50 mM NH4HCO3 (1M stock solution).
4. Alkylation solution: 40 mM iodoacetamide in 50 mM NH4HCO3. 5. Digestion buffer: 25 mM NH4HCO3, 20% methanol in distilled H2O. 6. Trypsin solution: 200 ng/µL diluted in 25 mM NH4HCO3.
7. Extracting buffer: 0.5% trifluoroacetic acid, 50% acetonitrile 2.2.6. LC-MS/MS
1. Sample buffer: 0.08% TFA, 0.02% heptafluorobutyric acid, 2% acetonitrile (see Note 3). 2. HPLC buffer A: 0.1% formic acid, 2% acetonitrile.
3. HPLC buffer B: 0.1% formic acid in 95% acetonitrile, 5% dH2O. 4. Ammonium acetate: 25, 50, 75, 100, 150, 200, 1000 mM. 3. Methods
3.1. Cell culture and preparation of yeast mitochondria
The protocol for sample preparation was presented in (16) and is the following:
1. Grow respiratory competent yeast (wt) in lactate medium and respiratory deficient strain (Δrip1) in YPGAL medium at 28 °C (see Note 4).
2. Harvest the cells in mid-exponential phase by centrifugation at 3000 g for 10 min at 4°C and wash with 10 mM EDTA.
3. Resuspend the cells in sorbitol buffer A at 3 mL/g wet mass of cells.
4. Digest cell walls enzymatically with Zymolase-100T at 1 mg/g of cells at 37°C for about 30 min (see Note 5).
5. Pellet the resulting spheroblasts by centrifugation at 1800 g, 15 min at 4°C.
6. Resuspend in ice-cold sorbitol buffer B (15 mL starting from a culture of 1 L) in order to break the spheroplasts by osmotic shock.
7. Eliminate the cell fragments by centrifugation at 2500 g, 15 min at 4°C. Keep the supernatant. 8. Pellet the mitochondria by centrifugation at 20000 g, 15 min at 4°C.
9. Resuspend the pellet of mitochondria in 4mL of ice-cold sorbitol buffer B containing protease inhibitors (EDTA-free cocktail from Boehringer Mannheim). Centrifuge at 800 g for 5 min at 4°C. Decant and centrifuge the supernatant at 15000 g for 15 min at 4°C. Resuspend the pellet in 4mL of ice-cold sorbitol buffer B. Repeat this cycle of two successive centrifugations twice. 3.2. BN-PAGE for yeast respiratory complexes
The protocols for mitochondria solubilisation and preparation of BN-PAGE were presented in (16) and are the following:
3.2.1. Solubilization of mitochondria
Respiratory complexes are solubilized either by lauryl-β-D-maltoside (DDM) in order to analyze the complexes individually or by digitonin (DG) to visualize the supramolecular organization of the complexes.
1. Prior to their solubilisation, treat the mitochondria with DNAse: resuspend in order to have a final concentration of mitochondria equal to 1 mg/mL, in gel buffer (x3) containing 1 mM PMSF, 0.2 mg/mL DNAse and 5 mM MgCl2.
2. Incubate the sample 30 min at 25°C.
3. Centrifuge the sample at 13000 g at 4°C during 15 min. Discard the supernatant.
4. Resuspend the pellet of mitochondria in gel buffer (x3) containing either 2% laurylmaltoside (w/v) or 2% digitonin (w/v) and incubate at 4°C during 30 min.
5. Centrifuge the sample at 100 000 g at 4°C during 30 min. Throw the pellet.
6. Add BN sample buffer in the supernatant in order to have a final concentration of 0.25% of Serva Blue G250.
7. Apply samples to the BN-PAGE or store them at -20°C before loading.
3.2.2. Preparation of BN-PAGE
1. Prepare a 5%-10% acrylamide gradient resolving gel in a 8 cm x 6.5 cm x 0.10 cm gel cassette.
2. Gels are polymerized at room temperature. After casting the gradient gel, the stacking gel is poured just after or one day after. In this latter case, the gradient gel is overlaid by water and wrapped to avoid desiccation, and kept at 4°C for one day maximum.
3. Load a 3% acrylamide stacking gel on the resolving gel. Then immediately insert a 10-well gel comb.
4. Load the samples in the wells: the volume of samples is calculated to have 25 μg of proteins/lane. After the loading of samples, completely fill the wells with cathode buffer A. 5. Perform electrophoresis at 4°C.
6. During the first electrophoresis period, cathode buffer is buffer A. Perform electrophoresis at 100 V constant during 1h then at 200 V constant during 1 h more.
7. During the second electrophoresis period, cathode buffer is buffer B. Perform electrophoresis at 200 V until the dye front has reached the bottom of the gel.
3.2.3. In gel activities
Part of the gel is used to detect in gel activities as follow (see Fig.1):
1. Cytochrome c oxidase activity (Cox): The gel is incubated in the reaction solution for 1 hour at room temperature. Then the reaction solution is discarded and substituted by water. The bands displaying cytochrome c oxidase activity appear brown-colored as the oxidized diaminobenzidine precipitates (see Fig.3). (see Note 6).
2. ATPase activity: Incubate the gel for 1 H to 2 H with 25 mL of pre-incubation solution and then overnight at room temperature with 25 mL of the incubation solution. The inorganic phosphate obtained by the hydrolysis of ATP forms a white precipitate (see Fig.3).
Another part of the gel is used to stain the protein complexes with colloidal blue and the corresponding bands are taken for digestion and mass spectrometry analysis (see Fig. 1) (see Note 7).
Figure1. BN PAGE for respiratory complexes. BN-PAGE for wt and mutant Δrip1 (Δ) mitochondria solubilized with either Lauryl-β -D- Maltoside (DDM) or Digitonin (DG) as detergent. Left: Colloidal Blue Staining (CBB 250); middle: Cox activity; right: ATPase activity. Bands 1 to 11 were cut for mass spectrometry analysis (protein identification is presented in Table 1).
Table 1. Identification of the respiratory complexes subunits separated by BN-PAGE after digitonin solubilisation (see figure 1)
Band wt Δrip1
1 15 ATPase (493), 6 bc1 (34), 4 Cox (15) 14 ATPase (218), 1 Cox (2) 2 8 bc1 (260), 10 Cox (95), 4 ATPase (44) - - - 3 7 bc1 (200), 7 Cox (28), 3 ATPase (30) - - -
4 13 ATPase (302), 5 bc1 (119) 13 ATPase (335), 5 bc1 (33), 1 Cox (4) 7 2 bc1 (110), 5 Cox (24), 2 ATPase (9) 2 bc1 (39), 9 Cox (37),1 ATPase (1) 8 8 Cox (44), 2 bc1 (31), 1 SDHase(1) 6 Cox (29), 2 bc1 (19)
9 10 Cox (97), 2 SDHase (7), 2 ATPase (3) - - - 10 3 SDHase (56), 1 DHase (32) 3 SDHase (26), 1 DHase(3)
11 - - - 7 bc1 (144), 3 ATPase (8), 2 Cox (4) For each band, the number of identified subunits is indicated and the number of the corresponding spectra is specified in brackets. The complexes detected with in gel activity (see Fig. 1) are indicated in bold. As a reminder, the total number of subunits for each complex is: DHase, 3; SDHase, 4; bc1, 10; Cox, 11 and ATPase, 17.
Band 7 contains also P19882 (HSP60), identified with more than 100 spectra.
3.3. In gel digestion of yeast respiratory complex (1 day protocol) (see Note 7)
2. All steps are under agitation. Use Thermomixer for heating and mixing. 3. Destain for 2 x 30 min with 200 µL destain solution.
4. Wash for 15 min with 200 µL wash solution.
5. Let gel pieces shrink for 15 min with 200 µL acetonitrile.
6. Reduce for 30 min with 200 µL reducing solution at room temperature. 7. Shrink for 15 min with 200 µL acetonitrile.
8. Alkylate for 30 min with 200 µL alkylation solution at room temperature in the dark. 9. Shrink 2 times for 15 min with 200 µL acetonitrile.
10. Put the strips holder on the ice and add about 100 µL/well trypsin (20 ng/µL in digestion buffer). Wait 10 min and put the strip holder back to the thermomixer for 6 h digestion at 37 °C. 11. Extraction 1: add 100 µL of extraction buffer, incubate 15 min. Transfer the liquid in a tube. 12. Extraction 2: add 100 µL of acetonitrile, incubate 15 min. Transfer the liquid in the tube. 13. Drying: two possibilities; either simply evaporate at room temperature overnight without
sealing, or use SpeedVac.
3.4. Systematic LC-MS/MS analysis of respiratory complexes 3.4.1. 1D-LC (see Note 11)
1. Dissolve peptide extract in sample buffer.
2. Inject 10 µL of sample at 7-15 µL/min during 2.5 min on pre-concentration C18 cartridge (300 µm i.d.).
3. Switch valve for analytical run at 200 nL/min on C18 column (75 µm i.d.): from 3 to 25 % B for 25 min.
4. Regenerate column with a step at 90 % B then re-equilibrate at 3 % B. 3.4.2. Mass spectrometry
1. Use data dependent analysis with a MS survey scan and n MS/MS scan of the most intense peaks. (n= 3 with LCQ Deca XP, n= 10 with LTQ orbitrap).
2. Exclude mono charged ions (+1) if trypsin. Do not exclude +1 if proteinase K is used. 3. Limit the redundancy with dynamic exclusion.
3.4.3. Data processing
1. Use complete genome database at http://www.uniprot.org/proteomes/ for the identification of whole proteins (see Note 12).
2. Set carboxymethylation (+57.05) as fixed modification.
3. Set methionine oxidation (+16.00), Ser and Thr phosphorylation (+79.98) as optional modifications.
4. Set False Discovery Rate threshold as 0.01 or set specific filter for the removal of false peptide identifications (With Bioworks 3.1: Xcorr up to 1.7, 2.1, 3 for +1, +2, +3 ions respectively and first rank candidate only).
Count MS/MS spectra for quantitative comparison (see Table 1) (see Note 13). 3.5. Improvement of protein identification for membrane proteins
The membrane nature of respiratory complex subunits is a problem for their identification. In complex IV, for example, eight of the eleven subunits display one to twelve transmembrane domains, and tryptic peptides, especially for Cox1p and Cox3p, are scarcely detected. This problem can be solved by performing partial trypsin digestion or chemical hydrolysis with CNBr. Introducing a strong cation exchange chromatography upstream of the reverse phase chromatography also increases the number of identified peptides.
3.5.1. Partial digestion with trypsin (see Note 14) (see Fig. 2) 1. Use the same protocol as trypsin (see 3.3).
2. Incubation is stopped with the addition of the extraction buffer. For trypsin, the pH of the extraction buffer (<3) stops the hydrolysis.
3. Digestion time length depends on the laboratory. In ours hands, partial trypsin digestion was optimal with a 30 min incubation.
3.5.2. CNBr cleavage (see Notes 15 and 16) (see Fig. 2) When realized on dried gel sample (see Note 17):
1. Add 30µL CNBr 20 mg/mL in HCl 0.1N. 2. Incubate 4h in the dark.
3. Dry with SpeedVac (see Note 18).
4. Extract peptides as previously described in 3.3.
Note that it is also possible to perform CNBr cleavage after a digestion with trypsin as presented in Fig. 2.
Figure2. Cox subunits identification depending on hydrolysis methods. Left: peptides identified with
tryptic digestion 6h (black), partial digestion (white) and Trypsin-CNBr (red bar). The membrane subunits are indicated by *. Note that Cox 1p and Cox3p contain 12 and 7 transmembrane domains, respectively. The sequence coverage is indicated for each subunit. Right: Cox 1p sequence: cleavage sites for trypsin (@); cleavage site for CNBr (M); transmembrane domains ( ); identified peptides (green). Trypsin alone allows generation of one peptide, CNBr of a second one and the association of trypsin and CNBr of a third one.
The total sequence coverage is specified for each subunit.
3.5.3. 2D-LC chromatography
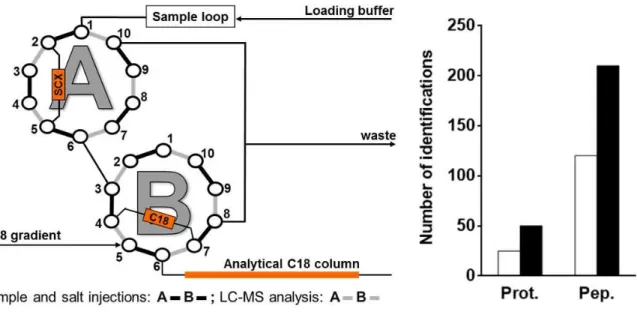
1. The assembly of chromatography columns on valves is presented in Fig.3. 2. Use 0.15% TFA, 3% ACN as loading buffer for SCX.
3. SCX elution is carried out with injections by the sample loop (20µL) of increasing concentration of ammonium acetate: 0, 25, 50, 75, 100, 150, 200, 1000 mM (see Notes 19 and 20).
4. Position of the valves for sample loading and salt injections on SCX is A1-2 and B1-2 (see Fig. 3). Flow-rate 7 µl/min, 5 min.
5. Position of valves for LC (C18)-MS analysis is A1-10 and B1-10, 200 nl/min, 45 min as described for 1D-LC-MS.
Figure 3. 2D-LC chromatography. Left: valve mounting for online 2D-LC-MS/MS; right: As an example,
the number of proteins (prot.) and peptides (pep.) of respiratory BN-PAGE band 9 identified with 1D-LC (white) or 2D-LC (black).
3.6. Conclusion
The combination of one-dimension BN-PAGE and LC-MS/MS allows the determination of the subunit composition of membrane complexes, supercomplexes and subcomplexes and the comparison between wild type and mutant strains.
BN-PAGE presents the major interest to conserve biochemical activities and interactions between partners. It thus allows multiple detections such as protein staining, revelation of in-gel activities
as well as Western blot analysis. Moreover the use of adequate detergent allows the detection of separated complexes or interacting complexes.
The complementarity of the techniques (i.e. BN-PAGE and mass spectrometry) allows an unambiguous cross-validation of the identifications. For example, this approach allowed the validation of the interactions between bc1 and Cox complexes (see bands 2&3, Table 1). Moreover, spectral counting provides interesting information about the composition of supercomplexes. For example, bands 2 and 3 contain both bc1 and Cox supercomplexes but complex ratio (bc1/Cox) is higher in band 3 (7 versus 2.7) as shown by spectral counts. This is in agreement with the fact that band 2 could correspond to a supercomplex of a bc1 dimer associated with two Cox monomers and band 3 to a supercomplex of a bc1 dimer in interaction with only one Cox monomer.
In conclusion, the association of BN-PAGE and mass spectrometry is an analytical tool allowing an exhaustive study of membrane complexes. It can be scaled up for systematic analysis allowing rapid screening of well-known complexes like the respiratory complexes and may thus be applied to the characterization of mitochondrial pathologies. It provides also interesting information on the identification of potential partners that must be then verified by other approaches such as MS analysis of immunoprecipitated complex. BN-PAGE associated to LC-MS/MS has been successfully applied in several laboratories (13, 14, and 15). Here we show in addition that peptide coverage of membrane proteins can be significantly enhanced (i) by modulating the enzymatic digestion time by trypsin, to increase the length of generated peptides (ii) by adding a chemical treatment with CNBr, to provide a diversification of the generated peptides, (iii) by introducing a strong cation exchange chromatography upstream of the reverse phase chromatography.
4. Notes
1. PMSF is added in buffer just before its use; its stability in aqueous buffer solutions doesn't exceed 1h.
2. Be careful, DAB may act as a carcinogen.
3. TFA and HBFA can be substituted with formic acid 0.1%, a less efficient counter ion for reverse phase chromatography.
4. Cells were grown in liquid medium with shaking (130 rpm) at 28°C in a Multitron standard incubator (Infors).
5. The enzymatically cell wall digestion is followed by measurement of OD at 600nm, until it reaches 10% of the initial value.
6. The coloration will intensify and appear with a better contrast if the gel is soaked in water during the night at 4°C.
7. Digestion and LC-MS/MS analysis can be carried out on bands stained with colloidal blue or detected for activities with the same efficiency.
8. In gel digestion is widely used for proteomics; acetonitrile contracts the gel for salt and detergent removal, and bicarbonate is used as volatile buffer for pH adjustment prior reduction, alkylation and trypsin digestion.
9. In-gel samples can be stored in tubes strip or microplate without liquid during several weeks at 4°C.
10. Each band is analyzed at least in three replicates. 11. A complete run lasts 45 min.
12. For identification of respiratory complexes subunits only, a convenient solution is to query MS/MS spectra on a database restricted to respiratory subunits (110 proteins). However the risk of false identifications increases and more stringent criteria than FDR should be used (by example a minimum of 2 identified peptides).
13. Other more sophisticated label free quantitation can be performed with the same set of data (i.e. based on MS ion intensity).
14. Proteinase K is an alternative to trypsin, to be used with the same buffers as trypsin. But without specific cleavage, the digestion time must be carefully adjusted in order to prevent a complete digestion of the proteins, leading to di- or tri-amino acids peptides.
15. Warning. CNBr reagent is highly toxic and produces volatile and lethal product as cyanide under acidic conditions. Use an extractor hood for manipulation and manage the waste in a dedicated can.
16. CNBr modifies Methionine as homoserine and homoserine lactone. For database query, optional modification for M is -29.99 and -48.00, respectively.
17. If liquid sample is used, add an equal volume of CNBr 40 mg/mL in HCl 0.1N.
18. Special care with condensed vapors: the cool trap must be empty in a dedicated trash bin prefilled with few ml of a NaOH solution.
19. Different salts were tested: potassium chloride, sodium chloride, ammonium chloride and ammonium acetate. The most efficient was ammonium acetate.
20. With Partisil SCX cartridge, most of the peptides are eluted below 100 mM salt.
Acknowledgments:
We gratefully acknowledge Alain Guillot for updates made to the technical points and for critical reading of the manuscript.
References
1. Sazanov, L.A. (2015) A giant molecular proton pump: structure and mechanism of respiratory complex I. Nature Reviews Molecular Cell Biology 16, 375–388.
2. Zeviani, M., Di Donato, S., (2004) Mitochondrial disorders. Brain : a journal of neurology 127, 2153-2172.
3. Marsy,S., Frachon, P., Dujardin, G., Lombès, A. and Lemaire, C. (2008) Respiratory mutations lead to different pleiotropic effects on OXPHOS complexes in yeast and in human cells. Febs Lett., 582, 3489-3493.
4. Schagger, H., Pfeiffer, K., (2000) Supercomplexes in the respiratory chains of yeast and mammalian mitochondria. The EMBO journal , 19, 1777-1783.
5. Schagger, H.,(2001) Blue-native gels to isolate protein complexes from mitochondria. Methods in cell biology, 65, 231-244.
6. Antonicka, H., Ogilvie, I., Taivassalo, T., Anitori, R. P., et al., Identification and
characterization of a common set of complex I assembly intermediates in mitochondria from patients with complex I deficiency. J Biol Chem 2003, 278, 43081-43088.
7. Devreese, B., Vanrobaeys, F., Smet, J., Van Beeumen, J., Van Coster, R., (2002) Mass spectrometric identification of mitochondrial oxidative phosphorylation subunits separated by two-dimensional blue-native polyacrylamide gel electrophoresis. Electrophoresis, 23, 2525-2533.
8. Sickmann, A., Reinders, J., Wagner, Y., Joppich, C., et al., (2003) The proteome of Saccharomyces cerevisiae mitochondria. Proc Natl Acad Sci U S A, 100, 13207-13212. 9. Sun, G., Kinter, M. T., Anderson, V. E., (2003) Mass spectrometric characterization of
mitochondrial electron transport complexes: subunits of the rat heart ubiquinol-cytochrome c reductase. Journal of mass spectrometry, 38, 531-539.
10. Taylor, S. W., Fahy, E., Zhang, B., Glenn, G. M., Warnock, D.E., Wiley, S., Murphy, A.N., Gaucher, S.P., Capaldi, R.A., Gibson, B.W,, Ghosh, S.S.(2003) Characterization of the human heart mitochondrial proteome. Nat Biotechnol, 21, 281-286.
11. Fandino, A. S., Rais, I., Vollmer, M., Elgass, H., et al., (2005) LC-nanospray-MS/MS analysis of hydrophobic proteins from membrane protein complexes isolated by blue-native electrophoresis. Journal of mass spectrometry, 40, 1223-1231.
12. Pflieger, D., Le Caer, J. P., Lemaire, C., Bernard, B. A., Dujardin, G. and Rossier J. (2002) Systematic identification of mitochondrial proteins by LC-MS/MS. Anal Chem, 74, 2400-2406 13. Helbig, A.O., de Groot, M.J., van Gestel, R.A., Mohammed, S., de Hulster, E.A., Luttik,
M.A., Daran-Lapujade, P., Pronk, J.T., Heck, A.J., Slijper, M. (2009) A three-way proteomics strategy allows differential analysis of yeast mitochondrial membrane protein complexes under anaerobic and aerobic conditions. Proteomics, 9, 4787-98
14. Mick, D.U., Dennerlein, S., Wiese, H., Reinhold, R., Pacheu-Grau, D., Lorenzi,
I., Sasarman, F., Weraarpachai ,W., Shoubridge, E.A., Warscheid, B., Rehling, P. (2012) MITRAC links mitochondrial protein translocation to respiratory-chain assembly and translational regulation. Cell. 151, 1528-41.
15. Bareth, B., Dennerlein, S., Mick, D.U., Nikolov, M., Urlaub, H., Rehling, P. (2013) The heme a synthase Cox15 associates with cytochrome c oxidase assembly intermediates during Cox1 maturation. Mol Cell Biol. 33, 4128-37.
16. Lemaire, C., Dujardin, G. (2008) Preparation of respiratory chain complexes from Saccharomyces cerevisiae wild-type and mutant mitochondria : activity measurement and subunit composition analysis. Methods Mol Biol, 432, 65-81.