HAL Id: pasteur-02865346
https://hal-pasteur.archives-ouvertes.fr/pasteur-02865346
Preprint submitted on 11 Jun 2020HAL is a multi-disciplinary open access
archive for the deposit and dissemination of sci-entific research documents, whether they are pub-lished or not. The documents may come from teaching and research institutions in France or abroad, or from public or private research centers.
L’archive ouverte pluridisciplinaire HAL, est destinée au dépôt et à la diffusion de documents scientifiques de niveau recherche, publiés ou non, émanant des établissements d’enseignement et de recherche français ou étrangers, des laboratoires publics ou privés.
Copyright
natural control of SIV. ANRS SIC study.
Caroline Passaes, Antoine Millet, Vincent Madelain, Valerie Monceaux, Annie
David, Pierre Versmisse, Naya Sylla, Emma Gostick, David Price, Antoine
Blancher, et al.
To cite this version:
Caroline Passaes, Antoine Millet, Vincent Madelain, Valerie Monceaux, Annie David, et al.. Optimal maturation of the SIV-specific CD8 + T-cell response after primary infection is associated with natural control of SIV. ANRS SIC study.. 2020. �pasteur-02865346�
1
Optimal maturation of the SIV-specific CD8+ T-cell response after primary infection
1
is associated with natural control of SIV.
2
ANRS SIC study
3 4
Caroline Passaes1,2, Antoine Millet3, Vincent Madelain4, Valérie Monceaux1, Annie David1,
5
Pierre Versmisse1, Naya Sylla2, Emma Gostick5, David A. Price5, Antoine Blancher6,7, Nathalie
6
Dereuddre-Bosquet2, Gianfranco Pancino1, Roger Le Grand2, Olivier Lambotte2,8, Michaela
7
Müller-Trutwin1, Christine Rouzioux3,9, Jeremie Guedj4, Veronique Avettand-Fenoel3,9, Bruno
8
Vaslin2#,*, Asier Sáez-Cirión1#,*
9 10
1 Institut Pasteur, HIV Inflammation and Persistence. Paris 75015; France. 11
2 CEA-Université Paris Sud-INSERM, UMR1184 ‘Immunology of Viral Infections and Autoimmune Diseases’-12
IDMIT Department, IBFJ, Fontenay-aux-Roses, France. 13
3 Université Paris-Descartes, Sorbonne Paris Cité, Faculté de Médecine, EA7327, Paris, France. 14
4 IAME, UMR 1137, INSERM, Université Paris Diderot, Sorbonne Paris Cité Paris, France. 15
5 Cardiff University School of Medicine, Division of Infection and Immunity, Cardiff, UK. 16
6 Laboratoire d'Immunogénétique Moléculaire, EA 3034, Université Paul Sabatier, Toulouse 3, France. 17
7 Laboratoire d'Immunologie, CHU de Toulouse, Toulouse, France. 18
8Assistance Publique-Hôpitaux de Paris, Service de Médecine Interne et Immunologie Clinique, Groupe 19
Hospitalier Universitaire Paris Sud, Hôpital Bicêtre, Le Kremlin-Bicêtre, France 20
9Assistance Publique-Hôpitaux de Paris, Service de Microbiologie Clinique, Hôpital Necker-Enfants Malades, 21
Paris, France 22
23
#These authors contributed equally to this work. 24
*Correspondence: asier.saez-cirion@pasteur.fr or bruno.vaslin@cea.fr
25 26
2 ABSTRACT
27
Highly efficient virus-specific CD8+ T-cells are associated with immune control of HIV
28
infection, but it remains unclear how these cells are generated and maintained over time.
29
We used a macaque model of spontaneous control of SIVmac251 infection to monitor the
30
development and evolution of potent antiviral CD8+ T-cell responses. SIV-specific CD8+
T-31
cells emerged during primary infection in all animals. However, the ability of CD8+ T cells to
32
suppress SIV replication was low in early stages but increased after a period of maturation,
33
temporally linked with the establishment of sustained low-level viremia in controller
34
macaques. SIV-specific CD8+ T-cells with a central memory phenotype expressed higher
35
levels of survival markers in controllers versus non-controllers. In contrast, a persistently
36
skewed differentiation phenotype was observed among central memory SIV-specific CD8+
T-37
cells in non-controllers since primary infection, typified by relatively high expression levels of
38
T-bet.
39
Collectively, these data show that the phenotype of SIV-specific CD8+ T-cells defined early
40
after SIV infection favor the gain of antiviral potency as a function of time in controllers,
41
whereas SIV-specific CD8+ T-cell responses in non-controllers fail to gain antiviral potency
42
due to early defects imprinted in the central memory pool.
3 INTRODUCTION
44
The ability of CD8+ T-cells to control viral replication has been extensively documented in the
45
setting of HIV/SIV infection (McBrien et al., 2018; Walker and McMichael, 2012). Primary
46
infection is characterized by massive viremia, which subsides following the expansion of
47
HIV/SIV-specific CD8+ T-cells (Borrow et al., 1994; Koup et al., 1994). However, the virus is
48
not eradicated, leading to the emergence of immune escape variants (Allen et al., 2000;
49
Borrow et al., 1997; O'Connor et al., 2002; Price et al., 1997) and to CD8+ T-cell exhaustion
50
during the chronic phase of infection (Day et al., 2006; Petrovas et al., 2006; Petrovas et al.,
51
2007; Trautmann et al., 2006). These observations suggest that naturally generated
HIV/SIV-52
specific CD8+ T-cells are frequently suboptimal in terms of antiviral efficacy, potentially
53
reflecting limited cross-reactivity and/or intrinsic defects in the arsenal of effector functions
54
required to eliminate infected CD4+ T-cells (Du et al., 2016; Lecuroux et al., 2013). The latter
55
possibility is especially intriguing in light of ex vivo experiments showing that effective
56
suppression of viral replication is a particular feature of CD8+ T-cells isolated from HIV
57
controllers (HICs) (Angin et al., 2016; Saez-Cirion et al., 2007; Saez-Cirion et al., 2009; Tansiri
58
et al., 2015).
59 60
HICs are a rare group of individuals who control viremia to very low levels without
61
antiretroviral therapy (Saez-Cirion and Pancino, 2013). Understanding the mechanisms
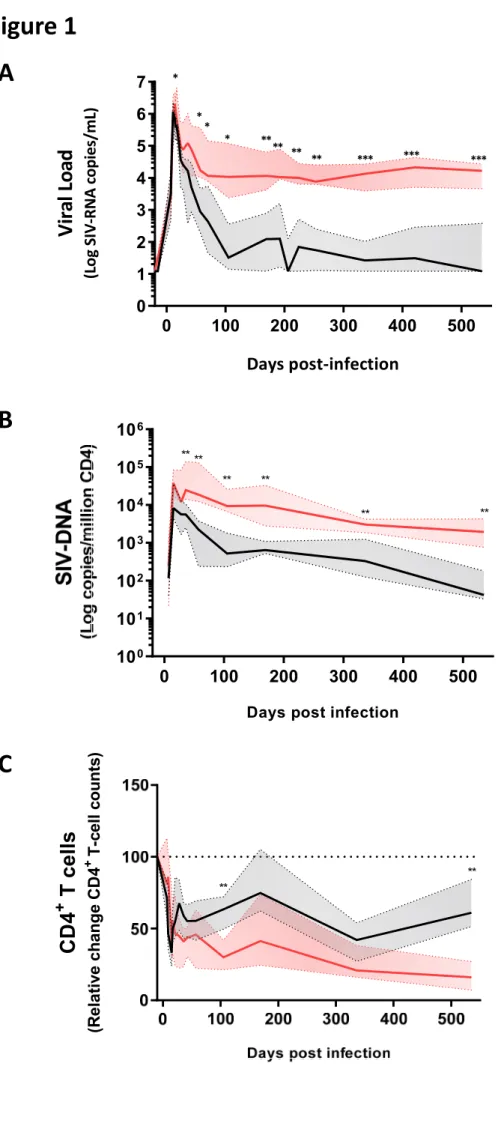
62
associated with such spontaneous control of HIV infection seems crucial for the
63
development of new strategies designed to achieve remission. Efficient CD8+ T-cell
64
responses are almost universally present in HICs (Betts et al., 2006; Chowdhury et al., 2015;
65
Hersperger et al., 2011a; Hersperger et al., 2010; Migueles et al., 2002; Migueles et al., 2008;
66
Saez-Cirion et al., 2007; Saez-Cirion et al., 2009; Zimmerli et al., 2005). These individuals also
4
frequently express the protective human leukocyte antigen (HLA) allotypes HLA-B*27 and
68
HLA-B*57, further supporting a key role for CD8+ T-cells in the natural control of HIV
69
(Lecuroux et al., 2014; Migueles et al., 2000; Pereyra et al., 2008). However, the presence of
70
protective HLA alleles is neither sufficient nor necessary for natural control of infection, and
71
HICs carrying non-protective HLA class I alleles also carry CD8+ T-cells with strong HIV
72
suppressive capacity (Lecuroux et al., 2014). Although the qualitative properties of CD8+
T-73
cells from HICs have been extensively characterized, these analyses have been essentially
74
performed during chronic infection, when viremia was already under control, often several
75
years after the acquisition of HIV. It therefore remains unclear how these high-quality CD8+
76
T-cell responses develop from the early stages of infection and evolve over time.
77 78
Cynomolgus macaques (CyMs, Macaca fascicularis) infected with SIVmac251 closely
79
recapitulate the dynamics and key features of HIV infection, including similar levels of viral
80
replication in the acute and chronic phases of infection, memory CD4+ T-cell depletion, rapid
81
seeding of the viral reservoir, and eventually progression to AIDS with diarrhea, weight loss,
82
high incidence of lymphoblastic lymphomas and marked decrease of CD4+ T cells within 145
83
to 464 days post-infection (Antony and MacDonald, 2015; Feichtinger et al., 1990; Karlsson
84
et al., 2007; Mannioui et al., 2009; Putkonen et al., 1989). As in humans, some individuals
85
control infection naturally in the absence of treatment. CyMs from Mauritius offer the
86
additional advantage of limited MHC diversity, making them particularly attractive for the
87
study of CD8+ T-cell responses. Indeed, natural SIV control in Mauritius CyMs is favored by
88
the presence of the MHC haplotype M6 (Aarnink et al., 2011; Mee et al., 2009). Natural SIV
89
control can be also achieved in CyMs inoculated with a relatively low virus dose exposure
90
through the intra rectal route (i.r.), independent of their MHC haplotype (Bruel et al., 2015).
5
We therefore took advantage of these validated CyM models spreading from natural SIV
92
control to progression to AIDS to study the dynamics of SIV-specific CD8+ T-cell responses in
93
blood and tissues from the onset of infection in both SIV controllers and viremic macaques.
94
Using this approach, we identified an optimal maturation pathway that enabled SIV-specific
95
CD8+ T-cells to acquire potent antiviral functions, control viremia, and survive in SICs.
96 97
6 RESULTS
98
SIV controllers are characterized by partial restoration of CD4+ T-cell counts and
99
progressive decline in the frequency of SIV-carrying cells in blood
100
We monitored prospectively the outcome of infection in 12 SIV controllers (SICs) and 4
101
viremic CyMs (VIRs) inoculated i.r. with SIVmac251. These animals carried or not the
102
protective M6 haplotype and were inoculated with 5 or 50 animal infectious dose50 (AID50) of
103
SIVmac251 (Supplemental Table 1). SIV controllers decreased plasma viral load (VL) to levels
104
below 400 SIV-RNA copies/mL, at least twice, over a follow up period of 18 months, while
105
VIRs consistently maintained VL above 400 SIV-RNA copies/mL. The threshold of 400 RNA
106
copies/mL was chosen in coherence with our studies in human cohorts of natural HIV control
107
(Angin et al., 2016; Noel et al., 2016; Cirion et al., 2013; Cirion et al., 2007;
Saez-108
Cirion et al., 2009). Ten SICs achieved control of viremia within 3 months. The other two SICs
109
(BL669 and BO413) achieved VL below 400 SIV-RNA copies/mL for the first time 14 months
110
after inoculation. One VIR CyM (AV979) developed a tonsilar lymphoma, an AIDS related
111
event reported at high frequency in this species upon SIV infection (Feichtinger et al., 1990).
112 113
Some differences in peak viremia were observed between SICs and VIRs (Figure 1A, Table 1).
114
These differences became more pronounced over time (Figure 1A), because plasma viremia
115
was suppressed more rapidly in SICs versus VIRs (Table 1). Levels of cell-associated SIV-DNA
116
in blood from SICs and VIRs were comparable before peak viremia, but differences became
117
apparent as plasma VLs declined and were maintained throughout chronic infection (Figure
118
1B, Table 1). In addition, CD4+ T-cell counts declined markedly in blood from both SICs and
119
VIRs during primary infection (Figure 1C, Table 1). Subsequently, a degree of recovery was
120
observed in SICs, whereas further gradual decline was observed in VIRs (Figure 1C, Table 1).
7 122
These results evidenced the distinctive dynamics of SIV infection in SICs and VIRs,
123
characterized by very modest differences during the early weeks following inoculation that
124
were progressively exacerbated during transition to chronic infection. The differences
125
between SICs and VIRs during the chronic phase of SIV infection were consistent with the
126
observations in human cohorts of HIV controllers.
127 128
SIV control is associated with early preservation of lymph nodes
129
To characterize the extent of SIV control in greater depth, we monitored CD4+ T-cells and
130
total SIV-DNA longitudinally in peripheral lymph nodes (PLNs) and rectal biopsies (RBs). At
131
the end of the study, we conducted similar evaluations in bone marrow, spleen, mesenteric
132
lymph nodes (MLNs), and colonic mucosa, comparing SICs versus VIRs. The frequency of
133
CD4+ T-cells similarly declined in RBs from both SICs and VIRs during the acute stage of
134
primary infection. While the frequency of CD4+ T-cells was later partially restored in SICs, it
135
continued to decline in VIRs (Figure 2A). These results matched the observations in blood
136
samples (Figure 1B). In contrast, the frequency of CD4+ T-cells was maintained close to
137
baseline in PLNs from SICs, even during primary infection (day 14 post-infection [p.i.]), but
138
steadily declined over time in VIRs (Figure 2B). At the time of euthanasia, CD4+ T-cell
139
frequencies were substantially higher in blood (Figure 1C), bone marrow, spleen, PLNs,
140
MLNs, and colonic mucosa (Figure 2C) from SICs versus VIRs.
141 142
Cell-associated SIV-DNA levels closely mirrored the dynamics of CD4+ T-cells. Similarly high
143
levels of cell-associated SIV-DNA were observed in RBs from SICs and VIRs during primary
144
infection, but lower levels were observed in RBs from SICs versus VIRs during chronic
8
infection (Figure 2D). Of note, SIV-DNA levels were already approximately 1 log lower in
146
PLNs versus RBs from SICs during primary infection, and accordingly, lower levels were
147
observed in PLNs from SICs versus VIRs since day 14 p.i. (Figure 2E). This finding suggests
148
that early viral replication may be contained more efficiently in lymphoid nodes in SICs
149
compared with other explored anatomical compartments. Moreover, SIV-DNA was also
150
detected in alveolar macrophages from all CyMs throughout the course of infection, again at
151
lower levels in SICs versus VIRs during chronic infection (Figure S1A, bottom panel). In
152
addition, SIV-DNA levels trended to decline progressively over time in SICs in all tissues
153
analyzed, whereas SIV-DNA levels remained stable after primary infection in VIRs (Figure 1B,
154
2D-F). At the time of euthanasia, SIV-DNA levels were substantially lower in blood (Figure
155
1B), bone marrow, PLNs, MLNs, and gut mucosa (Figure 2F and Figure S1B) from SICs versus
156
VIRs.
157 158
Collectively, these data indicate that progressive systemic control of viral replication is
159
achieved in SICs with CD4+ T-cell preservation and lower pan-anatomical reservoirs of
SIV-160
DNA. Our results also underline the early preservation of PLNs in these animals.
161 162
The dynamics of CD8+ T-cells expansion and activation do not predict control of SIV 163
To understand the mechanisms that contribute to immune control of SIV, we first monitored
164
the proliferation and activation dynamics of total CD8+ T-cells in blood and lymphoid tissues
165
from SICs and VIRs. Recent studies in cohorts of hyperacute HIV infected individuals indicate
166
that the changes observed in the total CD8+ T-cell activation during acute infection may be
167
largely related to changes in the HIV-specific CD8+ T-cell pool (Ndhlovu et al., 2015; Takata et
168
al., 2017). The frequencies of CD8+ T-cells expressing Ki-67 in blood increased to maximum
9
levels during primary infection (measured peak at day 15 p.i.), coinciding with the measured
170
peak of viremia, then declined steadily to baseline levels during chronic infection (Figure 3A).
171
Similar dynamics were observed in PLNs (Figure 3B) and gut mucosa (Figure 3C). In general,
172
there were no significant differences between SICs and VIRs with respect to the dynamics of
173
Ki-67 expression within the CD8+ T-cell pool, although lower frequencies of CD8+ T-cells
174
expressing Ki-67 were observed during chronic infection in PLNs from SICs versus VIRs
175
(Figure 3B).
176 177
The frequencies of CD8+ T-cells expressing the activation markers CD38 and HLA-DR in blood,
178
PLNs, and gut mucosa increased similarly during primary infection (measured peak at day 28
179
p.i.), following the dynamics of Ki-67 expression in the same compartments (Figure 3D–F).
180
Again, there were no significant differences between SICs and VIRs with respect to the early
181
dynamics of total CD8+ T-cell activation, but lower frequencies of CD8+ T-cells expressing
182
CD38 and HLA-DR were observed during chronic infection in PLNs from SICs versus VIRs
183
(Figure 3E).
184 185
Overall, our findings indicate that although lower activation and proliferation is observed in
186
of CD8+ T-cells from SICs than VIRs in the chronic stage of infection, the early proliferation
187
and activation dynamics of the total pool of CD8+ T-cells do not distinguish subsequent
188
progression rates.
189 190
SIV-specific CD8+ T-cell frequencies do not predict control of SIV 191
In parallel experiments, we analyzed CD8+ T-cell responses to a pool of optimal SIVmac251
192
peptides, which included peptides from different SIV proteins recognized by the most
10
frequent MHC haplotypes in CyMs (M1, M2 and M3) and by the MHC haplotype M6
194
(Supplemental Table 2). All the animals carried at least one haplotype matching some
195
peptide, and overall there was not difference in the number of peptides tested theoretically
196
recognized in controllers and non-controllers (p=0.35). SIV-specific CD8+ T-cells producing
197
TNFα (cytokine showing the lowest background in the absence of peptide or in presence of
198
peptide during the baseline and hence used as reference) emerged in all CyMs during
199
primary infection, coinciding with the peak of viremia, and no significant differences were
200
observed between SICs and VIRs with respect to the frequencies of these cells in any
201
anatomical compartment at any stage of infection (Figure 4A). Similarly, no consistent
202
differences were observed between SICs and VIRs with respect to the frequencies of
SIV-203
specific CD8+ T-cells that produced other cytokines, including IFNγ (Figure S2A and S3A) and
204
IL-2 (Figure S2B and S3B), or mobilized CD107a (Figure S2C and S3C). The overall SIV-specific
205
CD8+ T-cell response, determined in each CyM as the frequency of cells displaying at least
206
one function (TNFα, IFNγ, IL-2, or CD107a), was also equivalent between SICs and VIRs
207
across anatomical compartments during primary and chronic infection (Figure S2D and S3D).
208
In addition, no clear differences between SICs and VIRs were observed with respect to the
209
frequencies of SIV-specific CD8+ T-cells displaying at least three functions simultaneously in
210
blood or PLNs during acute infection, but higher frequencies of polyfunctional SIV-specific
211
CD8+ T-cells were present during chronic infection in lymphoid tissues from SICs versus VIRs
212
(Figure 4B and S4). Of note, no differences in the magnitude (Figure S5A) and polyfunction
213
(Figure S5B) of SIV-specific CD8+ T-cells from SICs and VIRs were observed either when a pool
214
of overlapping peptides spanning SIV Gag was used instead of the optimal peptide pool to
215
stimulate the cells.
216 217
11
These data suggest that natural control of SIV is not associated with acutely generated,
218
functionally superior SIV-specific CD8+ T-cell responses, defined on the basis of cytokine
219
production and degranulation.
220 221
Progressive acquisition of CD8+ T-cell-mediated SIV-suppressive activity is associated with 222
control of SIV
223
CD8+ T-cells from HICs typically suppress ex vivo infection of autologous CD4+ T-cells (Angin
224
et al., 2016; Buckheit et al., 2012; Julg et al., 2010; Saez-Cirion et al., 2007; Saez-Cirion et al.,
225
2009; Tansiri et al., 2015). We therefore investigated this property as a potential
226
discriminant between SICs and VIRs. The capacity of CD8+ T-cells in blood and PLNs to
227
suppress infection of autologous CD4+ T-cells was relatively weak in all CyMs during acute
228
infection (Figure 5A), but remarkably, this activity correlated negatively with viremia on day
229
15 p.i. (Figure 5B, upper panel) suggesting its contribution to control viremia since early time
230
points. Interestingly, the CD8+ T-cell-mediated SIV-suppressive activity increased
231
substantially over time in SICs (Figure 5A and S6), either in blood or tissues. No such
232
acquisition of SIV-suppressive activity was observed in VIRs (Figure 5A and S6). Moreover,
233
CD8+ T-cell-mediated SIV-suppressive activity on day 70 p.i. correlated negatively (or trended
234
to correlate) with all subsequent determinations of plasma VL (Figure S7) and there was a
235
negative correlation between the CD8+ T-cell-mediated SIV-suppressive activity at
236
euthanasia and the viremia at this time (Figure 5C, upper panel). In contrast, no significant
237
correlations were identified at any time point between SIV-specific CD8+ T-cell frequencies,
238
categorized according to TNFα production in response to SIV peptides, and measurements
239
of plasma VL (Figure 5B-C, bottom panels). Moreover, CD8+ T-cell-mediated SIV-suppressive
240
activity across the entire follow-up period, quantified as area under the curve, trended to
12
correlate negatively with plasma VL (rs = –0.47, p = 0.07), whereas no such association was
242
identified for the frequency of SIV-specific CD8+ T-cells (rs = –0.01, p = 0.97) (Figure 5D).
243 244
In a complementary study, Madelain et al (submitted) developed a mathematical model to
245
fit the longitudinal SIV RNA data in this cohort of animals. The best fit to the data was
246
obtained by using a model including an immune-response-mediated infected-cell elimination
247
compartment where the loss rate of productively infected cells increased over time.
248
Interestingly, the pattern of increase in cell loss rates (based on the analysis of SIV RNA only)
249
nicely matched in most animals the changes in the capacity of CD8+ T-cells to suppress
250
infection that were obtained experimentally. Moreover, a post hoc positive correlation was
251
found between the theoretical immune-response-mediated infected-cell elimination rate
252
and the experimental CD8+ T-cell-mediated SIV-suppressive activity, but not with the
253
frequency of SIV-specific CD8+ T-cells.
254
255
Therefore, our results exposed a disconnection between the development of SIV-specific
256
CD8+ T-cells producing cytokines and cytolytic molecules and the ability of these cells to
257
suppress SIV infection, as measured ex vivo (Figure 5E, Figure S6). SIV-specific CD8+ T-cell
258
frequencies increased sharply as the initial viremia began to fall and remained high for the
259
duration of the study in CyMs irrespectively of their level of viremia. However, the
260
substantial decline in viremia to levels below 400 copies/mL in SICs coincided with the raise
261
of SIV-suppressive activity ex vivo. The increase of CD8+ T-cell-mediated SIV-suppressive
262
activity was delayed in the late controller #BL669 and #BO413, but nonetheless preceded
263
optimal control of viremia in these CyMs. A very strong capacity of CD8+ T-cells to suppress
264
SIV was observed at day 36 in the LN from two animals (BA209 and BC657) that did not show
13
such capacity in the blood (Figure 5A). Only one animal (29925) did not develop any
266
detectable SIV suppressive activity during our follow up. This animal had the weakest peak of
267
viremia (1 log lower than any other) and achieved the fastest control of viremia. Whether a
268
very rapid or local development of the CD8+ T-cell suppressive capacity may have occurred
269
or other mechanisms were associated with control of viremia in this animal remains
270
unknown (Figure S6). At the time of euthanasia, superior CD8+ T-cell-mediated
SIV-271
suppressive activity was detected in a vast majority of SICs across all anatomical
272
compartments, with the exception of bone marrow (Figure 5A), which nonetheless harbored
273
SIV-specific CD8+ T-cells at frequencies comparable to other tissues (Figure 4A). Thus,
274
although abundant, SIV-specific CD8+ T-cells induced during primary SIV infection had limited
275
SIV suppressive capacity when compared to cells found at later time points in SICs (Figure
276
5E).
277 278
To confirm that the capacity of CD8+ T-cells to suppress ex vivo SIV infection did not increase
279
in VIRs, we analyzed this activity in an additional group of 14 non-M6 CyMs infected
280
intravenously (i.v.) with 1,000AID50 of SIVmac251 and characterized by high setpoint viremia
281
(ANRS pVISCONTI study). In these animals, the CD8+ T-cell-mediated SIV-suppressive activity
282
also remained modest throughout the follow-up (Figure S8A). The combined analysis of the
283
CD8+ T-cells from all VIR CyMs (n=4 50AID50 + n=14 1,000AID50) exposed early significant
284
differences in the CD8+ T-cell-mediated SIV-suppressive activity when compared to the SICs
285
(Figure S8B). Moreover, early initiation (day 28 post-infection) of antiretroviral treatment in
286
another group of CyM inoculated with 1,000AID50 of SIVmac251 sharply decreased viremia
287
and CD8+ T-cell activation levels (Figure S8C) but did not change the capacity of CD8+ T-cells
288
from these animals to suppress infection ex vivo, which remained extremely weak (Figure
14
S8C). These results, which are in agreement with our previous observations in early treated
290
HIV-infected individuals (Lecuroux et al., 2013), show that low SIV suppressive capacity
291
during acute infection was neither a consequence of strong activation of these cells in vivo
292
nor of high antigen burden.
293 294
Collectively, our results show that the capacity of SIV-specific CD8+ T-cells to suppress
295
infection ex vivo was a genuine quality that progressively amplifies in SICs. Our results
296
further uncover a temporal link between the acquisition by CD8+ T-cells of potent capacity to
297
suppress infection and sustained control of SIV.
298 299
Acquisition of CD8+ T-cell-mediated SIV-suppressive activity in SICs occurs independently of 300
MHC haplotype
301
Our primary intention in this study was to explore the mechanisms underlying natural
302
control of SIV infection, independently of MHC background or infectious dose. However, as
303
expected (Bruel et al., 2015), inoculation with low-dose virus and carriage of the protective
304
M6 haplotype independently favored spontaneous control of viremia below 400 copies/mL
305
in CyMs in our study (Supplemental Table 3). We therefore evaluated whether these
306
parameters influenced the dynamics of control and the development of the CD8+ T-cell
307
response upon infection. We found that CD4+ T-cells and the levels of cell-associated SIV
308
DNA similarly evolved in the blood and PLNs from M6 and non-M6 controllers (Figure S9A).
309
There was just a tendency for M6 controllers vs non-M6 controllers to better recovery of
310
CD4+ T-cells in blood at the end of the study (p=0.07). Similarly, we did not find important
311
differences between M6 and non-M6 controllers in their development of SIV-specific CD8+
T-312
cell responses (Figure S9B). M6 and non-M6 controllers developed similar frequencies of
15
responding cells during acute infection that were maintained during the follow up. Of note,
314
the capacity of CD8+ T-cells to suppress ex vivo SIV infection of CD4+ T-cells progressively
315
increased in both M6 and non-M6 controllers. The only difference that we could appreciate
316
was a faster acquisition (day 36 p.i.) of CD8+ T-cell mediated SIV suppressive activity in the
317
PLN from M6 SICs versus non-M6 SICs (Figure S9B). Intriguingly, non-M6 SICs had higher
318
frequencies of SIV responding CD8+ T-cells in this tissue at the same time point. Overall these
319
results show that while the M6 background gave a selective advantage to CyMs to control
320
infection in conditions of higher viral inoculum, this MHC haplotype was not indispensable
321
for the acquisition of SIV suppressive capacity by CD8+ T-cells, which occurred both in M6
322
and non M6 SICs. The results are in agreement with the observations in HIV controllers.
323
Although cohorts of HICs are enriched in individuals carrying protective HLA class I alleles
324
(mainly HLA-B*57, B*27), many HICs do not carry protective HLA class I alleles but have CD8+
325
T-cells with strong HIV suppressive capacity ex vivo (Lecuroux et al., 2014). Therefore, the
326
development of efficient CD8+ T-cell responses with antiviral activity is a characteristic of
327
most HICs/SICs, independently of their MHC background.
328 329
Skewed maturation of central memory SIV-specific CD8+ T-cells is associated with defective 330
acquisition of SIV-suppressive activity
331
To dissect the phenotypic correlates of ex vivo measured antiviral potency, we analyzed the
332
differentiation status of SIV-specific CD8+ T-cells using selected markers in conjunction with
333
MHC class I tetramers (Figure S10, S11). Tetramer-binding SIV-specific CD8+ T-cells were
334
detected in all CyMs, displayed early similar differentiation profiles in SICs and VIRs, but
335
evolved differently, such that higher frequencies of central memory (CM) SIV-specific CD8+
16
cells were present in SICs versus VIRs on day 105 p.i. (p = 0.018) and day 535 p.i. (p = 0.013)
337
(Figure 6A, B).
338 339
In further analyses, we found that higher frequencies of SIV-specific CD8+ T-cells from SICs
340
expressed the IL-7 receptor CD127, which is associated with cell survival and memory
341
responses (Schluns et al., 2000), whereas higher frequencies of SIV-specific CD8+ T-cells from
342
VIRs expressed the transcription factor T-bet, which is associated with cellular differentiation
343
and effector functionality (Sullivan et al., 2003; Szabo et al., 2002) (Figure 7A). These
344
differences appeared since primary infection and became statistically significant at later time
345
points (Figure 7A). Expression levels of CD127 and T-bet also varied as a function of
346
differentiation among SIV-specific CD8+ T-cells from SICs and VIRs (Figure 7B). In particular,
347
CM and transitional memory (TM) SIV-specific CD8+ T-cells expressed lower levels of T-bet
348
throughout the course of infection in SICs versus VIRs, whereas CM SIV-specific CD8+ T-cells
349
tended to express higher levels of CD127 during chronic infection in SICs versus VIRs.
350 351
Accordingly, negative correlations were observed during primary infection and at euthanasia
352
between the expression levels of CD127 on SIV-specific CD8+ T cells and plasma viral loads
353
(Figure 8A). Of note, the levels of CD127 correlated positively with CD8+ T-cell-mediated
SIV-354
suppressive activity at the same time points (Figure 8B). On the contrary, negative
355
correlations were observed during primary infection and at euthanasia between CD8+
T-cell-356
mediated SIV-suppressive activity and the contemporaneous frequencies of T-bet+CD127–
357
SIV-specific CD8+ T-cells (Figure 8C) and between CD8+ T-cell-mediated SIV-suppressive
358
activity and expression levels of T-bet among CM SIV-specific CD8+ T-cells (Figure 8D).
359 360
17
Collectively, these results suggest that SIV-specific CM CD8+ T-cells are primed for survival in
361
SICs, enabling long-term memory, sustained antiviral activity and viral control, whereas the
362
corresponding SIV-specific CD8+ T-cells in VIRs adopt a skewed phenotype associated with
363
cellular differentiation and suboptimal antiviral activity.
18 DISCUSSION
365
The data presented in this study provide new insights into the immune correlates of natural
366
control of SIV. Although SIV-specific CD8+ T-cells were generated during acute infection with
367
equivalent dynamics and global frequencies in all CyMs, preventing discrimination between
368
SICs and VIRs, antiviral efficacy ex vivo developed progressively over time and was associated
369
with spontaneous SIV control. This dichotomy was underpinned by distinct early memory
370
programs within the SIV-specific CD8+ T-cell pool. Collectively, these findings identify a
371
cohesive set of immunological parameters that associate with effective and sustained
372
control of SIV.
373 374
To monitor the establishment of natural control prospectively, we took advantage of
375
previous reports showing that carriage of the MHC haplotype M6 and i.r. inoculation with
376
low-dose (5AID50) virus independently favor spontaneous control of SIVmac251 infection in
377
CyMs (Aarnink et al., 2011; Bruel et al., 2015; Mee et al., 2009). Our results corroborate
378
previous reports. In particular, although the presence M6 haplotype favored more frequent
379
and more rapid control of infection among animals receiving a high dose of the virus
380
(50AID50) (Supplemental Table 3), no significant differences were observed in the dynamics
381
of SIV control in M6 and non-M6 controllers. At the time of euthanasia, a higher proportion
382
of CD4+ T-cells and lower cell-associated SIV-DNA levels were found in multiple tissues from
383
SICs versus VIRs, demonstrating systemic control of SIV. These differences were much more
384
subtle during primary infection. However, PLNs from SICs harbored approximately 10-fold
385
less SIV-DNA in the acute phase than PLNs from VIRs. In addition, the frequency of CD4+
T-386
cells were maintained close to baseline throughout the course of the study in PLNs, but not
387
in blood or RBs, from SICs. These observations suggest that early containment of viral
19
replication in lymph nodes (Buggert et al., 2018; Reuter et al., 2017) may be a key event for
389
subsequent immune control of SIV.
390 391
In line with previous studies in humans (Lecuroux et al., 2013; Ndhlovu et al., 2015;
392
Trautmann et al., 2012) and non-human primates we observed early and robust expansions
393
of SIV-specific CD8+ T-cells in all CyMs. However, the functional profiles and overall
394
frequencies of SIV-specific CD8+ T-cells (as determined by intra cellular cytokine staining
395
upon SIV antigen stimulation) during the acute phase of infection were largely equivalent in
396
SICs and VIRs, and neither parameter correlated with subsequent determinations of plasma
397
VL. Similarly, the functional profiles and overall frequencies of SIV-specific CD8+ T-cells
398
during the chronic phase of infection were largely equivalent in SICs and VIRs, although
399
polyfunctionality (defined as the capacity to produce simultaneously several cytokine and/or
400
degranulate) was impaired at the time of euthanasia in VIRs. These results suggest that
401
differences in polyfunctionality found during chronic infection are a surrogate marker of viral
402
replication rather than an accurate determinant of antiviral efficacy, although low number of
403
animals in the VIR group may limit statistical power.
404 405
The capacity of CD8+ T-cells to suppress infection of autologous CD4+ T-cells directly ex vivo
406
is a particular feature of HICs (Almeida et al., 2009; Angin et al., 2016; Buckheit et al., 2012;
407
Julg et al., 2010; Saez-Cirion et al., 2007; Saez-Cirion et al., 2009; Tansiri et al., 2015) that is
408
mediated by the rapid elimination of infected CD4+ T-cells (Saez-Cirion et al., 2007).
409
Irrespective of subsequent outcome, we detected relatively weak CD8+ T-cell-mediated
SIV-410
suppressive activity during primary infection, despite the vigorous mobilization of
SIV-411
specific CD8+ T-cells. This observation parallels our previous findings in the setting of HIV
20
(Lecuroux et al., 2013) and point to limited antiviral potential of CD8+ T-cell responses
413
generated during primary infection. However, a remarkable negative correlation was already
414
observed between the CD8+ T-cell-mediated SIV-suppressive activity and viremia at this early
415
time point, showing early temporal association of this antiviral activity and reduction of
416
viremia. Of note, this SIV-suppressive capacity of CD8+ T-cells increased progressively over a
417
period of weeks in some animals, carrying or not the protective MHC haplotype M6, and
418
correlated temporally with the establishment of viral control. At the time of euthanasia,
419
these highly potent antiviral CD8+ T-cells were present in all tissues, with the exception of
420
bone marrow. It is important to notice that CD8+ T-cell-mediated SIV suppression was very
421
weak also in LN during the first weeks following infection but increased over time in SICs.
422
Therefore, the increase in the capacity of CD8+ T-cells to suppress infection that we observed
423
in this study was not the result of the recirculation of CD8+ T-cells from lymph nodes once
424
control was established but a genuine progressive augmentation of the antiviral potential of
425
the cells. The development of potent antiviral CD8+ T-cells is therefore a bone fide correlate
426
of sustained control of SIV.
427 428
The divergent antiviral properties of SIV-specific CD8+ T-cells in SICs versus VIRs were
429
associated with early differences in the expression of CD127 and T-bet, especially within the
430
less differentiated memory pools (CM and TM). In particular, higher frequencies of
SIV-431
specific CM CD8+ T-cells expressed CD127 in SICs, whereas higher frequencies of SIV-specific
432
CM and TM CD8+ T-cells expressed T-bet in VIRs. These differences became more
433
pronounced throughout the course of infection. Studies in mice have shown that decreased
434
expression of T-bet among memory CD8+ T-cells allows the establishment of long-lived
435
CD127hi cells, which maintain the capacity to proliferate and control successive infections
21
(Joshi et al., 2007; Joshi et al., 2011). Accordingly, our data suggest that SICs develop true
437
memory-like SIV-specific CD8+ T-cell responses, which is key for the acquisition of antiviral
438
ability, whereas VIRs develop SIV-specific memory CD8+ T-cell responses skewed towards
439
more effector-like characteristics. In line with this supposition, the proportion of CD127+
SIV-440
specific CD8+ T cells during acute infection (day 15 p.i.) and at euthanasia correlated
441
positively with CD8+ T-cell-mediated SIV-suppressive activity at the corresponding time
442
points, while the frequencies of T-bet+ CD127– SIV-specific CD8+ T-cells and the expression
443
levels of T-bet among CM SIV-specific CD8+ T-cells during acute infection correlated
444
negatively with CD8+ T-cell-mediated SIV-suppressive activity. These findings are broadly
445
consistent with several previous reports describing immune profiles that associate with the
446
control of viremia in HICs during chronic infection. Favorable characteristics include high
447
frequencies of CD57+ eomesoderminhi HIV-specific CD8+ T-cells with superior proliferative
448
capacity, increased expression levels of CD127, and intermediate expression levels of T-bet
449
(Simonetta et al., 2014), and high frequencies of HIV-specific CD8+ T-cells with the capacity
450
to upregulate T-bet, granzyme B, and perforin in response to antigen encounter (Hersperger
451
et al., 2011b; Migueles et al., 2008).
452 453
In a recent single cell study (Angin et al., 2019b), we also found differences in the program of
454
HIV-specific CM CD8+ T-cells from HIV controllers and non-controllers on cART: whereas
HIV-455
specific CM CD8+ T-cells from HIC upregulated the expression of effectors genes linked with
456
mTORC2 activation and cell survival (including CD127), central memory cells from
non-457
controllers had a skewed profile associated with mTORC1 activation (including T-bet) and
458
glycolysis. This was traduced in a dependency on glucose of HIV-specific CD8+ T-cells from
459
non-controllers to react to HIV antigens, while HIV-specific CD8+ T-cells from controllers
22
were characterized by metabolic plasticity and being able to exert their function even in
461
conditions of glucose deprivation. Of note, these differences in the metabolic program of
462
cells from controllers and non-controllers could also be recapitulated with SIV-specific CD8+
463
T-cells from SICs and VIR CyMs from the present study (Angin et al., 2019b), further
464
corroborating the validity of our CyM model to study the development of the protective
465
CD8+ T-cell responses characteristics of HIV/SIV controllers. The present results extend these
466
observations and support a key role for long-lived memory responses in the control of SIV.
467
Importantly, our data also show that distinct memory responses are formed early after
468
infection, potentially reflecting different priming conditions. Interestingly, although the
469
antiviral activity of CD8+ T-cells increased over time in SICs, we already found a negative
470
correlation between this activity and the plasma viremia at day 15. On this basis, we propose
471
that the amplification of potent antiviral activity maters in long term control and is the result
472
of a maturation process, the trajectory of which is linked to early optimal programming of
473
the CD8+ T-cell memory compartment.
474 475
It remains unclear which factors are required to encourage the development of memory
476
CD8+ T-cell responses that provide optimal protection against HIV/SIV. In some viral
477
infections, expression of T-bet is tightly regulated by cytokines, such as IL-12 (Rao et al.,
478
2012; Takemoto et al., 2006). Low levels of inflammation may therefore favor the
479
emergence of long-lived memory CD8+ T-cells. It is also interesting to note that maturation
480
through persistent or repeated exposure to antigen can drive the selection of specific
481
clonotypes bearing high-affinity T-cell receptors (TCRs) (Busch and Pamer, 1999; Ozga et al.,
482
2016; Price et al., 2005) which have been shown to suppress HIV replication more efficiently
483
than clonotypes targeting the same antigen via low-affinity TCRs (Almeida et al., 2007;
23
Almeida et al., 2009; Ladell et al., 2013). Increase in antigen sensitivity over time would be
485
compatible with the progressive increase in antiviral potency that we observed for the CD8+
486
T-cells from controllers in our study.
487 488
A recent study in the LCMV murine model of infection has shown that memory CD8+ T-cell
489
responses expressing the transcription factor TCF1 developed during chronic infection (in an
490
immunosuppressive environment) have a distinct molecular program, resist contraction, had
491
increased long-term functionality, are less prone to exhaustion and are thus critical for
492
controlling ongoing viral replication; in contrast, memory cells that are developed at the
493
onset of infection (in a pro-inflammatory environment) become short-term effectors and are
494
rapidly exhausted (Snell et al., 2018). Accordingly, we suggest that balanced inflammatory
495
responses (Barouch et al., 2016) arising as a consequence of lower viral burdens in lymph
496
nodes during acute infection in SICs might facilitate antigen-specific priming events
497
associated with optimal memory programs (Ozga et al., 2016) and minimize the loss of CD4+
498
T-cells, which provide helper functions that are critical for the development of long-lived
499
memory CD8+ T-cells (Khanolkar et al., 2004).
500 501
Collectively, the data presented here underscore the importance of early host-pathogen
502
interactions in the development of adaptive immunity and reveal an optimal maturation
503
pathway associated with the generation and maintenance of potent and sustained antiviral
504
CD8+ T-cell responses, which in turn dictate the outcome of infection with SIV.
24 METHODS
506
Ethical statement
507
Cynomolgus macaques (CyMs, Macaca fascicularis) were imported from Mauritius and
508
housed in facilities at the Commissariat à l'Energie Atomique et aux Energies Alternatives
509
(CEA, Fontenay-aux-Roses, France). All non-human primate studies at the CEA are conducted
510
in accordance with French National Regulations under the supervision of National Veterinary
511
Inspectors (CEA Permit Number A 92-03-02). The CEA complies with the Standards for
512
Human Care and Use of Laboratory Animals of the Office for Laboratory Animal Welfare
513
under Assurance Number #A5826-01. All experimental procedures were conducted
514
according to European Directive 2010/63 (Recommendation Number 9). The SIC and
515
pVISCONTI studies were approved and accredited under statement number A13-005 and
516
A15-035 by the ethics committee “Comité d'Ethique en Expérimentation Animale du CEA”,
517
registered and authorized under Number 44 and Number 2453-2015102713323361v2 by the
518
French Ministry of Education and Research. CyMs were studied with veterinary guidance,
519
housed in adjoining individual cages allowing social interactions, and maintained under
520
controlled conditions with respect to humidity, temperature, and light (12 hour light/12
521
hour dark cycles). Water was available ad libitum. Animals were monitored and fed once or
522
twice daily commercial monkey chow and fruit by trained personnel. Environmental
523
enrichment was provided including toys, novel foodstuffs, and music under the supervision
524
of the CEA Animal Welfare Body. Experimental procedures (animal handling, viral
525
inoculations, and samplings) were conducted after sedation with ketamine chorhydrate
526
(Rhone-Merieux, Lyon, France, 10 mg/kg). Tissues were collected at necropsy: animals were
527
sedated with ketamine chlorhydrate 10 mg/kg) then humanely euthanized by intravenous
528
injection of 180 mg/kg sodium pentobarbital.
25 530
Animals and SIV infection
531
A total of 16 healthy adult male CyMs (median age = 6.8 years at inclusion, IQR = 5.8–7.2)
532
were selected for this study on the basis of MHC haplotype (M6+, n = 6; M6–, n = 10) (34).
533
CyMs were inoculated i.r. with either 5AID50 or 50AID50 of uncloned SIVmac251 (A.M.
534
Aubertin, Université Louis Pasteur, Strasbourg, France). The following experimental groups
535
were studied: (i) M6– CyMs inoculated i.r. with 5AID50 (non-M6 5AID50, n = 4); (ii) M6+ CyMs
536
inoculated i.r. with 50AID50 (M6 50AID50, n = 6); and (iii) M6– CyMs inoculated i.r. with
537
50AID50 (non-M6 50AID50, n = 6). Animals were monitored for 18 months post-infection.
538 539
The outcome of infection generally matched expectations based on previous studies for each
540
experimental group (Figure S12, Supplemental Table 1). Only one M6+ CyM (31041) was
541
unable to control viremia below 400 copies/mL. This animal was homozygous for MHC class I
542
(Supplemental Table 1), which intrinsically limits immune control of HIV/SIV (Carrington et
543
al., 1999; O'Connor et al., 2010). The dynamics of viral replication during acute infection
544
were very similar in the three experimental groups, with peak VLs of 5.9, 6.4, and 6.3 log
SIV-545
RNA copies/mL of plasma on day 14 p.i. for non-M6 5AID50, M6 50AID50, and non-M6
546
50AID50 CyMs, respectively (Supplemental Table 1).
547 548
CyMs in the pVISCONTI study (median age = 5 years at inclusion, IQR = 4.1–5.3) were
549
inoculated with 1000 AID50 of uncloned SIVmac251 through the intravenous route. None of
550
these animals carried the M6 haplotype. An antiretroviral regimen containing emtricitabine
551
(FTC), dolutegravir (DTG), and the tenofovir prodrug tenofovir-disoproxil-fumarate (TDF),
26
formulated as a once daily subcutaneous injection, was initiated at day 28 post-inoculation
553
in 6 animals. TDF was administered at 5.1 mg/kg, FTC at 40 mg/kg and DTG at 2.5 mg/kg.
554 555
Blood collection and processing
556
Peripheral blood was collected by venous puncture into Vacutainer Plus Plastic K3EDTA
557
Tubes or Vacutainer CPT Mononuclear Cell Preparation Tubes with Sodium Heparin (BD
558
Biosciences). Complete blood counts were monitored at all time points from the Vacutainer
559
Plus Plastic K3EDTA Tubes. Plasma was isolated from Vacutainer Plus Plastic K3EDTA Tubes
560
by centrifugation for 10 min at 1,500 g and stored at –80 °C. Peripheral blood mononuclear
561
cells (PBMCs) were isolated from Vacutainer CPT Mononuclear Cell Preparation Tubes with
562
Sodium Heparin according to manufacturer’s instructions (BD Biosciences), and red blood
563
cells were lysed in ACK (NH4Cl 0.15 M, KHCO3 10 mM, EDTA 0.1 mM, pH 7.4).
564 565
Tissue collection and processing
566
Axillary or inguinal lymph nodes (PLNs), rectal biopsies (RBs) and broncho-alveolar lavages
567
(BAL) were collected longitudinally from each animal at the indicated time points. In
568
addition, bone marrow, spleen, mesenteric lymph nodes (MLNs), duodenum, jejunum, ileum
569
and colon were collected at necropsy. Tissue samples were snap-frozen in liquid nitrogen for
570
storage at –80 °C or collected in RPMI medium at 2–8 °C. At each time point a complete PLN
571
group was collected. LNs were washed and cells were freshly isolated in RPMI medium upon
572
mechanical disruption with a GentleMACS dissociator as recommended by the manufacturer
573
(Miltenyi Biotec). Cell suspension was filtered (70µm), then red blood cells were lysed in
574
ACK. RB lymphocytes were obtained from approximately 4 mm2 of rectal mucosa. Colonic
575
lymphocytes were obtained from mucosa taken from approximately 10 cm of tissue. RBs and
27
colonic tissue were washed extensively in R10 medium (RPMI medium supplemented with
577
10% fetal calf serum and penicillin/neomycin/streptomycin), then digested for 45 minutes
578
with collagenase II prior to mechanical disruption. Lymphocytes were isolated over a Percoll
579
67/44 gradient (Sigma-Aldrich). Bone marrow cells were purified using Lymphocyte
580
Separation Medium (Lonza Bioscience) diluted to 90% in DPBS, centrifuged for 20 minutes at
581
350 g, and separated from red cells in ACK. Spleen cells were processed by mechanical
582
disruption in RPMI medium using a GentleMACS™ Dissociator (Miltenyi Biotec), purified as
583
described for bone marrow cells, and separated from red cells in ACK. Total cells were
584
immediately designated to T-cell activation and proliferation analyses by flow cytometry,
585
CD4+ and CD8+ T-cells separation with magnetic beads for antiviral activity assay and the
586
remaining cells were frozen for further assessment of cytokine production by ICS or tetramer
587
analyses.
588 589
Quantification of plasma viral load
590
Plasma viremia was monitored longitudinally in all animals using quantitative real-time
591
RTqPCR with a limit of detection of 12.3 copies/mL (Angin et al., 2019a). Viral RNA was
592
prepared from 100 μl of cell-free plasma. Quantitative RT-PCR was performed with a
593
SuperScript III Platinum One-Step qRT-PCR Kit (Thermofisher) in a CFX96 Touch Real-Time
594
PCR Detection System (BioRad) under the following conditions: 12.5 μl of 2X reaction
595
mixture, 0.5 μl of RNaseOUT (40U/μl), 0.5 μl of Superscript III reverse transcriptase/Platinum
596
Taq DNA Polymerase, 1 μl of each primer (125 μM), 0.5 μl of the fluorogenic probe (135 μM),
597
and 10-μl of RNA elution samples. The probe and primers were designed to amplify a region
598
of SIVmac251 gag. Forward primer was 5’-GCAGAGGAGGAAATTACCCAGTAC-3’ (24 bp) and
599
reverse primer was 5’-CAATTTTACCCAGGCATTTAATGTT-3’ (25 bp). The TaqMan probe
28
sequence was 5’-FAM-TGTCCACCTGCCATTAAGCCCGA-BHQ1-3’ (23 bp). This probe had a
601
fluorescent reporter dye, FAM (6-carboxyfluorescein), attached to its 5’ end and the
602
quencher BHQ1 (Black Hole Quencher 1) attached to its 3’ end. Samples were heated for 30
603
min at 56°C and 5 min at 95°C, followed by 50 cycles of 95°C for 15 s and 60°C for 1 min.
604 605
Quantification of SIV-DNA
606
Total DNA was extracted from purified CD14+ alveolar macrophages, buffy coats and
snap-607
frozen tissues. CD14+ alveolar macrophages were purified by positive selection using
608
antibody-coated magnetic beads following manufacturer`s instructions (Miltenyi Biotec).
609
Purity was checked by flow cytometry (Figure S1A, upper panel). Snap-frozen tissues were
610
mechanically disrupted with a MagNA Lyser (Roche Diagnostics). DNA extraction was
611
performed using a QIAamp DNA Blood Mini Kit (Qiagen) following manufacturer`s
612
instructions. SIV-DNA was quantified using an ultrasensitive quantitative real-time PCR. For
613
blood samples, 150,000 cells were analyzed for each SIV-DNA PCR. Due to sample size
614
limitations, for rectal biopsies and bronchoalveolar lavages 50,000 and 20,000 cells per PCR
615
were tested, respectively. All amplifications were performed on 2–4 replicates. The cell line
616
SIV1C, which contains 1 copy of SIV integrated/cell, was used as a standard for
617
quantification. 1 μg of DNA was considered to be equivalent to 150,000 cells. Amplification
618
was performed using primers and a probe located in the gag region. The CCR5 gene was
619
used to normalize results per million cells. Results were then adjusted by the frequencies of
620
CD4+ T-cells in blood and tissues, when available. The limit of quantification was 2
621
copies/PCR. Primers and probes were: SIV gag F: 5’-GCAGAGGAGGAAATTACCCAGTAC-3’; SIV
622
gag R: 5’-CAATTTTACCCAGGCATTTAATGTT-3’; SIV gag probe:
5’-FAM-623
TGTCCACCTGCCATTAAGCCCGA-BHQ1-3’; CCR5 F: an equimolar mix of
29
CAACATGCTGGTCgATCCTCAT-3’ and CAACATACTGGTCGTCCTCATCC-3’; CCR5 R:
5’-625
CAGCATAGTGAGCCCAGAAG-3’; and CCR5 probe:
5’-HEX-CTGACATCTACCTGCTCAACCTG-626
BHQ1-3’.
627 628
Measurement of T-cell activation and proliferation
629
T-cell activation and proliferation were assessed using fresh PBMCs and tissue cell
630
suspensions. Blood samples were treated with FACS Lysing Solution (BD Biosciences). Cells
631
were surface stained for CD3, CD4, CD8, CD38, CD45, CCR5, and HLA-DR,
632
fixed/permeabilized using a Cytofix/CytoPerm Kit (BD Biosciences), and stained
633
intracellularly for Ki-67. The following antibodies used were: anti-CD3–PE (clone SP34-2, BD
634
Biosciences), anti-CD4–PerCP-Cy5.5 (clone L200, BD Biosciences), anti-CD8–BV650 (clone
635
RPA-T8, BioLegend), anti-CD38–FITC (clone AT-1, StemCell Technologies), anti-CD45–V500
636
(clone D058-1283, BD Biosciences), anti-CCR5–APC (clone 3A9, BD Biosciences),
anti-HLA-637
DR–APC-H7 (clone G46-6, BD Biosciences), and anti-Ki-67–AF700 (clone B56, BD
638
Biosciences). Data were acquired using an LSRII flow cytometer (BD Biosciences) and
639
analyzed with FlowJo software version 10 (TreeStar Inc.).
640 641
Intracellular cytokine staining
642
Frozen PBMCs, PLN cells, bone marrow cells, splenocytes and MLN cells were thawed,
643
resuspended at 1 × 10⁶/mL in R20 medium, and stored overnight at 37 °C. Cells were then
644
stimulated with a pool of 24 optimal SIV peptides (8-10 amino acids long) (2 μg/mL each,
645
Supplemental Table 2) or with a pool of 125 overlapping SIV Gag 15-mer peptides (2 μg/mL
646
each, NIH AIDS Reagent Program, SIVmac239 Gag Peptide Set #12364) in the presence of
647
anti-CD28 (1 μg/mL, clone L293, BD Biosciences) and anti-CD49d (1 μg/mL, clone 9F10, BD
30
Biosciences) and stained with anti-CD107a (clone H4A3, BD Biosciences) for 30 minutes prior
649
to the addition of GolgiStop (1 μL/mL, BD Biosciences) and brefeldin A (BFA, 5 μg/mL,
Sigma-650
Aldrich). Costimulatory antibodies alone were used as a negative control, and concanavalin A
651
(5 µg/mL, Sigma-Aldrich) was used as a positive control. Cells were incubated for a total of 6
652
hours. After washing, cells were surface stained for CD3, CD4, and CD8, fixed/permeabilized
653
using a Cytofix/CytoPerm Kit (BD Biosciences), and stained intracellularly for IFNγ, TNFα, and
654
IL-2. The following antibodies were used: anti-CD107a–V450 (clone H4A3, BD Biosciences),
655
anti-CD3–AF700 (clone SP34-2, BD Biosciences), anti-CD4–PerCP-Cy5.5 (clone L200, BD
656
Biosciences), anti-CD8–APC-Cy7 (clone RPA-T8, BD Biosciences), anti-IFNγ–PE-Cy7 (clone
657
B27, BD Biosciences), anti-IL-2–PE (clone MQ1-17H12, BD Biosciences), and
anti-TNFα–PE-658
CF594 (clone Mab11, BD Biosciences). Data were acquired using an LSRII flow cytometer (BD
659
Biosciences) and analyzed with FlowJo software version 10 (TreeStar Inc.). Results were
660
corrected for background by subtracting the peptide stimulated response from the negative
661
(no peptide) control. Negative responses were given an arbitrary value of 0.001. All data are
662
represented. A representative flow cytometry gating strategy used to analyze cytokine
663
production via intracellular staining after peptide stimulation is shown in Figure S13.
664 665
MHC class I tetramer staining
666
Biotinylated complexes of Nef RM9 (RPKVPLRTM)–Mafa A1*063:02, Gag GW9
667
(GPRKPIKCW)–Mafa A1*063:02, and Vpx GR9 (GEAFEWLNR)–Mafa B*095:01 were produced
668
as described previously(53). The corresponding tetramers were generated via stepwise
669
addition of APC-conjugated streptavidin (Thermo Fisher Scientific). Frozen PBMCs were
670
stained with the pool of these tetramers for 30 minutes at 37 °C, washed, and surface
671
stained for CD3, CD4, CD8, CD14, CD20, CD27, CD45RA, CCR7, HLA-DR, and CD127. Cells
31
were then fixed/permeabilized using a Cytofix/CytoPerm Kit (BD Biosciences) and stained for
673
T-bet. The following antibodies were used: anti-CD3–AF700 (clone SP34-2, BD Biosciences),
674
anti-CD4–PerCP-Cy5.5 (clone L200, BD Biosciences), anti-CD8–APC-Cy7 (clone RPA-T8, BD
675
Biosciences), anti-CD14–BV786 (clone M5E2, BD Biosciences), anti-CD20–BV786 (clone L27,
676
BD Biosciences), anti-CD27–PE (clone M-T271, BD Biosciences), anti-CD45RA–PE-Cy7 (clone
677
5H9, BD Biosciences), anti-CCR7–PE-Dazzle594 (clone G043H7, BioLegend), anti-HLA-DR–
678
Pacific Blue (clone G46-6, BD Biosciences), anti-CD127–FITC (clone MB15-18C9, Miltenyi
679
Biotec), and anti-T-bet–BV711 (clone 4B10, BioLegend). Data were acquired using an AriaIII
680
flow cytometer (BD Biosciences) and analyzed with FlowJo software version 10 (TreeStar
681
Inc.). A representative flow cytometry gating strategy used to analyze T-cell differentiation
682
and tetramer staining are shown in Figure S10, S11.
683 684
Measurement of SIV-suppressive activity
685
Autologous CD4+ and CD8+ T-cells were purified from freshly isolated PBMCs or tissue cell
686
suspensions by positive and negative selection, respectively, using antibody-coated magnetic
687
beads with a RoboSep instrument (StemCell Technologies). Purified CD4+ T-cells were
688
stimulated for 3 days with concanavalin A (5μg/mL, Sigma-Aldrich) in the presence of IL-2
689
(100 IU/mL, Miltenyi Biotec). Purified CD8+ T-cells were cultured in the absence of mitogens
690
and cytokines (ex vivo CD8+ T-cells). Stimulated CD4+ T-cells (105) were superinfected in
U-691
bottom 96-well plates with SIVmac251 (MOI = 10–3) in the presence (1:1 effector to target
692
cell ratio) or absence of ex vivo CD8+ T-cells (105) from the same tissue via spinoculation for 1
693
hour (1,200g at room temperature) followed by incubation for 1 hour at 37 °C. Cells were
694
then washed and cultured in R10 medium containing IL-2 (100 IU/mL, Miltenyi Biotec).
695
Culture supernatants were assayed on day 7 using an SIV p27 Antigen ELISA Kit
32
(Zeptometrix). Antiviral activity was calculated as log10 (mean p27 ng/mL in SIV-infected
697
CD4+ T-cell cultures without CD8+ T-cells) / (mean p27 ng/mL in SIV-infected CD4+ T-cell
698
cultures + ex vivo CD8+ T-cells) (Saez-Cirion et al., 2010).
699 700
Data visualization and statistical analyses 701
Data visualization was performed using Tableau version 2018.1.4 (Tableau Software).
702
Statistical analyses were performed using GraphPad version 8.1.2 (Prism Software) and
703
SigmaPlot version 12.5 (SYSTAT Software). Results are given as median with interquartile
704
range. The non-parametric Mann-Whitney U-test was used to compare data sets between
705
groups. Correlations were assessed by Spearman-rank analyses. Given the exploratory
706
nature of the analyses, p values were not adjusted for multiple comparisons. All p values less
707
than 0.05 were defined as significant.