HAL Id: cea-02500848
https://hal-cea.archives-ouvertes.fr/cea-02500848
Submitted on 15 Jun 2020HAL is a multi-disciplinary open access archive for the deposit and dissemination of sci-entific research documents, whether they are pub-lished or not. The documents may come from teaching and research institutions in France or abroad, or from public or private research centers.
L’archive ouverte pluridisciplinaire HAL, est destinée au dépôt et à la diffusion de documents scientifiques de niveau recherche, publiés ou non, émanant des établissements d’enseignement et de recherche français ou étrangers, des laboratoires publics ou privés.
Microstructural evolution of Q12
T Malloy irradiated in
PWR and comparison with other Zr base alloys
S. Doriot, B. Verhaeghe, A. Soniak-Defresne, T. Lejolu, P. Bossis, D. Gilbon,
V. Chabretou, J-P. Mardon, M. Ton-That, A. Ambard
To cite this version:
S. Doriot, B. Verhaeghe, A. Soniak-Defresne, T. Lejolu, P. Bossis, et al.. Microstructural evolution of Q12T M alloy irradiated in PWR and comparison with other Zr base alloys. ASTM B10 - 18th
International Symposium on ”Zirconium in the Nuclear Industry, May 2016, Hilton Head, United States. pp.823-856, �10.1520/STP159720160061�. �cea-02500848�
1
Symposium: B10 18th International Symposium on "Zirconium in the Nuclear Industry", May 15-19, 2016, Hilton Head S.C. US
Microstructural evolution of Q12™ alloy irradiated in PWR and comparison with other Zr base alloys.
Authors: S. Doriot1, B. Verhaeghe2, A. Soniak2, P. Bossis2, D. Gilbon3, V. Chabretou4, J. P. Mardon4, M. Ton-That5, A. Ambard6.
1 DEN-Service de Recherches Métallurgiques Appliquées, CEA, Université Paris-Saclay, F-91191
Gif-sur-Yvette, France
2 DEN-Service d’Etude des Matériaux irradiés, CEA, Université Paris-Saclay, F-91191 Gif-sur-Yvette, France 3 DEN-Département des Matériaux pour le nucléaire, Université Paris-Saclay, F-91191 Gif-sur-Yvette, France 4 AREVA NP, Fuel Business Unit, 10 rue Juliette Récamier, 69456 Lyon Cedex 06, France
5 Electricité de France-DIN Septen, 12-14 Avenue Dutriévoz, 69628 Villeurbanne Cedex, France
6 Electricité de France, R&D Division, Materials and Mechanics of Components, Les Renardières, 77818 Moret
sur Loing, Cedex, France
ABSTRACT: Based on the M5® alloy metallurgy, the Q12™ alloy (Zr-1Nb-0.5Sn-0.1Fe)
was developed by AREVA NP for structural components, with ultra-low Sn addition and slightly increased Fe content. The behavior of this alloy was tested under irradiation in PWR and has shown, in comparison to M5®, improvement in irradiation creep strength and similar free growth. The present paper provides results on dimensional stability and details the microstructural evolution of Q12™ alloy under neutron irradiation in PWR.
The microstructural evolution under irradiation of Q12™ was studied for fast neutron fluences up to 13x1025 n/m2 (E>1 MeV) with Analytical Transmission Electron Microscopy observations, focused on radiation-enhanced needle-like particles, Laves Phases, and linear density of <c>-component loops. These results are compared with other quaternary Zr-Nb-Sn-Fe alloys and with M5®. All these results allow a general discussion about microstructural
evolution and behavior under irradiation of quaternary type alloys compared to M5® alloy. This
study, in agreement with previous works on Zr1Nb and quaternary alloys, seems to show that increasing the iron content with the presence of niobium and tin will decrease the <c>-component loop linear density and delay the growth breakaway.
KEYWORDS: Zr-alloys, quaternary alloys, <c>-component loops, radiation-enhanced precipitation, growth, Laves phases, irradiation
2
INTRODUCTION
In-reactor Fuel Assembly (FA) deformation (irradiation creep and growth) is an issue encountered by many FA suppliers. For cladding tube application, the fully recrystallized (RXA) M5® alloy is replacing the stress-relieved (SRA) Zircaloy-4 (Zy-4) and has demonstrated superior in-reactor behavior [1] in comparison to low tin Zircaloy-4 [2,3]. Based on the M5® alloy metallurgy, the quaternary Q12™ alloy (Zr-1Nb-0.5Sn-0.1Fe) was developed by AREVA NP for structural components, with ultra-low Sn addition and slightly increased Fe content. Tin is added to increase the irradiation creep strength and the beginning of life mechanical properties. However, the content must also be limited to mitigate impact on corrosion resistance. The impact of iron is said beneficial for corrosion behavior. The behavior of this alloy was tested under irradiation in PWR and has shown, in comparison to M5®, improvement in irradiation creep strength [4,5,6].
Previous studies already detailed microstructural evolution of Zr-alloys under irradiation and the strong influence of this evolution on corrosion, growth, creep strength and tensile properties [7,8,9,10,11]. Some authors underline the favorable effect of the iron alloying of Zr-1Nb in the irradiation-thermal creep resistance [12,13]: iron contents up to 0.1% result in a significant reduction of strain [10]. In addition, according to the last author [10], the yield strength of a quaternary alloy after irradiation depends on its iron content, and the cause of the strengthening is the irradiation-induced solid solution supersaturation. This is the consequence of the Laves phases transformation during irradiation: according to this author [10] the Zr(Fe,Nb)2 second
phase particles (SPPs) loose very quickly their iron during irradiation and became Zr-Nb micro-crystallized highly faulted particles and then transform into Nb particles [11,12,13,14]. However, because the growth breakaway was clearly associated to the basal <c>-component loop nucleation [7,8,9,14,15,], and because these basal defects appear clearly correlated to iron re-distribution from the precipitates into the matrix in Zy-4 alloy [7,16,17], iron addition in Zr alloys was suspected to enhance growth phenomenon. But the correlation seems not obvious for M5® alloy and, in addition, the growth behavior of some quaternary alloys indicates on the contrary that increasing their iron content increases the incubation period for breakaway [10]. For these reasons it seems necessary to complete and refine microstructural examinations on irradiated quaternary alloys, in correlation with their macroscopic behavior (growth), and to compare them with M5® and low tin Zy-4 alloy.
This paper focuses on the microstructural evolution of Q12™ alloy (Zr-1Nb-0.5Sn-0.1Fe) under irradiation in PWRs for fast neutron fluence up to 13x1025n/m2 (E>1 MeV). It first provides results on dimensional stability, and then details the microstructural evolution of Q12™ alloy under neutron irradiation in PWR in comparison with two other quaternary alloys with different amount of iron and tin. The precipitates as the radiation-enhanced needle-like particles and the Laves phases are first studied in this paper with Analytical Transmission Electron Microscopy (ATEM) observations. Then the evolution versus fast neutron fluence of <c>-component loop linear density in the three quaternary alloys compared to M5® alloy and RXA Zy-4 is studied by ATEM. All these results will allow a general discussion about microstructural evolution and behavior under irradiation of quaternary type alloys compared to M5® alloy.
M5is a trademark of AREVA NP registered in the USA and in other countries Q12 is a trademark of AREVA NP in the USA and in other countries
3
MATERIALS
Chemical composition and microstructure before irradiation
The nominal composition of the quaternary alloys studied in the present work, compared to M5®,and RXA Zy-4, is given in Table 1. Quaternary alloys were manufactured in the similar way as M5®. Details of the processing route as well as an extensive out-of-pile characterization program (microstructure, texture, mechanical properties and creep and corrosion behavior) have all be given in previous publications and will not be discussed here [4,5]. All the materials are fully recrystallized.
TABLE 1: Nominal composition of the studied materials compared to M5® [4] and to
RXA Zy-4 [11] in w% Sn Fe Cr7 Nb M5® < 100 ppm 0.035 - 1 Zr1Nb0.3Sn0.1Fe 0.3 0.1 - 1 Zr1Nb0.3Sn0.2Fe 0.3 0.2 - 1 Q12™ 0.5 0.1 - 1 RXA Zy-4 [11] 1.35-1.4% 0.2 0.1 -
As said before [11], the initial microstructure of M5® is characterized by a homogenous highly
refined dispersion of native body centered cubic Nb precipitates in fully recrystallized grains. Very few hexagonal C14 Zr(Fe,Nb)2 Laves phases are observed in this alloy. In addition to this
fine dispersion of Nb precipitates, a coarser precipitation of Zr(Fe,Nb)2 Laves phases can be
observed in the quaternary alloys (arrowed FIG. 1b). An increase in iron content results in an increase to the molar fraction of Laves phase and a reduction to the ratio of Nb/Fe in the SPPs (TABLE 2). The grains are equiaxed (FIG. 1a) r with sizes similar to the M5® as the grain size
is not dependent on the alloy composition [4]. The highest iron content quaternary alloy (0.2%) contains some FCC (Zr,Nb)4Fe2 second phase particles (SPPs) [4]. Zy-4 shows the standard
RXA Zy-4 microstructure with hexagonal Zr(Fe,Cr)2 Laves phases evenly dispersed throughout
the matrix [7].
4
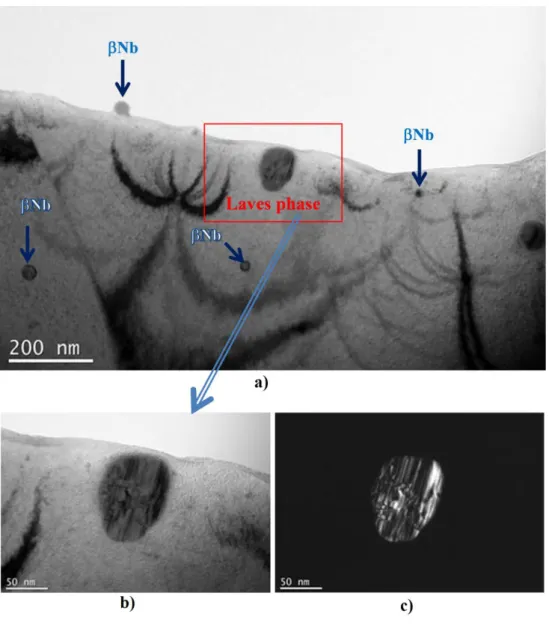
FIG. 1: Microstructure of Q12™ alloy a) general view, b) second phase precipitates FIG. 2 demonstrates the difference in the morphological aspect of the Laves phase SPPs compared to the Nb precipitates. The Laves phase SPPs are bigger than the Nb precipitates (about 150 nm in diameter instead of 50 nm for Nb [11]), as seen FIG. 2a. Stacking faults can be noticed in Laves Phases on FIG. 2b and c, as it is classically observed on theses SPPs [18,19].
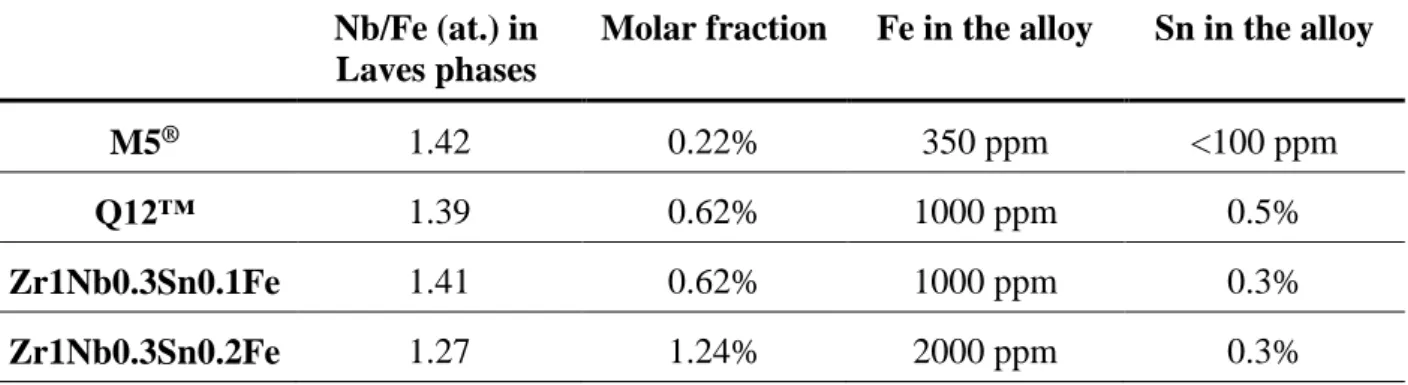
TABLE 2: Ratio Nb/Fe in the Laves phases and molar fraction of Laves phases before irradiation according to ref. [4]
Nb/Fe (at.) in Laves phases
Molar fraction Fe in the alloy Sn in the alloy
M5® 1.42 0.22% 350 ppm <100 ppm
Q12™ 1.39 0.62% 1000 ppm 0.5%
Zr1Nb0.3Sn0.1Fe 1.41 0.62% 1000 ppm 0.3%
5
FIG. 2: a) Morphological aspects of Laves phases and Nb SPPs. Stacking faults in Laves Phases, b) bright field, c) dark field.
Irradiation conditions
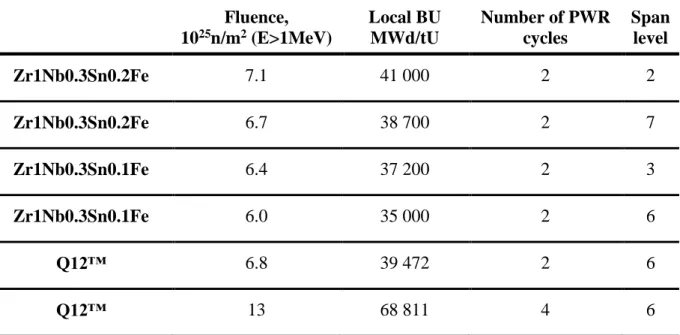
All the alloys were irradiated in PWR conditions. The fast fluence values (E>1 MeV) were deduced from the local fuel rod burnups. The quaternary alloy samples, for ATEM microstructural observation, were sections of cladding tubes irradiated during two or four 18-month 1300 MW cycles in a French power plant. The irradiation conditions of these alloys are given on TABLE 3. The irradiation conditions of RXA Zy-4 and M5® alloys for microstructural
comparison with Q12™ alloy were detailed elsewhere [11]. The fluence of the samples corresponds to a damage or dose of about 10 dpa for the two 18-month irradiated samples. It corresponds to a damage of about 20 dpa for the four 18-month irradiated samples [14]. Irradiations of the three quaternary alloys, RXA Zy-4, and M5® alloy material test tubes have also been launched in European power plants in order to determine irradiation free growth behavior.
6
TABLE 3: Irradiation conditions of the samples studied by ATEM
Fluence, 1025n/m2 (E>1MeV) Local BU MWd/tU Number of PWR cycles Span level Zr1Nb0.3Sn0.2Fe 7.1 41 000 2 2 Zr1Nb0.3Sn0.2Fe 6.7 38 700 2 7 Zr1Nb0.3Sn0.1Fe 6.4 37 200 2 3 Zr1Nb0.3Sn0.1Fe 6.0 35 000 2 6 Q12™ 6.8 39 472 2 6 Q12™ 13 68 811 4 6
EXPERIMENTAL PROCEDURE
Analytical Transmission Electron Microscopy
The Transmission Electron Microscopy (TEM) examinations were conducted using a 200 kV Jeol 2100. These examinations were focused on the microstructural study of Q12™ fuel rod claddings irradiated during two and four 18-month cycles. Fuel rod claddings of Zr1Nb0.3Sn0.1Fe and Zr1Nb0.3Sn0.2Fe alloys irradiated during two 18-month cycles were also examined. The comparison with M5® and Zy-4 alloys was done thanks to previous results [11]. The aim of this study was mainly to analyze the number density of <c>-component loops, the microstructural and micro-chemical changes of Zr(Fe,Nb)2 Laves phase SPPs and the
distribution of needle-like irradiation-enhanced precipitates, as a function of iron content and irradiation conditions.
Microstructural changes in materials were studied by electron diffraction and imaging (bright/dark fields, weak beams). A prism-plane foil orientation and a (0002) diffracting vector were used to image the <c>-component loops and the needle-like radiation-enhanced precipitates (s>>0). The needle-like particle distribution and the <c>-component loops were counted on several micrographs using the Noesis Visilog software. The thin foil thickness was measured by EELS (Electron Energy Loss Spectroscopy) or assumed to be 150 nm.
One has to keep in mind that, in TEM observation, a result must not be considered as an absolute value. A value makes sense only by comparison with other measures. To be comparable, the measures must be carried out in the same conditions and by the same manipulator. For instance the density of SPPs is under-evaluated because only particles in the Bragg condition can be seen. However this under-evaluation is similar for each sample. For <c>-component loops, the size of the objects is in the same order of magnitude as the thin foil thickness. Most of these basal defects are cut by the thin foil surfaces and their mean diameter depends strongly of the thin foil thickness. It is the reason why their linear density m per m3 is given rather than the mean diameter and the number density. We took care to measure <c>-component loops in samples of about the same thickness (~150 nm). Outside these systematical errors, the main
7
cause of uncertainty comes from the thin foil thickness measure (this point was discussed in ref. [11]) but this was quite improved by EELS measurement.
The micro-chemical composition was measured by a scanning and energy dispersive device (STEM/X-EDS) on a 200 kV Jeol 2010-F Field-Emission Gun microscope and was computed on an OXFORD system by processing the experimental X-ray spectra. Usually, the matrix contribution prohibits use of this technique to measure the exact composition of second phase particles of thin foil samples. Therefore, we plotted Nb=f(Zr) (or Fe=f(Zr)) collected on numerous second particles of the same kind. On the straight-line figure obtained, the lower the percentage of Nb (or Fe), the higher the matrix contribution. Some concentration profiles across precipitates were already performed. In these profiles the matrix contribution varies from the center to the periphery and only the ratio Fe/Nb can give an accurate indication on the micro-chemical changes across the SPPs.
Free-growth tests
Specific experimental irradiation programs in power plants were launched in order to assess the free growth behavior. In D24 power plant, Q12™, 0.1Fe and Zr-1Nb-0.3Sn-0.2Fe alloys tubes were irradiated. For comparison, M5® specimens of the same design were
also included in the test program.
A previous experiment was performed on RXA Zy-4 and M5® in D65 power plant. Results were already reported in [15].
In each experimental irradiation, samples were irradiated inside guide tubes of host fuel assemblies and located at high flux axial positions. In the D24 irradiation, samples were composed of two independent empty test tubes (~1 meter long, 0.4 mm wall thickness, no fuel). In D65 irradiation, the sample corresponds to one tube (~1.2 meter long, 0.4 mm wall thickness, no fuel). All samples are designed to enable water flow inside and outside the test tubes avoiding radial differential pressure and leading to double side corrosion.
RESULTS OF FREE-GROWTH TESTS
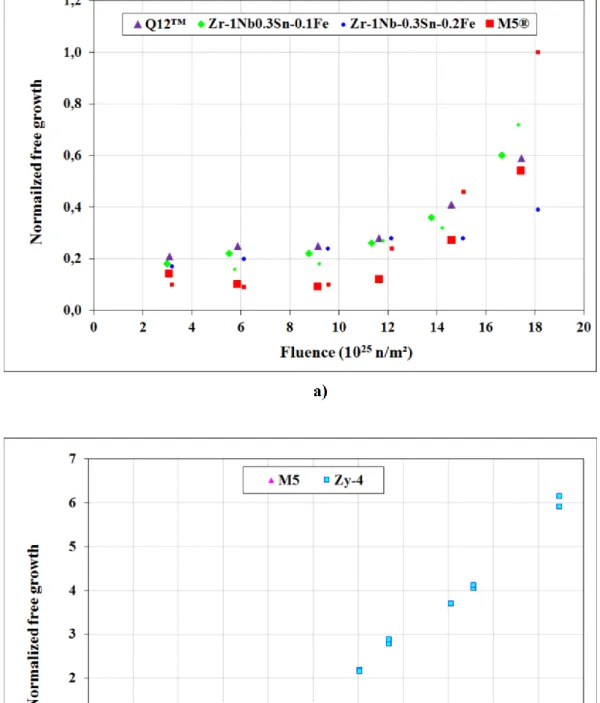
The evolution of axial elongations (normalized by the maximum free growth elongation measured on M5® of the same irradiation) versus fluence is presented FIG. 38. The normalization of the free growth has been done by dividing each elongation by the maximum M5® growth measured at the maximum fluence (for the same irradiation). Therefore, this M5®
elongation (ie maximum growth observed at the maximum fluence on M5®) appears equal to 1 in the figure. As usually measured on recrystallized alloys, free growth behavior can be divided in three regions: a first initial quick growth is measured; then a slowdown of the growth kinetics is observed; finally free growth acceleration happens.
Zy-4 alloy shows the higher elongations and growth rate with an early acceleration at a fluence about 7x1025 n/m². For the other studied alloys, the first and second steps occur also within the usual PWR fuel assembly irradiation (< 12x1025 n/m²) and acceleration is observed at higher fluence (~12-14x1025 n/m²). Before breakaway, comparable free growth is measured on the three quaternary alloys Q12™, Zr-1Nb-0.3Sn-0.1Fe and Zr-1Nb-0.3Sn-0.2Fe, whereas smaller elongations are measured on M5® in this irradiation. At higher fluence, free growth kinetics
8In figure 3a, there are "big" and "small" data points. The difference in size is to show that there are, in
some cases, two different specimens of the same alloy. The legend shows that one alloy is represented by one shape and one color.
8
accelerates and similar elongations are obtained on Q12™, Zr-1Nb-0.3Sn-0.1Fe and M5®. Growth acceleration at high fluence (> 14x1025 n/m², above usual FA fluence irradiation range) on Zr-1Nb-0.3Sn-0.2Fe alloy appears less pronounced leading to lower elongations at a fluence of about 18x1025 n/m².
The irradiation conditions, in particular thermo-mechanical history, are not representative of those experienced by fuel rods, with higher cladding temperature and internal pressure which leads to diametral creep. The free growth results of the empty material test tubes are therefore given as illustrative as one contribution to fuel rod elongation. Growth breakaway has not been observed on M5® nor on quaternary alloy fuel rod elongations within the usual FA fluence
9
FIG. 3: a) Free growth of Zr-1Nb-0.3Sn-0.1Fe, Zr-1Nb-0.3Sn-0.2Fe, Q12™ and M5®
tubes in D24 power plant, b) Free growth of RXA Zy-4 and M5® tubes in D65 power
10
RESULTS OF MICROSTRUCTURAL ANALYSES
General view and hydrides
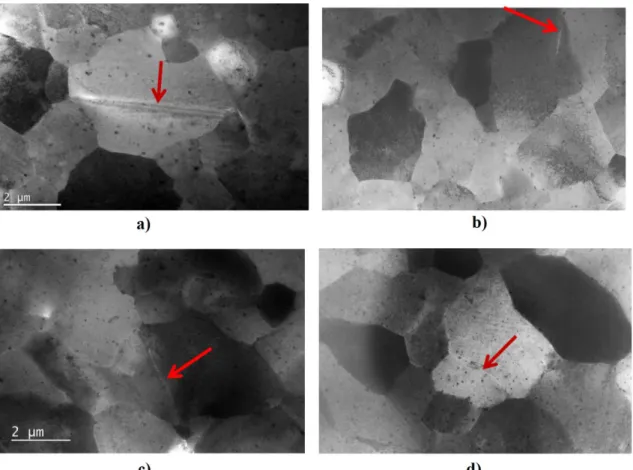
FIG. 4: General views of a) Q12™ alloy irradiated during two 18-month cycles, b) Zr1Nb0.3Sn0.1Fe alloy irradiated during two 18-month cycles, c) Zr1Nb0.3Sn0.2Fe alloy irradiated during two 18-month cycles, d) M5® alloy irradiated during four annual
cycles (7x1025 n.m-2). Arrows indicates hydrides.
The general microstructure of Q12™ alloy after irradiation is similar to the microstructure of Zr1Nb0.3Sn0.1Fe, Zr1Nb0.3Sn0.2Fe and M5® alloys for similar irradiation fluences. The grey
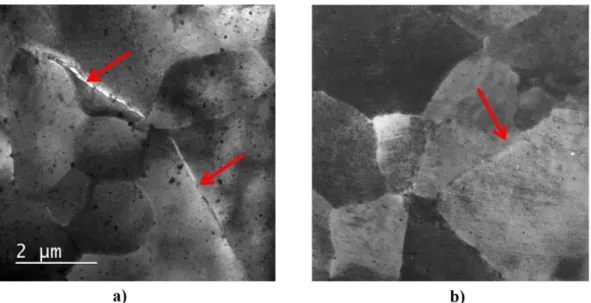
contrast due to irradiation defect is observed as expected. For a fluence of about 7x1025nm-2 we observe rare small inter or trans-granular hydrides in the four samples (arrowed FIG. 4). After an irradiation with a higher fluence (four 18-month cycles), some hydrides crossing neighboring grains can be seen in Q12™ alloy. For M5® alloy at a similar fluence the hydrides
are seen by ATEM to extend over only single grains (FIG. 5).
The <a>-loop microstructure looks like very similar in the quaternary alloys and in M5® alloy (without the Corduroy contrast seen by Shishov [10]). There is no reason to suspect a noticeable difference in the <a>-loop microstructure between M5® and the quaternary alloys nor an evolution of these <a> defect between two and four 18 month-PWR cycles. Thus we assumed that, as for M5® alloy, the <a>loops were about 2x10²² m-3 in density and 10 nm in diameter in the three quaternary alloys.
11
FIG. 5: General views of a) Q12™ alloy irradiated during four 18-month cycles, b) M5® alloy irradiated during six annual cycles (12.4x1025nm-2). Arrows indicates hydrides.
Native
Nb and Zr(Fe,Nb)
2particle evolution versus fast neutron fluence
Microstructural aspects
As before irradiation, a fine dispersion of precipitates and a coarser precipitation can be observed by ATEM. As expected, all the particles are fully crystalline, even for the highest dose (13x1025n/m2). The fine precipitates remain mono-crystalline and can be indexed, as before
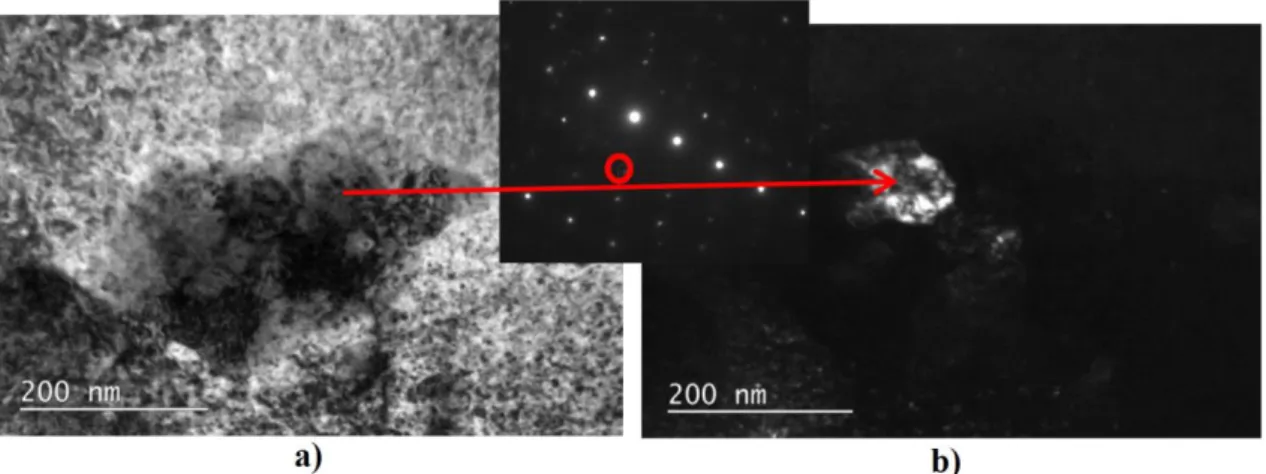
irradiation, as Nb precipitates, even for the highest dose. They have a granitic aspect as previously shown in M5® alloy [11]. The coarser precipitation corresponding to former Laves phases SPPs appears as micro-crystallized and highly faulted particles as seen in FIG. 6 and 7. This precipitation gives micro-crystallized diffraction diagrams that are very difficult to index. Despite this difficulty, some of the coarse precipitates in the Q12™ sample following two 18-month cycles were successfully indexed as hexagonal Laves Phase indicating that at least part of the SPPs maintained their original microstructure. One of these diffraction diagrams can be seen on FIG. 6. No diffraction diagram could be indexed in Laves phases after four 18-month cycles of irradiation.
FIG. 6: Former Laves phase in Q12™ alloy irradiated during two 18-month irradiation cycles
12
FIG. 7: Former Laves phase in Q12™ alloy irradiated during four 18-month irradiation
cycles, a) bright field, b) dark field.
FIG. 8 illustrates the microstructural differences between the Nb particles and the Laves phase SPPs. It is worth noticing that <c>-component loops are numerous at the vicinity of the prior Laves phase SPPs in all the quaternary alloys but not in M5® alloy, as said before [11]. No <c>-component loops are observed at the vicinity of the Nb particles (arrowed FIG. 8) for any of the micrographs.
13
FIG. 8: SPPs and <c>-component loops. Micrographs with g=0002 diffracting vector, a) M5® alloy irradiated during seven annual cycles [11], b) Zr1Nb0.3Sn0.1Fe alloy
irradiated during two 18-month cycles, c) Zr1Nb0.3Sn0.2Fe alloy irradiated during two 18-month cycles, d) Q12™ irradiated during two 18-month cycles, e) Q12™ irradiated
during four 18-month cycles. Arrow indicate location of Nb particles. Micro-chemical aspects
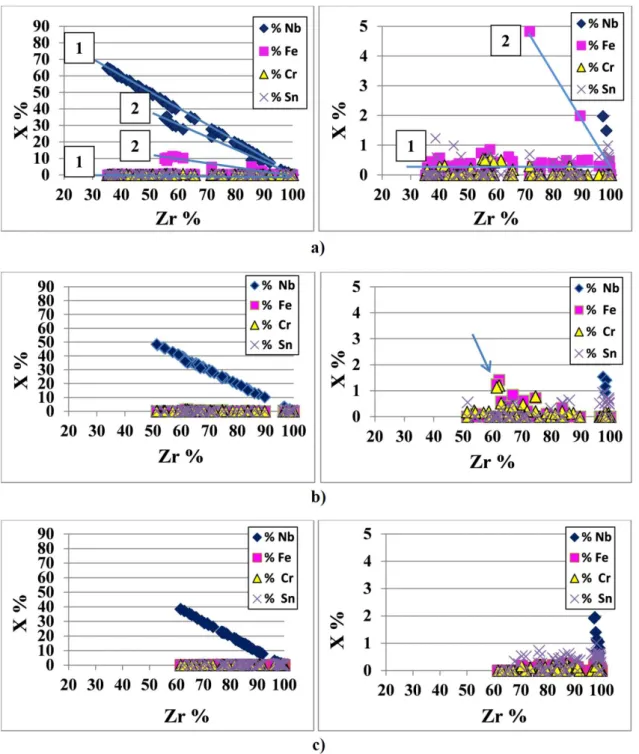
FIG. 9 compares the microanalysis curves of the precipitates before and after irradiation in Q12™ alloy. The two populations of SPPs can be well distinguished before irradiation with the microanalysis curves X%=f(Zr%), FIG. 9a. The first one (noted 1 on FIG. 9a) contains only Nb and Zr and corresponds to the Nb particles. The second one (noted 2) contains Zr, Fe, Nb and Cr and represents the Laves phase population. After irradiation for two 18-month cycles it seems that one kind of particles containing only Nb and Zr remains (FIG. 9b). But a zoom of the curve (right side) shows that some SPPs still contain a few percent of iron and chromium (arrowed on FIG. 9b). There are the former Laves phases. This underlines a drastic loss of iron
14
as early as two 18-month cycles, but the chromium content seems unchanged. This indicates a preferential dissolution of iron into the matrix. After irradiation for four 18-month cycles only one kind of particles corresponding to ZrNb SPPs and containing neither iron nor chromium can be seen (FIG. 9c).
FIG. 9: Microanalyses on SPPs in Q12™ alloy (w %), a) non irradiated, b) irradiated during 2 18-month cycles, c) irradiated during 4 18-month cycles
The behavior of SPPs in Zr1Nb0.3Sn0.2Fe and Zr1Nb0.3Sn0.1Fe alloys under irradiation is similar to that seen in Q12™. A concentration profile across a former Laves phase SPP in Zr1Nb0.3Sn0.1Fe alloy, irradiated for two 18-month cycles gives a homogeneous profile in the core of the SPP with a small percentage of iron and chromium (FIG. 10). In this core the ratio Nb/Fe (w%) is 10 versus 2.2 before irradiation. This result shows a drastic loss of iron in the
15
core of the precipitate while the chromium content appears unchanged. On the periphery of the SPP, iron and chromium as well drop down to zero. Niobium content rises and only niobium and zirconium remain in the periphery of the particle.
FIG. 10: Concentration profile across a former Laves phase SPP in Zr1Nb0.3Sn0.1Fe alloy irradiated during two 18-month cycles, a) concentration profile (w%), b)
micrograph.
Radiation - enhanced needle-like particles
In agreement with previous studies, [9,13,14,20,21,22,23] new phases were detected by TEM analyses for the three quaternary alloys after neutron irradiation. The small size of these precipitates makes it difficult to clearly characterize them [10], but previous Synchrotron X-Ray Diffraction (XRD) analyses of irradiated M5® alloy samples determined similar particles to be Nb particles with about 60% Nb w% content [11]. Different authors suppose that these particles are due to irradiation-enhanced diffusion controlled by migration of non-equilibrium irradiation-induced point defects [24,25,26,27]. These nanometric particles can be seen on FIG.
16
11 for the three quaternary alloys irradiated for two 18-month cycles, for the Q12™ alloy irradiated for four 18-month cycles and for the M5® alloy irradiated respectively for four and six annual cycles. On these micrographs the particles appear elongated in the direction close to the basal plane trace with prism-plane foil orientation. This shape is typically observed for these radiation-enhanced particles [10,20]. It could be explained by the attempt to minimize the stress field due to matrix/precipitate misfit, and by the anisotropy in diffusivity of irradiation-induced point defects [28]. No noticeable differences in size and density of the nanometric particles appear, for the different alloys and for the different fluences in FIG. 11.
FIG. 11: Micrographs with g=0002 diffracting vector s>>0 of nanometric radiation-enhanced particles of Nb, a) Zr1Nb0.3Sn0.2Fe alloy irradiated during two 18-month cycles, b) Zr1Nb0.3Sn0.1Fe alloy irradiated during two 18-month cycles, c) Q12™ alloy
irradiated during two 18-month cycles, d) M5® alloy irradiated during four annual
cycles (7x1025 n.m-2), e) Q12™ alloy irradiated during four 18-month cycles, f) M5® alloy
17
Number density
The evolution of the particle number density in Q12™ and in Zr1Nb0.3Sn0.2Fe alloys versus fast neutron fluence compared to M5® alloy is shown in FIG. 12. Despite the scattering of the data, probably due to thin-foil thickness measurement uncertainty, it seems clear that the particle density of both quaternary alloys is similar to that of M5® and is close to 1.5x10²² m-3.
FIG. 12: Number density of radiation-enhanced precipitation in Q12™ and in Zr1Nb0.3Sn0.2Fe alloys versus fast neutron fluence, compared to M5® alloy from ref.
[11].
Size
A measurement of the width and of the length of the nanometric particles in the three quaternary alloys is plotted in FIG. 13 and compared to the width and to the length of the radiation-enhanced particles observed in M5® alloy from ref. [11]. The average length value of the radiation-enhanced particles in the three quaternary alloys for both fluences is about 7 nm, as it is the case for M5® alloy irradiated at fluences higher than 5x1025 n.m2. The average width for
18
FIG. 13: Length and width of radiation-enhanced precipitation in Q12™, in Zr1Nb0.3Sn0.1Fe and in Zr1Nb0.3Sn0.2Fe versus fast neutron fluence, compared to
M5® from ref. [11].
FIG. 14 and 15 show the width and length distribution histograms of the radiation enhanced particles based on a huge amount of particles examined (between two and five hundred). FIG. 14 compares Q12™ and M5® alloys, as FIG. 15 compares the three quaternary alloys. These histograms are similar for the three quaternary alloys, for Q12™ alloy irradiated two or four 18-month cycles (6.8x1025nm-2, 13.0x1025nm-2) and for M5® alloy irradiated five annual cycles (11.0x1025nm-2).
19
FIG. 14: Histograms of width and length of radiation-enhanced particles. Comparison between Q12™ and M5® alloys a) Length, b) Width.
20
FIG. 15: Histograms of width and length of radiation-enhanced particles. Comparison between Q12™ alloy and the two other quaternary alloys a) Length, b) Width Spatial distribution
As previously shown [9,11] for M5® cladding tubes irradiated in PWR, the radiation enhanced particles gradually tend to be located within layers spaced about 50 nm parallel to the basal
21
plane. It seems that this phenomenon is more noticeable in M5® alloy than in quaternary alloys irradiated during a fluence representative of four annual cycles. However, at fluence levels representative of six annual cycles, the spatial distribution of the radiation enhanced particles is similarly evident for M5® and Q12™.
The density of the radiation-enhanced SPPs is not observed to be higher in the vicinity of native particles. This observation is consistent with the observation that no significant Nb re-dissolution out of the native particles occurs as in M5® alloy [11] (Nb diffusion rate in Zr is very low [29]).
Basal irradiation-induced <c>-component loops
For the relatively low fluence corresponding to two 18-month cycles, its seems that <c>-component loops are smaller and less numerous in the three quaternary alloys than in M5® alloy irradiated at a similar fluence (TEM exams FIG. 16 and TABLE 4). These basal defects are strongly associated with Laves phases in the quaternary alloys (FIG. 16a-c) and are not in the M5® alloy (FIG. 15d). They appear significantly less numerous in the Zr1Nb0.3Sn0.2Fe alloy than in the two other quaternary alloys. In this alloy containing 2000 ppm iron, the <c>-component loops can be seen only at the vicinity of Laves phase SPPs, whereas they can be observed at a distance of a few hundred nanometers from these particles in the two other quaternary alloys (arrowed in FIG. 16b and c).
At higher fluence the <c>-component loops appear more numerous and less heterogeneously dispersed for both materials Q12™ and M5® (FIG. 17 and TABLE 4). The observations (FIG. 17) and the measurements (TABLE 4) at this higher fluence confirm the tendency for a lower linear density of <c>-component loops in Q12™ than in M5® alloy.
Figure 18 shows the evolution of the <c>-loop linear density versus fast neutron fluence in the quaternary alloys of this work compared to M5® and RXA Zy-4 from ref. [11].
22
TABLE 4: Comparison of <c>-component loops density and average diameter in the M5® and in the quaternary alloys.
Alloy Fluence x1025 n/m2 Number density (x1019 m-3) m (nm) Linear density. x1013m/m3 Zr1Nb0.3Sn0.1Fe 6.0 4 93 0.4 Q12™ 6.8 3 107 0.3 Zr1Nb0.3Sn0.2Fe 6.9 1.5 83 0.1 M5® 7.0 6 168 1 M5® 11 15 112 1.6 M5® 12.4 13 173 2.2 Q12™. 13.0 8 131 0.9 M5® 13.6 14 182 2.7
23
FIG. 16: Micrographs with g=0002 diffracting vector: <c>-component loops a) Zr1Nb0.3Sn0.2Fe irradiated during two18-month cycles, b) Zr1Nb0.3Sn0.1Fe irradiated
during two 18-month cycles, c) Q12™ irradiated during two 18-month cycles, d) M5®
24
FIG. 17: Micrographs with g=0002 diffracting vector: <c>-component loops, a) Q12™ irradiated during four 18-month cycles, b) M5® irradiated during six annual cycles
25
FIG. 18: Evolution of <c>-loop linear density versus fast neutron fluence for M5®,
Q12™, Zr1Nb0.3Sn0.1Fe, Zr1Nb0.3Sn0.2Fe and RXA Zy-4 alloys claddings.
DISCUSSION
Laves phases
Influence of the alloy content on the Laves phase composition
According to different authors [30,31] the Laves phase composition extends over a range of 25 to 36% Fe, and 29 to 41% Nb (at.%). In our study the Laves phase composition extends over a range of 26 to 28 at.% Fe and 36 to 38 at.% Nb [4] in agreement with the literature. The ratio Nb/Fe of the Laves phases is quite similar in M5®, Q12™ and Zr1Nb0.3Sn0.1Fe alloys, as seen in TABLE 2, according to thermodynamics and phase diagrams when the equilibrium phases are Zr, Nb and C14 Laves phases. The Nb/Fe ratio of Zr1Nb0.3Sn0.2Fe alloy Laves phase is slightly lower than in the three other materials due to the presence of an additional stable phase (Zr,Nb)4Fe2 enabled by the higher iron content. Some Laves phases Zr(Fe,Nb)2, with the
same crystallographic parameters and with the composition 35Zr-35Nb-30Fe at.% were observed in the Russian alloy E635 (Zr-1Nb-1.2Sn-0.35Fe), with a ratio Nb/Fe=1.2 similar to the Zr1Nb0.3Sn0.2Fe alloy [10]. In E635, with a higher iron content than Zr1Nb0.3Sn0.2Fe, (Zr,Nb)4Fe2 SPPs are observed as well. Stacking faults were also observed.
Some authors attest that before irradiation there is always some amount of chromium in Laves phase SPPs, even if only 100 ppm Cr is contained in the material [32]. It seems to be the case in the studied alloys with about 1 at% of chromium present in the Laves phases before irradiation.
Loss of iron from Laves phases under irradiation
The literature tends to agree that the Laves phases Zr(Fe,Nb)2 lose their iron very quickly during
irradiation whatever their initial iron content. They become Zr-Nb micro-crystallized highly faulted particles, similar to those observed on FIG. 8, and then transform into Nb particles [10,11,13,14,22,32]. The periphery of precipitates is more depleted in iron than the central part [10,32]. No amorphization of these SPPs was seen, excepted for the very low irradiation
26
temperature of 60°C [23]. According to ATEM analyses on extraction replica, small particles up to 150 nm are depleted in iron to a greater extent than the coarse ones [10].
The ATEM analyses on thin foils did not permit determination whether smaller particles are more depleted in iron than the bigger ones. But micro-crystallized particles were observed as soon as two 18-month cycles of irradiation. The core of the SPPs has a homogeneous composition and contains only a few w% iron versus 20 w% before irradiation. The ratio Nb/Fe in the core is 10 versus 2.2 before irradiation. On the periphery of the SPPs, the observed micro-crystallites contain neither iron nor chromium. After four 18-month cycles the precipitates have lost all the iron and chromium they contained. These observations completely agree with the literature with a rapid loss of iron from the Laves phases.
Laves phase transformation into Nb during irradiation
Russian authors suggested the Laves phases transform into Nb during irradiation [10,13,14]. This was recently ascertained thanks to Y-NBED diagrams (Precession NanoBeam Electron Diffraction) [32]. For the Russian authors the transformation of Laves Phases in Nb particles occurs at a dose of about 10 dpa [10], when the SPP iron content is too low (a few %) to stabilize the hexagonal structure. This phase transformation is assumed to induce the polycrystalizing of the particles. Thus this phenomenon will probably occur first at the periphery of the SPPs where the polycrystalizing of the particles is initially observed.
In this study, the samples irradiated during two 18-month cycles have an irradiation dose close to 10 dpa. In these samples the Laves phase precipitation gives micro-crystallized diffraction diagrams that are very difficult to be indexed. However some of these diagrams were indexed as hexagonal Laves phases. Therefore, at least part of the SPP (probably the core of the particle) keeps its original microstructure despite the drastic loss of iron. But no diffraction diagram can be indexed in Laves phases after four 18-month cycles of irradiation (about 20 dpa). Therefore, these results completely agree with the literature. These observations show that the transformation is not homogeneous: the change seems to begin at the periphery of the particles and probably grows progressively toward the core of the particles, as the ratio Fe/(Fe+Nb) reaches a critical value. According to previous studies, this critical value is 0.3 [10] in un-irradiated materials. In the current study the ratio Fe/(Fe+Nb) in the core of the analyzed particle (0.15) is close to the expected value. The fact that its value is lower than expected is probably due to the SPP periphery contribution. Iron and chromium seem to be totally rejected out of the Nb precipitates formed from the former Laves phase particles, whereas chromium did not diffuse significantly out of the SPPs before the change into the cubic structure. Previous studies showed chromium remains partially in the SPPs as clusters [32]. These clusters are probably formed during the change from the hexagonal to the cubic structure when the chromium is rejected from the newly-formed Nb crystallites.
<c>-component loops
<c>-component loops and growth breakaway
Several authors associate the growth breakaway phenomenon with the <c>-component loop occurrence [7,8,12,15]. As it was recalled by Simonot [33], the difference in anisotropy of diffusion (DAD) could explain the growth phenomenon and the three regions observed in FIG. 3. The DAD was not demonstrated, but this mechanism was supposed to modify the bias of point defect annihilation on the dislocations, depending on their crystallographic orientation. When the dislocation density is low (RXA material in the beginning of irradiation), the annihilation of the point defects is supposed to occur at grain boundaries parallel to the basal
27
planes for the vacancies, and at grain boundaries parallel to the prismatic planes for the interstitials, resulting in a high-rate growth phenomenon. When the density of <a> loops is high, they become dominant sinks for the point defects. Their bias of annihilation is very low and leads to a decrease in the growth speed for the RXA materials. But when the <c>-component loops appear, the vacancies are supposed to be absorbed preferentially on these basal defects, leading to a higher growth speed.
Nevertheless, it seems clear that the growth breakaway does not take place as soon as the <c>-component loops appear [10,11]. In addition, while looking at FIG. 18, there is no indication of an inflexion point of the linear <c>-component loop density curve, corresponding to the growth breakaway occurrence (10x1025 n/m2 in PWR conditions for RXA Zy-4 (E>1 MeV) [9]). Therefore, there seems to be no direct correlation between the growth curve and the <c>-component loop linear density evolution versus fluence. Rather, it appears that it is necessary to reach a critical value of <c>-component loop linear density in order to observe the growth breakaway phenomenon in RXA materials. According to previous studies, this critical value of linear density seems to be ~1x10¹⁴ m/m3 for cladding-tubes [10,11]. In this case the <c>-component loop linear density is in the same order of magnitude as the <a> loop linear density [11]. Thus it seems necessary to reach a <c>-component loop linear density value that is comparable with the <a> loop one, to induce an annihilation bias of the vacancies high enough to enhance the growth phenomenon. We can suppose that if the <c>-component loop linear density versus fluence curve slope is lower, the critical value of <c>-component loop linear density for the growth breakaway of 1x10¹⁴ m/m3 will be reached later and the growth breakaway (if there is one) will be delayed.
FIG. 18 is showing a similar <c>-component loop density for Q12™, Zr1Nb0.3Sn0.1Fe and M5® alloys9.This leads to the conclusion that, if there is a growth breakaway for Q12™ and for Zr1Nb0.3Sn0.1Fe cladding tubes (with 1000 ppm of iron), it should occur at about the same fluence as for M5® alloy. This growth breakaway (if there is one) will occur at a much higher fluence than the usual fuel assembly fluence irradiation range [11]. The Zr1Nb0.3Sn0.2Fe alloy with 2000 ppm of iron seems to contain fewer <c>-component loops than the three other alloys, and one can suppose that its growth breakaway (if there is one) will be delayed. The similar growth behavior of Zr1Nb0.3Sn0.1Fe, Q12™ and M5® alloys up to high fluences seems to be confirmed by the free growth curve shown in FIG. 3. The lower <c>-component loop linear density of Zr1Nb0.3Sn0.2Fe alloy is consistent with a lower free growth compared to M5®
alloy at high fluences ~18x1025 n/m² and with the observation of a small delay in the free growth acceleration as seen FIG. 3. Thus our observations seem in agreement with Shishov [10] and with the conclusions of S. Yagnik et al. [34] concerning the influence of iron on the growth breakaway. According to Shishov [10] the quaternary alloy E635 has about the same growth behavior as the Zr1Nb alloy E110 if it contains between 1000 and 1500 ppm of iron. For higher iron content the growth breakaway occurrence is delayed.
Iron rejection from the SPPs into the matrix and <c>-component loop density
In Zy-4 alloy, the <c>-component loops appear clearly correlated to iron re-distribution into the matrix from the Zr(Fe,Cr)2 SPPs [7,16,17]. Y.de Carlan et al. [17] observed a segregation of
iron in the <c>-component loop planes on Zy-4 thin foils implanted with iron and irradiated in a 1-MeV transmission electron microscope. Iron is known to display an ultra-fast diffusion rate
9The <c>-loop linear density in Q12™ is lower but in the same order of magnitude as M5®. The difference in
<c>-component loop linear density between M5® and the quaternary alloys with 0.1% iron is small compared to
the scattering of the measure and to the difference between Zy-4 and M5®. In addition the quaternary alloys are
28
in Zr which has been explained by a mechanism of interstitial Fe/vacancy pairing [32], and diffuses preferentially along the <c> axis. Thus it seems reasonable to suppose iron will enhance the vacancy diffusion along the <c> axis. In addition, iron in solid solution is assumed to locally modify the c/a ratio and to enhance the <c>-component loop nucleation by lowering the stacking fault energy [7]. In a Zy-4 type alloy, the <c>-component loops appear first in the vicinity of the Laves phase SPPs Zr(Fe,Cr)2 [7] and then span the entire grain at higher fluences
[15]. In M5® alloy, <c>-component loops are observed despite the very low iron content but
they are much less numerous than in Zy-4 alloy and are not more numerous in the vicinity of prior Laves phase precipitates [11,15]. It is tempting to believe that the low <c>-component loop density of M® alloy is due to its low iron content, but it seems more complex because
quaternary alloys contradict this hypothesis.
In the quaternary alloys studied here, the <c>-component loop occurrence is significantly correlated to the Laves phase SPPs, as in a low-dose irradiated Zy-4, in agreement with previous studies [7,13,14,22]: this correlation is expressed locally by a higher density of <c>-component loops at the vicinity of the Laves phases. The quaternary alloys, and particularly the Zr1Nb0.3Sn0.2Fe alloy and some of the Russian alloys [10], contain significantly more iron than M5®. This iron is initially in the Zr(Nb,Fe)2 Laves phase and is almost totally rejected from
the SPPs into the matrix as early as two 18-month cycles (~10 dpa). This iron rejection occurs in a much faster way in quaternary alloys than in Zy-4 alloy in PWR conditions: the Zr(Fe,Cr)2
Laves phases in Zy-4 alloy, with a bigger diameter than the Zr(Fe,Nb)2 SPPs, are only partially
amorphized after an irradiation at a dose of 14 dpa and a temperature of 320°C [7]. Nevertheless the <c>-component loop linear density of these quaternary alloys is much lower than that of the Zy-4 (FIG. 18) and the growth breakaway will occur at higher fluence than for Zy-4. Thus we can conclude that there is a correlation between the iron rejection from the SPPs to the matrix and the <c>-component loop nucleation in the quaternary and in the Zy-4 alloys. But this correlation is very complex and not elucidated [32].
According to the studies on Zr1Nb and on quaternary alloys, it seems that a higher iron content, with the presence of niobium and tin, result in a lowering of the <c>-component loop density. According to Idrees et al. [35], the solute elements such as iron, niobium and tin, play a big role in the <c>-component loop occurrence. The substitutional elements such as the niobium in solid solution, could modify the point defect mobility and enhance the vacancy/interstitial recombination, especially with the presence of tin. According to Shishov [10], tin and iron elements in solid solution in the Zr-Nb matrix could induce internal stress and delay the <c>-component loop nucleation and growth.
Radiation-enhanced
Nb particles
Nb rich radiation-enhanced precipitates have a potential role in <c>-component loop formation. At first they lead to a noticeable decrease of the niobium content in the matrix [11]. This decrease could be in favor of <c>-component loop formation: Nb in solid solution could form complex Nb-Fe compounds, and acting as sinks for vacancies, they could diminish the velocity of vacancies [22]. Then, these nanometric precipitates are suspected to be sinks for vacancies and to delay vacancy <c>-component loop nucleation.
The radiation-enhanced Nb particles seems to have a similar behavior in M5® and in the quaternary alloys, with a density ~1.5x10²² m-3, an average length of ~7 nm and an average
width of ~3 nm. The density and the dimensions of the particles do not change between two and four 18-month cycles, comparable to previous observations in the M5® alloy at similar fluences. Thus the addition of iron and tin in this range of content seems to have no significant influence on the radiation-enhanced Nb particles.
29
Shishov [10] noticed a lower radiation-enhanced particle size and a stronger spatial orientation of these particles when the iron and the tin contents in solid solution are higher, because these elements in solid solution can induce internal stress. In a previous study we observed a strong spatial orientation of these particles due to the stress as well. But it was an external stress imposed by the fuel pellet on the cladding tubes and no decrease of the radiation-enhanced particle size was seen [11]. According to Shishov this phenomenon will occur for iron content higher than 1500 ppm. In this study there is neither enhanced spatial orientation nor any reduction in size of the particles in the Q12™ and in the Zr1Nb0.3Sn0.1Fe alloys compared to the M5® alloy, but the iron content of these two quaternary alloys is below 1500 ppm. For the
Zr1Nb0.3Sn0.2Fe alloy with iron content higher than 1500 ppm, the radiation-enhanced particles size seems slightly lower than in the three other materials. But it is worth noticing that this difference in size is lower than the measured scattering. This slightly lower size could be explained by the presence of (Zr,Nb)4Fe2 particles that are known to reduce the niobium content
in solid solution [10].
CONCLUSION
The present study focused on the microstructural evolution of the irradiated Q12™ cladding tubes. After irradiation in PWR condition all the SPPs of the material (Nb and Laves phase SPPs) remain crystalline. The Laves phase SPPs lose almost all their iron content after only two 18-month cycles and are composed of two parts: a micro-crystallized periphery with no iron and no chromium (probably transformed into Nb microstructure) and a core with its original hexagonal structure despite its drastic loss of iron. After four 18-month cycles all the Laves phases seem to have transformed into Nb and lost all their iron and chromium content. These observations completely agree with the literature describing a rapid rejection of iron from the Laves phases into the matrix.
<c>-component loops seem a little smaller and less numerous in the quaternary alloys than in M5® alloy irradiated with a similar fluence. These basal defects are strongly correlated to Laves phases in the quaternary alloys and are not in the M5® alloy. They appear significantly less
numerous in the Zr1Nb0.3Sn0.2Fe alloy (containing 2000 ppm iron) than in the two other quaternary alloys. This leads to the conclusion that if there is a growth breakaway for Q12™ and for Zr1Nb0.3Sn0.1Fe cladding tubes with 1000 ppm of iron, it should occur at about the same fluences as for M5® alloy, that is at a much higher fluence than the usual FA fluence irradiation range. For the Zr1Nb0.3Sn0.2Fe cladding tubes with 2000 ppm of iron one can suppose that their growth breakaway (if there is one) will be delayed. All of these conclusions are consistent with the free growth curve shown in FIG. 3.
From this study it is evident that there is a correlation between the iron rejection from the SPPs to the matrix and the <c>-component loop nucleation in the quaternary and in the Zy-4 alloys: this correlation is expressed locally by a higher density of <c>-component loops at the vicinity of the Laves phases. However this correlation is very complex and not elucidated. Indeed the quaternary alloys contain 1000 to 2000 ppm iron that is very quickly rejected from the SPPs into the matrix and have as few <c>-component loops as the M5® alloy with 350 ppm iron. Thus the studies on Zr1Nb and on the quaternary alloys seem to show that increasing the iron content with the presence of niobium and tin will paradoxically decrease the <c>-component loop linear density and probably delay the growth breakaway. Our observations are in agreement with Shishov [10] and with the conclusions of Yagnik et al. [34] concerning the influence of iron at high content (2000 ppm) on the growth breakaway.
30
Acknowledgement:
The authors are grateful to the staff (CEA-DANS-DEN-DMN) for their assistance in the area of TEM examination: Th. Vandenberghe, B. Arnal.
31
LIST OF FIGURE CAPTIONS
FIG. 1: Microstructure of Q12™ alloy a) general view, b) second phase precipitates. FIG. 2: a) Morphological aspects of Laves phases and Nb SPPs. Stacking faults in Laves
Phases, b) bright field, c) dark field.
FIG. 3: a) Free growth of Zr-1Nb-0.3Sn-0.1Fe, Zr-1Nb-0.3Sn-0.2Fe, Q12™ and M5® tubes in D24 power plant, b) Free growth of RXA Zy-4 and M5® tubes in D65 power plant. FIG. 4: General views of a) Q12™ alloy irradiated during two 18-month cycles, b)
Zr1Nb0.3Sn0.1Fe alloy irradiated during two 18-month cycles, c) Zr1Nb0.3Sn0.2Fe alloy irradiated during two 18-month cycles, d) M5® alloy irradiated during four annual cycles (7x1025 nm-2). Arrows indicates hydrides.
FIG. 5: General views of a) Q12™ alloy irradiated during four 18-month cycles, b) M5® alloy irradiated during six annual cycles (12.4x1025 nm-2). Arrows indicates hydrides. FIG. 6: Former Laves phase in Q12™ alloy irradiated during two 18-month irradiation cycles. FIG. 7: Former Laves phase in Q12™ alloy irradiated during four 18-month irradiation cycles,
a) bright field, b) dark field.
FIG. 8: SPPs and <c>-component loops. Micrographs with g=0002 diffracting vector, a) M5® alloy irradiated during seven annual cycles [11], b) Zr1Nb0.3Sn0.1Fe alloy irradiated during two 18-month cycles, c) Zr1Nb0.3Sn0.2Fe alloy irradiated during two 18-month cycles, d) Q12™ irradiated during two 18-month cycles, e) Q12™ irradiated during four 18-month cycles. Arrow indicate location of Nb particles.
FIG. 9: Microanalyses on SPPs in Q12™ alloy (w %), a) non irradiated, b) irradiated during 2 18-month cycles, c) irradiated during 4 18-month cycles.
FIG. 10: Concentration profile across a former Laves phase SPP in Zr1Nb0.3Sn0.1Fe alloy irradiated during two 18-month cycles, a) concentration profile (w%), b) micrograph. FIG. 11: Micrographs with g=0002 diffracting vector s>>0 of nanometric radiation-enhanced
particles of Nb, a) Zr1Nb0.3Sn0.2Fe alloy irradiated during two 18-month cycles, b) Zr1Nb0.3Sn0.1Fe alloy irradiated during two 18-month cycles, c) Q12™ alloy irradiated during two 18-month cycles, d) M5® alloy irradiated during four annual cycles (7x1025 nm-2), e) Q12™ alloy irradiated during four 18-month cycles, f) M5® alloy irradiated during six annual cycles (12.4x1025 nm-2).
FIG. 12: Number density of radiation-enhanced precipitation in Q12™ and in Zr1Nb0.3Sn0.2Fe alloys versus fast neutron fluence, compared to M5® alloy from ref. [11].
FIG. 13: Length and width of radiation-enhanced precipitation in Q12™, in Zr1Nb0.3Sn0.1Fe and in Zr1Nb0.3Sn0.2Fe versus fast neutron fluence, compared to M5® from ref. [11]. FIG. 14: Histograms of width and length of radiation-enhanced particles. Comparison between
Q12™ and M5® alloy a) Length, b) Width.
FIG. 15: Histograms of width and length of radiation-enhanced particles. Comparison between Q12™ alloy and the two other quaternary alloys a) Length, b) Width
FIG. 16: Micrographs with g=0002 diffracting vector: <c>-component loops a) Zr1Nb0.3Sn0.2Fe irradiated during two 18-month cycles, b) Zr1Nb0.3Sn0.1Fe irradiated during two 18-month cycles, c) Q12™ irradiated during two 18-month cycles, d) M5® irradiated during four annual cycles (7x1025 nm-2).
FIG. 17: Micrographs with g=0002 diffracting vector: <c>-component loops, a) Q12™ irradiated during four 18-month cycles, b) M5® irradiated during six annual cycles (12.4x1025 nm-2).
FIG. 18: Evolution of <c>-loop linear density versus fast neutron fluence for M5®, Q12™,
32
References
[1] Mardon, J.P., Garner, G., Beslu, P., Charquet, D.,“Update on the Development of Advanced Zirconium Alloys for PWR Fuel Rod Claddings,” ANS Portland, 2-6 March 1997, pp. 405-412.
[2] Mardon, J.P., et al., “Optimization of PWR Behaviour of Stress-relieved Zircaloy-4 Cladding Tubes by Upgrading the Manufacturing and Inspection Process,” Zirconium in the
Nuclear Industry: Tenth International Symposium, ASTM STP 1245, ASTM International,
West Conshohocken, PA, 1994, pp. 329-348.
[3] Ravier, G., et al., “Framatome and FCF Recent Operating Experience and Advanced Features to Increase Performance Reliability,” ANS Portland, 2-6 March 1997, pp. 31-38. [4] Chabretou, V., Hoffmann P. B., Trapp-Pritsching,S., Garner, G., Barberis, P., Reyberolle,
V., Vermoyal, J.J, “Ultra Low Tin Quaternary Alloys PWR Performance-Impact of Tin Content on Corrosion Resistance, Irradiation Growth and Mechanical Properties”,
Zirconium in the Nuclear Industry: Sixteenth International Symposium, ASTM STP 1529,
ASTM International, West Conshohocken, PA, 2012, pp. 801-826.
[5] S. Trapp-Pritsching, V. Chabretou, C.P. Scott, H.J. Sell, N. Teboul, “Ultra low tin
Zr1NbSnFe quaternary alloys- perspectives for structural components in PWR Fuel assemblies”, Proceedings of Topfuel 2012, pp. 417-421
[6] V. Chabretou, S. Trapp-Pritsching, “Q12 ultra low tin quaternary alloy for structural
components in PWR fuel assemblies”, Proceeding of Topfuel 2015, pp. 151-159
[7] Gilbon, D. and Simonot, C., “Effect of irradiation on the Microstructure of Zircaloy-4”,
Zirconium in the Nuclear Industry: Tenth International Symposium, ASTM STP 1245,
ASTM International, West Conshohocken, PA, 1994, pp. 521-548
[8] Gilbon, D., Soniak, A., Doriot, S., and Mardon, J.P., “Irradiation Creep and Growth Behaviour, and Microstructural Evolution of Advanced Zr-Base Alloys,” Zirconium in the
Nuclear Industry: Twelfth International Symposium, ASTM STP 1354, ASTM
International, West Conshohocken, PA, 2000, pp. 51-73.
[9] Doriot, S., Gilbon, D., Béchade, J. L., Mathon, M. H., Legras L., Mardon J.P., “Microstructural Stability of M5™ Alloy Irradiated up to High Neutron Fluences,”
Zirconium in the Nuclear Industry: 14th International Symposium, ASTM STP 1467, ASTM
International, West Conshohocken, PA, 2006, pp. 175-201
[10] Shishov V.N. “The Evolution of Microstructure and Deformation stability in Zr-Nb-(Sn, Fe) Alloys under Neutron Irradiation”, Zirconium in the Nuclear Industry: Sixteenth
International Symposium, ASTM STP 1529, ASTM International, West Conshohocken,
PA, 2012, pp. 37-66.
[11] Doriot, S., Verhaeghe, B., Béchade, J.-L., Menut, D., Gilbon, D., Mardon, J.-P., Cloué, J.-M., Miquet, and A., Legras, L., “Microstructural Evolution of M5 Alloy Irradiated in PWRs up to High Fluences. Comparison with Other Zr-Based Alloys”, Zirconium in the
Nuclear Industry: 17th International Symposium, STP 1543, ASTM International, West
Conshohocken, PA, 2015, pp. 759-799.
33
[12] Shishov, V. N., Nikulina, A.V., Markelov, V. A., Peregud, M. M., Kozlov, A. V.,
Averin, S.A., Kolbenkov, S. A., Novoselov, A. E., “Influence of Neutron Irradiation and Dislocation Structure and Phase Composition of Zr-Base Alloys,” Eleventh International
Symposium, ASTM STP 1295, ASTM International, West Conshohocken, PA, 1996, pp.
603-622.
[13] Shishov, V.N., Peregud, M.M., Nikulina, A.V., Kon’kov, V. F, Novikov, V. V., Markelov, V. A., Khokhunova, T. N., Kobylyansky, G. P., Novoselov, A. E., Ostrovky, Z. E. and Obukhov, A. V., “Structure-Phase State, Corrosion and Irradiation Properties of Zr-Nb-Fe-Sn System Alloys,” Zirconium in the Nuclear Industry : 15th International Symposium, ASTM STP 1505, ASTM International, West Conshohocken, PA, 2009, pp. 724-743. [14] Shishov, V.N., Peregud, M.M., Nikulina, A.V., Pimenov, Yu. V, Kobylyansky, G.P.,
Novoselov, A.E., Ostrovsky, Z.E. and Obukhov, A.V. “Influence of Structure-Phase State of Nb Containing Zr Alloys on Irradiation-Induced Growth,” Zirconium in the Nuclear
Industry: 14th International Symposium, ASTM STP 1467, ASTM International, West
Conshohocken, PA, 2006, pp. 666-685.
[15] Bossis, P., Verhaeghe, B., Doriot, S., Gilbon, D., Chabretou, V., Dalmais, A., Mardon, J.P., Blat, M., Miquet, A., “In PWR Comprehension Study of High Burn-up corrosion and Growth Behavior of M5®and recrystallised Low-Tin Zircaloy 4,” Zirconium in the Nuclear
Industry: Fifteenth International Symposium, ASTM STP 1505, ASTM International, West
Conshohocken, PA, 2009, pp. 430-456.
[16] Griffiths, M., “A review of microstructure evolution in zirconium alloys during irradiation”, Journal of Nuclear Materials, Vol. 159, 1988, pp. 190-218.
[17] de Carlan, Y ., Regnard, C., Griffiths, M., Gilbon, D., Lemaignan, C. “Influence of iron in the nucleation of the <c> component dislocation loops in irradiated zircaloy-4,” Zirconium
in the Nuclear Industry: Eleventh International Symposium, ASTM STP 1295, ASTM
International, West Conshohocken, PA, 1996, pp. 633-638
[18] Motta AT, Howe LM, Okamoto PR, “Amorphisation Kinetics of Zr(Cr,Fe)2 under ions
irradiation”, Beam Solid Interactions: Fondamentals and applications, Book Series :
Material Research Society Symposium Proceedings, Vol. 279, 1993, pp. 517-522.
[19] D. Pêcheur, F. Lefebvre, AT. Motta, C. Lemaignan and D. Charquet, “Effect of irradiation on the precipitate stability in Zr alloys”, Journal of Nuclear Materials, Vol. 205, 1993, pp. 445-451.
[20] Coleman, C. E., Gilbert, R.W., Carpenter, G. J. C. and Weatherly, G. C., “Precipitation in Zr-2.5 wt% Nb during Neutron Irradiation”, Phase Stability During Irradiation
Symposium, Pittsburgh, Oct 5-9 1980, The Metallurgical Society of AIME, 1981, pp.
587-599.
[21] Perovic, V., Perovic, A., Weatherly, G. C., Brown, L. M., Purdy, G. R., Fleck, R. G. and Holt, R. A., “Microstructural and Microchemical Studies of Zr-2.5Nb Pressure Tube Alloy”,
Journal of Nuclear Materials, Vol. 205, 1993, pp. 251-257.
[22] Shishov, V. N., Nikulina, A.V., Markelov, V. A., Peregud, M. M., Kozlov, A. V., Averin, S.A., Kolbenkov, S. A., Novoselov, A. E., “Influence of Neutron Irradiation and
34
Dislocation Structure and Phase Composition of Zr-Base Alloys”, Zirconium in the
Nuclear Industry: Seven International Symposium, ASTM STP 939, ASTM International,
West Conshohocken, PA, 1987, pp. 603-622.
[23] Shishov, V. N., Peregud, M. M., Nikulina, A. V., Sheballdov, P. V., Tselischev, A. V., Kobylyansky, G. P., Ostrovsky, Z. E., and Shamardin, V. K., “Influence of Zirconium Alloy Chemical Composition on Microstructure Formation and Irradiation Induced Growth”, Zirconium in the Nuclear Industry: 13th International Symposium, ASTM STP 1423, ASTM International, West Conshohocken, PA, 2002, pp. 759-779.
[24] Sarce, A., “Stability of Precipitates in the anisotropic -Zr Matrix under Irradiation”,
Journal of Nuclear Materials, Vol. 185, 1991, pp. 214-223.
[25] Turkin, A. A., Buts, A.V., Bakai, A. S., “Construction of Radiation-modified Phase Diagrams under Cascade-producing Irradiation”, Journal of Nuclear Materials, Vol. 305, 2002, pp. 134-152.
[26] Potter, D.I. and Wiedersich, H., “Mechanisms and kinetics of precipitate restructuring during irradiation”, Journal of Nuclear Materials, Vol. 273, 1999, pp 208-213
[27] Brebec, G., “Diffusion and Precipitation under Irradiation” A. L. Laskar et al. (eds;),
Diffusion in Materials, 1990, pp. 339-336 Kluwer Academic Publisher. Printed in the
Netherlands.
[28] Zhou, L., Li, S. X., Chen, C. R., Wang, Y. C., Zang, Q. S. and Lu, K.,
“Three-dimensional finite element analysis of stresses and energy density distribution around ’ before coarsening loaded in the [110]-direction in Ni-based superalloy”, Material Science
and Engineering A, Vol. 352, Issues 1-2, 2003, pp. 300-307.
[29] Averin, S., A., Panchenko, V., L., Kozlov, A., V., Sinelnikov, L., P., Shishov, V., N. and Nikulina, A., V., “Evolution of Dislocation and Precipitate Structure in Zr Alloys Under Long-Term Irradiation”, Zirconium in the Nuclear Industry: Twelfth International
Symposium, ASTM STP 1354, ASTM International, West Conshohocken, PA, 2000, pp.
105-121.
[30] Toffolon, C., and Brachet, J.-C., Servant, C., Legras, L.,Charquet, D., Barberis, P., and Mardon, J.-P., “Experimental Study and Preliminary Thermodynamic Calculations of the Pseudo-Ternary Zr-Nb-Fe-(O,Sn) System,” Zirconium in the Nuclear Industry: 13th
International Symposium, ASTM STP 1423, ASTM International, West Conshohocken,
PA, 2002, pp. 361-383.
[31] Toffolon-Masclet, C., Barberis, P., Brachet, J. C., Mardon, J. P. and Legras, L., “Study of Nb and Fe Precipitates in a-Phase Temperature Range (400 to 550C) in Zr-Nb-(Fe-Sn) Alloys,” Zirconium in the Nuclear Industry: 14th International Symposium, ASTM STP 1467, ASTM International, West Conshohocken, PA, 2006, pp. 81-101
[32] E.M. Francis, A. Harte, P. Frankel, S.J. Haigh, D. Jädernäs, J. Romero, L. Hallstadius, M. Preuss, “Iron redistribution in a zirconium alloy after neutron and proton irradiation studied by energy-dispersive X-ray spectroscopy (EDX) using an aberration-corrected (scanning) transmission electron microscope”, Journal of Nuclear Materials, 454 vol. 1-3, 2014, pp 387-397.
35
[33] C. Simonot, “Evolution microstructurale des alliages de zirconium sous irradiation - Liens avec le phénomène de croissance“, Thèse présentée à l'Université de Paris Sud (juillet 1995).
[34] S. Yagnik, R. Adamson, G. Kobylyansky, J-H. Chen, D. Gilbon, S. Ishimoto, T. Fukuda, L. Hallstadius, A. Obukhov, and S. Mahmood,”Effect of Alloying Elements, Cold Work, and Hydrogen on the Irradiation Growth Behavior of Zirconium Alloy Variants”,
accepted paper in Zirconium in the Nuclear Industry: 18th International Symposium
[35] Y. Idrees, E. M. Francis, Z. Yao, A. Korinek, M. A. Kirk, M. Sattari, M. Preuss, M. R. Daymond, “Effect of alloying elements on the formation of <c>-component loops in Zr alloy Excel under heavy ion irradiation”, Journal of Material Research, 30 N° 9, 2015, pp. 1310-1334
![TABLE 1: Nominal composition of the studied materials compared to M5 ® [4] and to RXA Zy-4 [11] in w% Sn Fe Cr 7 Nb M5 ® < 100 ppm 0.035 - 1 Zr1Nb0.3Sn0.1Fe 0.3 0.1 - 1 Zr1Nb0.3Sn0.2Fe 0.3 0.2 - 1 Q12™ 0.5 0.1 - 1 RXA Zy-4 [11]](https://thumb-eu.123doks.com/thumbv2/123doknet/12680621.354384/4.892.175.721.407.678/table-nominal-composition-studied-materials-compared-rxa-rxa.webp)
![FIG. 8: SPPs and <c>-component loops. Micrographs with g=0002 diffracting vector, a) M5 ® alloy irradiated during seven annual cycles [11], b) Zr1Nb0.3Sn0.1Fe alloy irradiated during two 18-month cycles, c) Zr1Nb0.3Sn0.2Fe alloy irradiated during](https://thumb-eu.123doks.com/thumbv2/123doknet/12680621.354384/14.892.109.771.105.814/component-micrographs-diffracting-vector-irradiated-annual-irradiated-irradiated.webp)