HAL Id: hal-01401626
https://hal.sorbonne-universite.fr/hal-01401626
Submitted on 23 Nov 2016
HAL is a multi-disciplinary open access
archive for the deposit and dissemination of
sci-entific research documents, whether they are
pub-lished or not. The documents may come from
teaching and research institutions in France or
abroad, or from public or private research centers.
L’archive ouverte pluridisciplinaire HAL, est
destinée au dépôt et à la diffusion de documents
scientifiques de niveau recherche, publiés ou non,
émanant des établissements d’enseignement et de
recherche français ou étrangers, des laboratoires
publics ou privés.
Mapping intracellular mechanics on micropatterned
substrates
Kalpana Mandal, Atef Asnacios, Bruno Goud, Jean-Baptiste Manneville
To cite this version:
Kalpana Mandal, Atef Asnacios, Bruno Goud, Jean-Baptiste Manneville.
Mapping intracellular
mechanics on micropatterned substrates. Proceedings of the National Academy of Sciences of the
United States of America , National Academy of Sciences, 2016, 113 (46), pp.E7159 - E7168.
�10.1073/pnas.1605112113�. �hal-01401626�
1
Mapping intracellular mechanics on micropatterned substrates
Kalpana Mandal
1,2,3, Atef Asnacios
4, Bruno Goud
1,2, Jean-Baptiste Manneville
1,2,+1 Institut Curie, PSL Research University, CNRS, UMR 144, 26 rue d’Ulm F-75005, Paris, France 2
Sorbonne Universités, UPMC University Paris 06, CNRS, UMR 144, 26 rue d’Ulm F-75005, Paris, France
3
University of Pennsylvania, Institute for Medicine and Engineering, 1080 Vagelos Research Labs, Philadelphia-19104, USA
4
Laboratoire MSC, CNRS-Université Paris Diderot, Sorbonne Paris Cité, 10 rue Alice Domon et Léonie Duquet, 75205 Paris cedex 13, France
+: to whom correspondence should be addressed (email: [email protected], phone: 33 1 56 24 65 64, fax: 33 1 56 24 64 21)
Keywords: microrheology, optical tweezers, viscoelasticity, cytoskeleton, active forces, membrane, cancer, micropatterning, spatial analysis, power law, standard linear liquid
2
Significance statement
Cell mechanics is crucial for many, if not all, cell functions. Although mechanics at the scale of the whole cell is extensively documented, there are only few methods to measure intracellular mechanics at the local scale. Here we develop a technique that allows us 1) to map the spatial variations of intracellular mechanical parameters; 2) to study how the actin and microtubule cytoskeleton, intracellular membranes and ATP-dependent active forces contribute to intracellular mechanics; and 3) to differentiate normal and cancer cells. Because intracellular mechanical maps can detect subtle differences in the spatial distribution of mechanical parameters even in the absence of any change in their average values, our approach could provide a new diagnostic and prognostic tool for cancers.
Abstract
The mechanical properties of cells impact on their architecture, their migration, intracellular trafficking and many other cellular functions and have been shown to be modified during cancer progression. We have developed an approach to map the intracellular mechanical properties of living cells by combining micropatterning and optical tweezers-based active microrheology. We optically trap micron-sized beads internalized in cells plated on crossbow-shaped adhesive micropatterns and track their displacement following a step displacement of the cell. The local intracellular complex shear modulus is measured from the relaxation of the bead position assuming that the intracellular microenvironment of the bead obeys power-law rheology. We also analyze the data with a standard viscoelastic model and compare with the power-law approach. We show that the shear modulus decreases from the cell center to the periphery and from the cell rear to the front along the polarity axis of the micropattern. We use a variety of inhibitors to quantify the spatial contribution of the cytoskeleton, intracellular membranes and ATP-dependent active forces to intracellular mechanics and apply our technique to differentiate normal and cancer cells.
3
Introduction
Cell mechanics play a crucial role in many cellular functions that are critical during development or are altered during pathologies such as cancers. For instance, cell migration, cell adhesion and cell division have all been shown to depend on cell mechanics (1–5). Most studies have focused on the mechanical crosstalk between the cell and its microenvironment at the whole cell or the tissue level. It has been shown recently that intracellular mechanics could also be used to differentiate cancer cells from normal cells (6–9). Several intracellular elements participate in the mechanical response of the cytoplasm and most of them may be modified during cancer progression. The three types of fibers constituting the cytoskeleton, actin, microtubules and intermediate filaments, clearly contribute to cell mechanics (10–13). The role of internal membranes, molecular crowding or active force generators in the cytoplasm is less documented but could also be significant. During cancer development, signaling associated to the cytoskeleton as well as membrane trafficking, cell polarity and intracellular organization are deregulated (14–16), supporting the idea that the mechanics of the interior of cancer cells could differ from that of normal cells.
Passive or active microrheology techniques have been developed to measure intracellular mechanical properties, mostly based on the tracking of endogenous granules or internalized particles (17–22). The experimental results are generally analyzed using two main classes of models, viscoelastic models with a finite number of viscous (dashpots) and elastic (springs) elements and power-law models (see (23–26) for reviews). An increasing amount of experimental evidence point to weak power-law rheology as a common feature of cell mechanical responses (8, 27–32). Previous experiments and associated modelling have aimed at measuring intracellular mechanical parameters averaged over the whole cell interior. However, the cell interior is an extremely heterogeneous medium characterized by length scales varying on several orders of magnitude from the nanometer scale to the micrometer scale. As a consequence, the intracellular viscoelasticity strongly depends on the position probed within the cell cytoplasm (33–35). The spatial variations of intracellular mechanics are hidden when only cell-averaged parameters are measured while they clearly contain relevant information regarding the internal organization of the cell. In the context of cancer progression, it could thus be crucial to measure not only the averaged intracellular mechanical properties but also their spatial variations.
We have developed an experimental approach to map in a controlled manner, for the first time to our knowledge, the position-dependent rheological properties of the cell interior by combining optical tweezers-based active microrheology (36) with soft lithography micropatterning. Recently experiments with atomic force microscopy (AFM) (34) and AFM or magnetic twisting cytometry combined with micropatterning (37, 38) have been performed but did not discriminate between the mechanical contribution of the prestressed cell cortex and that of the cell interior. In contrast, our approach isolates the contribution of the cell interior. Plating cells on polarized crossbow-shaped adhesive micropatterns allows us to standardize the intracellular organization and reduce cell-to-cell variability (39, 40) and to quantify the spatial variations of the mechanical properties. Using power-law rheology, we analyze the relaxation of internalized microspheres following an imposed displacement in an optical trap and measure
4
the local intracellular complex shear modulus G. The real part of G, the storage modulus G’, is related to the elasticity of the bead microenvironment, while the imaginary part of G, the loss modulus G’’, is related to its viscous-like behavior. We also use the more classical standard linear liquid (SLL) viscoelastic model (19, 41) to analyze the relaxation experiments in terms of viscoelastic components and compare the results with our power-law based model. The resulting maps characterize the spatial variations of the intracellular complex shear modulus and allow us to compare its distribution upon treatments with various drugs or inhibitors. We first map the shear modulus in retinal pigment epithelial (RPE1) cells and quantify the contribution to intracellular mechanics of the actin and microtubule cytoskeletons, ATP-dependent active processes and internal membranes. We further show that breast metastatic cells can be clearly distinguished from non-tumorigenic cells based on the spatial distribution of their mechanical properties.
Results
Microrheological measurements combined with micropatterning to map intracellular
mechanics
Cells plated on adhesive micropatterned substrates are known to exhibit a standardized shape and intracellular organization (40). We took advantage of this property to map intracellular mechanics in cells plated on crossbow-shaped micropatterns (Fig. 1A). Optical tweezers-based microrheology was used to measure intracellular mechanics. Beads were first incubated with cells so that typically one or two beads were internalized by endocytosis and transported to various locations in the cell cytoplasm. After plating and full spreading of the cells on the micropatterns, a step stress was applied to an optically trapped bead by displacing the microscope stage (Fig. 1B). The viscoelastic relaxation of the bead towards the trap center was followed by tracking the position of the bead with time. The initial position of the bead relative to the crossbow micropattern was recorded. This procedure was repeated for a large number of cells in order to sample a maximal area on the micropattern and build the spatial maps (see Materials and Methods and Figs. 1C and S1).
In order to test the robustness of our mechanical maps, the relaxation experiments were analyzed by three independent methods: i) a phenomenological and model-independent approach, ii) a standard viscoelastic model, and iii) a specific analysis based on power law rheology. First we used a phenomenological and model-independent approach as described in (36). Qualitatively, in a rigid microenvironment, the initial bead displacement is large and its relaxation is weak. We measured two parameters to characterize the local intracellular rigidity of the bead microenvironment, the initial bead displacement (Xb) following the step displacement of the microscope stage (Xs=0.5 µm) and the rigidity index (RI) defined as the ratio between the bead displacement (xb(t)) and the stage displacement
integrated along the bead relaxation curve 𝑅𝐼 =∫ 𝑥𝑏 (𝑡) 𝑑𝑡 𝑇 0
𝑋𝑠𝑇 (Fig. S2A). The value of the bead step amplitude Xb is always smaller than Xs and the value of the rigidity index RI falls between 0 and 1. A rigid microenvironment is characterized by Xb≲ Xs and RI≃1, while a soft microenvironment is characterized by
5
Xb ≪ Xs and RI≃0. Although the two measured parameters do not directly relate to usual rheological parameters, they allow to compare the intracellular rigidity in various cellular contexts in a model-independent manner (36).
Second, we considered a simple three elements viscoelastic analytical model (19) composed of a Kelvin-Voigt body (a dashpot and a spring in parallel) and a dashpot in series, known as the standard linear liquid (SLL) model (Fig. S2B and Supplementary Materials and Methods). The relaxation curve of the bead towards the trap center was fitted using this model to determine the local spring constant and dashpot viscosity of the bead microenvironment (Fig. S3 and Supplementary Materials and Methods) in the reference frame of the micropattern.
Third, and most importantly, we developed a theoretical framework based on power-law rheology. We first calculated the Laplace transform 𝑥̃𝑏(𝑠) of the bead displacement xb(t) as in (42). We found (see Materials and Methods): 𝑥̃𝑏(𝑠) =𝜏𝑠𝑋𝑠2
1−𝑒−𝑠𝜏
1+𝜎∗𝑠𝐽̃ for 𝑡 > 𝜏, where the stage step displacement is modelled by a linear increase from 0 µ𝑚 to 𝑋𝑠= 0.5 µ𝑚 between 𝑡 = 0 and 𝑡 = 𝜏 seconds, 𝐽̃ is the Laplace transform of
the creep function 𝐽(𝑡) and 𝜎∗=𝑘𝑡𝑟𝑎𝑝4𝜋𝑅2𝐿𝑐 is a geometrical factor involving the trap stiffness 𝑘𝑡𝑟𝑎𝑝, the bead
radius 𝑅 and a characteristic length 𝐿𝑐. Assuming that the creep function behaves as a power law with an
exponent and a prefactor A, 𝐽(𝑡) = 𝐴𝑡𝛼, we then used inverse Laplace transforms and gamma functions to obtain the bead displacement: 𝑥𝑏(𝑡)
𝑋𝑠 = 𝑡 𝜏∑ [−Γ(1+𝛼)𝜎∗𝐴𝑡𝛼]𝑛 Γ(2+𝑛𝛼) ∞ 𝑛=0 −𝑡−𝜏𝜏 ∑ [−Γ(1+𝛼)𝜎 ∗𝐴(𝑡−𝜏)𝛼]𝑛 Γ(2+𝑛𝛼) ∞ 𝑛=0 . We used this
equation, that we term power-law (PL) model in the following, to fit the relaxation of the bead position 𝑥𝑏(𝑡) as a function of time and measure the prefactor A and the exponent . The complex shear modulus
G= G’+i G’’ was then deduced from A and (see Materials and Methods). The models described above both assume a linear mechanical response of the system. Therefore we checked that the experiments were performed in a linear regime by varying the step size linearly around 𝑋𝑠= 0.5 µ𝑚. We found that the
bead step amplitude Xb increased linearly while none of the mechanical parameters derived from either the SLL model or the power law model significantly differed (Fig. S2 C-E).
We first applied our active microrheology technique to map the complex shear modulus in retinal pigment epithelial (RPE1) cells. When RPE1 cells are plated on crossbow-shaped micropatterns, they adopt a polarized intracellular organization, with the microtubule organizing center and the Golgi apparatus positioned in front of the nucleus which is found on average in the center of the micropattern (Fig. S1B) (40). Three-dimensional imaging of beads internalized in micropatterned cells shows that the bead z-position (5.0±.4 µm) is well distributed within the maximum cell height (10.6 ±0.4 µm) (Fig. S2F-H). A striking feature of the relaxation curves is that they strongly depend on the bead position in the reference frame of the micropattern (Fig. 1D). Both the amplitude of the bead displacement and the dynamics of the relaxation varied with the bead position. To visualize these variations, we generated maps of the storage modulus G’, of the loss modulus G’’, and of the shear modulus G0 defined as the 𝐺0= |𝐺| = |𝐺′+ 𝑖𝐺′′| obtained using the PL model (Fig. 1E). Although the three maps exhibited strong
spatial fluctuations, they clearly showed that the values of the three parameters decrease from the cell center towards the cell periphery. Furthermore, the spatial distribution of shear modulus is polarized along
6
the polarity axis of the crossbow-shaped micropattern (Fig. 1F), with moduli increasing along the cell rear-to-front axis. This is consistent with the distribution of intracellular organelles and cytoskeletal elements reported previously in the same cell type (40, 43). We also note a slight left/right asymmetry in the distribution of the shear modulus (Figs. 1E-F). The map of the ratio G’ /G’’ (Fig. 1E) shows that elasticity
contributes more to cell rigidity than viscosity in agreement with previous results (8, 17, 18, 28) and that the contribution of elasticity relative to viscosity increases towards the cell periphery. The results of the PL model were confirmed by generating maps of the mechanical parameters obtained with the model-independent approach and the SLL model: the rigidity index RI, the bead step amplitude Xb, the spring constant and the viscosity (Fig. S3). Finally, to validate the use of micropatterns, we show that the local values of the rigidity index are less dispersed in cells plated on crossbow-shaped micropatterns than in non-patterned cells (Fig. S3G).
Role of the actin and microtubule cytoskeletons in the spatial distribution of intracellular
viscoelasticity
The cytoskeleton maintains cell architecture, generates forces and contractility and plays an active role in many cellular processes such as cell division or cell migration. Actin and microtubules have been shown to contribute to intra and extracellular mechanics (11, 39, 44–47). To determine the contribution of the cytoskeletal networks to the local intracellular viscoelastic properties, we have focused on actin and microtubules and used drug treatments that affect their dynamics (Fig. S4).
When microtubules were depolymerized with nocodazole, the intracellular shear modulus slightly but significantly decreased compared to non-treated cells. Both the storage and the loss moduli decreased. In contrast, microtubule stabilization by taxol induced a strong increase in the shear modulus (Fig. 2A,B). To investigate the role of actin dynamics, we used two drugs that disrupt microfilament organization with different mechanisms of action, latrunculin A (LatA) which forms 1:1 complexes with monomeric G-actin and cytochalasin D (CytoD) which caps growing ends of microfilaments and disrupts actin organization by increasing the number of actin filament ends and forming aggregates of dense filamentous actin (48). In contrast with microtubules, we did not try stabilizing the actin cytoskeleton because jasplakinolide, the drug classically used to stabilize actin, blocks actin dynamics by disrupting microfilaments and inducing polymerization of monomeric actin into amorphous aggregates and its effects on intracellular mechanics are difficult to interpret (36). While LatA decreased the shear modulus through a strong decrease in both storage and loss moduli, as expected from previous reports (44, 46, 47), CytoD had no significant effect (Fig. 2A,B). Similar results were obtained with the two model-independent parameters, rigidity index and bead step amplitude, or with the spring constant and viscosity derived from the SLL model (Fig. S5A). To investigate further the differences between the effects of LatA and CytoD on intracellular mechanics, we have measured the diffusion coefficient of beads trapped by the optical tweezers in the presence or absence of LatA or CytoD (Fig. 2C). Consistently with the viscoelastic relaxation experiments, we found that beads diffused faster in cells treated with LatA while they diffused slightly slower in the presence of CytoD than in control cells.
7
We next built the spatial maps of the shear modulus (Fig. 3A) and the storage and loss moduli (Fig. S6), as well as the maps of the rigidity index and the bead step amplitude (Fig. S5B) and of the spring constant and viscosity of the SLL model (Fig. S5C). In the presence of the drugs, the maps showed a less regular pattern with more secondary maxima at the periphery of the micropattern. That all drug treatments induced mechanical spatial heterogeneities was further indicated by the shorter auto-correlation length of the drug-treated maps of the rigidity index compared to the control map (Fig. S5D). Because our mapping method uses the center of the micropattern as a reference frame, we also asked how the intracellular rigidity spatially distributes relative to the nucleus. We plotted the variations of the shear modulus as a function of the distance separating the bead and the nuclear envelope (Fig. 3B, see Materials and Methods). In agreement with previous results showing that on average the nucleus is located in the center of the micropattern (40) and consistent with the maps shown in Fig. 1E, we found that the shear modulus decreases with the distance to the nucleus in control conditions (Fig. 3B, left panel) yielding a negative shear modulus gradient (Fig. 3C). Both microtubule depolymerization by nocodazole and stabilization by taxol increased the shear modulus in close proximity to the nucleus, intensifying the negative gradient (Fig. 3B,C). In contrast, destabilizing actin with LatA induced a decrease in the shear modulus in the perinuclear region, which abolished the gradient. In the presence of CytoD, the shear modulus was more heterogeneously distributed between 2 µm and 6 µm from the nucleus, yielding a positive shear modulus gradient (Fig. 3B,C). As in the control situation, the G’/G’’ ratio was greater than 1 for all tested perturbations of the actin or microtubule cytoskeleton, indicating that elastic storage contributes more to the shear modulus than viscous loss. However their relative contribution changed depending on the drug treatment as shown by the variations of the G’/G’’ ratio (Fig.
S5E, left panel) or by cross-correlation of the rigidity maps with the elasticity or viscosity maps (Fig. S5E, right panel). Nocodazole and CytoD increased the predominance of elastic storage over viscous loss, while taxol and LatA decreased it slightly. Together these results not only confirm the contribution of microfilaments and microtubules to cell mechanics, but also show that they control the spatial distribution of intracellular mechanical parameters.
Impact of intracellular membranes
Surprisingly, the contribution of intracellular membranes to cell mechanics has never been quantified to our knowledge. We have used brefeldin A (BFA), an inhibitor of the Arf1 exchange factor GBF1, to investigate the mechanical role of intracellular membranes. By blocking COPI-dependent membrane trafficking, BFA disperses Golgi membranes which first form long tubules before being absorbed in the endoplasmic reticulum (49). BFA was also shown to induce membrane tubulation of endosomes and lysosomes (50). The effect of BFA is reversible and when BFA is washed-out the Golgi apparatus reassembles.
We first asked whether perturbing intracellular membranes using BFA could affect viscoelasticity of the cytoplasm. The live Golgi lipid marker BodipyTR-ceramide was used to visualize Golgi membranes. We found that BFA had minor effects on the relaxation curves (Fig. 4A). The bead displacement was shifted to larger values, indicating a small increase in intracellular rigidity. Accordingly, the shear modulus
8
deduced from the PL model slightly but significantly increased (Fig. 4B). The mechanical parameters deduced from the model-independent approach (Fig. S7A) or the SLL model (Fig. S7B) all increased but the only statistically significant effect we measured was an increase in viscosity. After wash-out and recovery, the values decreased back to levels close to the control. Similarly, BFA did not induce any major difference on the spatial maps (Fig. 4C and Fig. S7C-E) except for an increase in G0 3-6 µm away from the nucleus leading to an increase in the shear modulus gradient (Fig. 4D). These results point to a small but significant contribution of internal membranes to intracellular mechanics.
Energy depletion stiffens the cell cytoplasm
Several energy-dependent cellular processes, including cytoskeletal dynamics and molecular motor activity, can affect intracellular mechanics. It was shown recently using force spectrum microscopy that non-equilibrium ATP-driven fluctuating forces dominate thermal forces on time-scales greater than one second and enhance the movement of intracellular particles (8). We have used ATP depletion to study the effects of active forces on intracellular viscoelasticity with our microrheology technique. The viscoelastic relaxation was much slower after ATP depletion (Fig. 5A) indicating a stiffening of the cytoplasm. Consistently, the shear modulus was significantly higher in ATP depleted cells, mostly due to an increase in the storage modulus G’ (Fig. 5B). The model-independent rigidity index and bead step
amplitude (Fig. S8A) and the spring constant and viscosity from the SLL model experienced a similar increase (Fig. S8B). No significant changes in the microtubule and actin organization were observed upon ATP depletion (Fig. S8E) suggesting that the effects on intracellular rigidity were not indirectly due to effects on the cytoskeleton. Spatial mapping evidenced a striking increase in the shear modulus at the center of the micropattern due to ATP depletion (Fig. 5C and Fig. S8C) that yielded a sharper shear modulus gradient than in control cells (Fig. 5D). Accordingly we also detected an increase in the perinuclear region of the four other mechanical parameters we measured (Fig. S8D). These results show that active ATP-dependent forces soften the cell interior, especially at the cell center.
Spatially resolved microrheology to differentiate normal and cancer cells
Several recent reports indicate that the cytoplasm of metastatic cells is softer than the cytoplasm of non-tumorigenic cells (6, 8, 9, 12, 51). We have used our technique to differentiate between non-non-tumorigenic breast cells (MCF-10A) and highly metastatic breast cancer cells (MDA-MB-231). Averaged data showed that the shear modulus (Fig. 6A,B) and all the other measured mechanical parameters (Fig. S9A,B) were significantly lower in the case of metastatic cells, with up to a three-fold decrease depending on the parameter. The spatial maps obtained from metastatic cells further showed a global reduction in the shear modulus (Fig. 6C) and the other parameters (Fig. S9C,D) throughout the micropattern surface. This difference was not due to geometrical effects as the averaged cell volume was not significantly different between the two cell lines (1905±185 µm3 and 2015±125 µm3 for MCF-10A and MDA-MB-231 respectively with a p-value equals to 0.3, as measured from bright field images of cells in suspension; see
9
also (9)). The spatial maps also exhibited a similar smoother spatial distribution than in non-tumorigenic cells (Figs. 6C and S9C,D). Accordingly, the auto-correlation lengths of the spring constant and the viscosity form the SLL model were larger in metastatic cells (Fig. S9E). Measurements of the G’/G’’ ratio and cross-correlation of the rigidity map with the spring constant and viscosity maps showed that the relative contribution of elasticity decreases in metastatic cells (Fig. S9F). Finally, in the reference frame of the nucleus, the shear modulus was always smaller in metastatic cells, but the difference was more pronounced towards the cell periphery due to opposite shear modulus gradients (Fig. 6D). These results suggest that, while cancer progression decreases both elastic storage and viscous loss, the balance shifts towards viscosity and the spatial distribution of the mechanical parameters gets more uniform.
We next asked whether the differences in intracellular mechanics between non-tumorigenic and metastatic cells could correlate with the spatial organization of the actin and/or microtubule cytoskeletons. In MCF-10A non-tumorigenic cells, a higher microtubule density was observed in the cell center in a perinuclear area and actin stress fibers were visible throughout the cell cytoplasm. In contrast, in MDA-MB-231 metastatic cells, the microtubule cytoskeleton appeared more uniformly spread and less dense and microfilaments mostly localized at the cell periphery (Fig. 6E and S9G). Accordingly, and as expected from the results in RPE1 cells, depolymerizing actin with latrunculin A in MCF-10A cells decreased intracellular rigidity, while stabilizing microtubules with taxol in MDA-MB-231 cells increased rigidity (Fig. S9H). These findings suggest that the mechanical differences observed between non-tumorigenic and metastatic cells could arise from their different organization of the cytoskeleton and its associated signaling.
Discussion
We have developed an approach to map the spatial distribution of the intracellular mechanical properties of the cytoplasm of living cells. Our technique allows to measure cell-averaged parameters that can be compared with those obtained with more classical approaches, but also reveals the spatial variations of intracellular mechanics. Previous work has either studied local mechanics without controlling the cell geometry and thus with large cell-to-cell variability (22, 33, 34) or measured regional rigidity variations of the cell surface in controlled geometries using atomic force microscopy or magnetic twisting cytometry (28, 37, 38). Central to our method is the use of adhesive micropatterns to standardize the intracellular organization. By combining micropatterning with optical tweezers active microrheology, we are able to spatially resolve the local mechanical properties of the cell interior. As expected, plating cells on micropatterns decreases the variability in the local rigidity measurements (Fig. S3G). In our viscoelastic relaxation experiments, neither the stress nor the strain is constant, in contrast to classical creep experiments (42). The analysis of the experimental data thus required a unique theoretical framework. The simple analytical standard linear liquid (SLL) viscoelastic model we use to describe the intracellular microenvironment fits the experimental data remarkably well. However models based on a finite number of viscoelastic elements and corresponding relaxation times are no longer considered to be
10
well adapted to describe cell mechanics and many more elaborate theoretical models have been proposed, including glassy rheology (45, 52), poroelasticity (53) or tensegrity (54). A growing number of reports point to models based on power-law rheology as most relevant (8, 27–32). Consequently we also developed a specific theoretical analysis based on power-law (PL) rheology (see Materials and Methods) to interpret our experiments. In our PL-based analysis, only two fit parameters are used, the exponent and the prefactor of the underlying power-law. In contrast three fit parameters are used in the SLL model. Despite this, the PL model fits the experimental data equally well, strengthening the idea that power-law rheology may also govern intracellular mechanics. The order of magnitude of the mechanical parameters derived from both models are consistent since the spring constant 𝜇 from the SLL model can be related to the elastic storage modulus 𝐺′ using 𝐺′= 𝜇
6𝜋𝑅, where 𝑅=1 µm is the bead radius. With the typical values
we measured for the spring constant 𝜇~200 pN/µm, we obtain 𝐺′~10 Pa in good agreement with the values of G’ obtained with the PL model and with values reported previously for the cytoplasm (8, 22, 28).
Besides quantifying the complex shear modulus with the PL model and the spring constant and the viscosity with the SLL model, we also introduce the rigidity index, a local indicator of intracellular rigidity independent of any underlying model. The rigidity maps provide a convenient tool to visualize the local variations in intracellular mechanics.
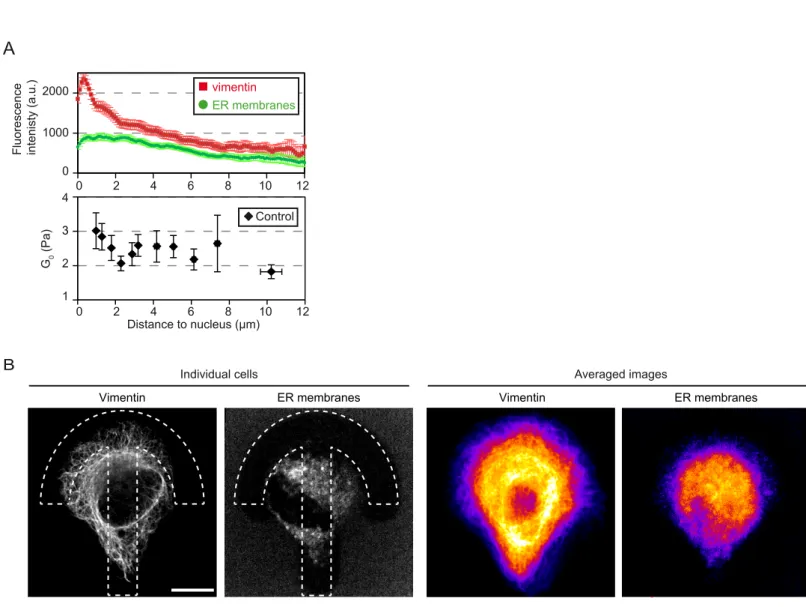
Spatial mapping of the shear modulus clearly depicts a decrease in rigidity from the center of the micropattern towards its periphery in RPE1 cells and a polarization along the axis of the crossbow micropattern (Fig. 1) reflecting the polarized organization of the cytoskeleton and intracellular compartments. The central region of the micropattern statistically corresponds to the perinuclear region, a zone particularly rich in internal membrane compartments such as the endoplasmic reticulum (ER), the Golgi apparatus and endosomes and also dense in cytoskeletal fibers. The shear modulus decreases between 1 µm and 2.5 µm away from the nucleus edge then stabilizes (Fig. 3B). Interestingly this decrease correlates with a decrease in the density of vimentin intermediate filaments, but not with the density of ER membranes (Fig. S10), pointing to a role of intermediate filaments in regulating the local rigidity in close vicinity to the nucleus. We have shown previously that intracellular rigidity increases close to the Golgi apparatus (36) due to the actin cytoskeleton. In good agreement, we find here that actin depolymerization by LatA induces a local decrease in the shear modulus 1-2 µm away from the nucleus (Fig. 3). Surprisingly, dispersing Golgi membranes with BFA had only a weak effect at the center (Fig. 4), suggesting that Golgi associated actin may remain present on BFA-insensitive Golgi remnants or Golgi matrix components (55, 56). BFA most significant effect was to increase the shear modulus, and especially viscous loss, closer to the cell periphery, about 3-6 µm away from the nucleus (Fig. 4C,D and S7). This may be due to endosome tubulation as reported upon treatment with BFA (50).
Interestingly, we note that the mechanical maps of non-treated RPE1 cells (Fig. 1E) and the distribution of the shear modulus (Fig. 1F) are not strictly symmetric with respect to the polarity axis of the crossbow micropattern. The averaged images of actin, microtubules and vimentin intermediate filaments (Figs. S4 and S10B) show that the cytoskeleton too lacks perfect symmetry. Similarly, when we examined the position of the nucleus carefully, we found that on average the nucleus position is slightly shifted
11
towards the upper right quadrant of the micropattern (Fig. S1B). This left/right asymmetry may be related to an intrinsic actin-driven chirality reported recently in micropatterned cells (57).
To further take advantage of the spatial information provided by our mapping technique, we have used image correlation tools to quantify the spatial variations of the maps and the spatial differences between maps. This approach is relevant because each data point in the map actually probes a relatively large volume in the cytoplasm, since the 2 µm diameter bead is displaced by 0.5 µm. Using large beads allows to integrate the mechanics at all length scales below the bead size, while smaller submicrometric probes may omit essential mechanical features originating from micron-scale cytoplasmic structures such as intracellular membrane compartments or cytoskeletal fibers. One striking example is given by the antagonistic effects of depolymerizing or stabilizing microtubules. The averaged viscoelastic measurements show that depolymerizing microtubules with nocodazole decreases rigidity, as previously reported (47) while stabilizing microtubules with taxol increases rigidity (Figs. 2 and S5). The analysis of the spatial maps gives insights into the local effects of both types of perturbations (Figs. 3 and S5). When microtubules are depolymerized, rigidity increases in the perinuclear region and drops everywhere else, yielding the lowest auto-correlation length and the steepest shear modulus gradient of all the conditions we tested. Since no obvious effect of nocodazole on the actin cytoskeleton was observed (Fig. S4), the increase in perinuclear rigidity may be attributed to intermediate filaments which are known to contribute to cell rigidity (for a recent review see (58)) and to accumulate around the nucleus when microtubules are depolymerized (59, 60). In contrast, when microtubules are stabilized, the rigidity level increases, especially towards the pattern periphery, probably due to the presence of stable microtubule plus-ends at the cell periphery. Similarly, the local contribution of actin in intracellular rheology can be investigated in details using our method, as best illustrated by the differences we observed between the effects of two actin destabilizing drugs, LatA and CytoD. Although actin destabilization is mostly thought to soften the cell interior, its precise effect on intracellular mechanics is still not clear (44) and probably depends on the cell type (61). Surprisingly, while in LatA treated cells the shear modulus dropped and bead diffusion was facilitated, we did not detect any effect upon treatment with CytoD (Fig. 2). Moreover, the two drugs had contrasting effects on the spatial distribution of the shear modulus. Maps of LatA treated cells were smoother, with a longer auto-correlation length and a very low shear modulus gradient (Figs. 3 and S5). These differences probably reflect the differences in the action mechanisms of these two drugs (46, 48). A crosstalk between actin, microtubules and intermediate filaments could also be involved since actin destabilization affects the distribution of both microtubules (LatA in Fig. S4) and intermediate filaments in the perinuclear region (59, 62).
There has recently been a growing interest in the role of active cellular forces, such as forces generated by cytoskeletal dynamics, molecular motors or acto-myosin contractility, in intracellular mechanics and conflicting results have been reported (8, 41, 44, 63–65). Here we measure an unambiguous stiffening of the cytoplasm of RPE1 cells upon energy depletion, reflected by an elevated shear modulus localized at the cell center up to 5 µm away from the nucleus (Figs. 5 and S8). A likely
12
explanation is that energy depletion inhibits cytoskeletal dynamic remodeling resulting in more cross-linked networks (63).
Finally, our method allows to clearly differentiate cancer cells from normal cells, based not only on their averaged intracellular mechanical properties, but also on the spatial distribution of their intracellular mechanical parameters. As previously reported for several types of cancers (6–9, 12, 51), the cytoplasm of metastatic breast cancer cells is softer than their non-tumorigenic counterparts. Our method, in contrast with previous studies, yields highly statistically significant decreases in both elasticity and viscosity (Fig. 6). The additional information provided by the spatial mapping on adhesive micropatterns further shows that maps of metastatic cells are smoother, more auto-correlated and comparatively more dominated by viscous loss than non-tumorigenic ones. The organization of both actin and microtubule cytoskeletons differs markedly in both cell types, which could at least in part explain the differences in intracellular mechanics (Fig. S9H). In cancer cells, microtubules appear more homogeneously distributed and less bundled and actin fibers are less abundant in the cell center and accumulate at the cell periphery (Figs. 6 and S9). Extrapolating our results on the mechanical effects of energy depletion, softening of cancer cells could also originate from a higher out-of-equilibrium activity. Our study emphasizes the need for spatial information in intracellular mechanics. Standardizing cell shape by micropatterning is a key aspect of our work. Because intracellular mechanical maps can detect subtle differences in the spatial distribution of mechanical parameters even in the absence of any change in their average values, our approach should provide insights into cancer cell mechanics.
Materials and Methods
Cell culture, micropatterning and reagents
Retinal pigment epithelial (RPE-1) cells were grown in DMEM/F12 medium supplemented with 10% fetal bovine serum (FBS) at 37ºC with 5% CO2. MCF-10A mammary epithelial cells were grown in DMEM/F12 medium supplemented with 5% horse serum, 20 ng/ml EGF, 100 ng/ml cholera toxin, and 10 µg/ml insulin. MDA-MB-231 metastatic breast cancer cells were grown in DMEM supplemented with 10% FBS (vol/vol). 900±30 µm2 crossbow-shaped (18 µm radius circumscribing circle) micropatterns were printed on PEG-coated glass coverslips by deep UV photolithography then coated with 50 μg /ml fibronectin and 20 μg/ml Alexa546-fibrinogen (Sigma). For MCF-10A and MDA-MB-231 cells, 50 µg/ml concanavalin A was added to facilitate cell adhesion to the micropatterns. Cells were seeded on freshly prepared protein coated micropatterns and allowed to spread for at least 2- 3hrs. Non-adherent cells were washed off by rinsing with culture medium. For rheological measurements cells were incubated overnight with 2 μm diameter fluorescently labeled latex beads (660/690 fluorescence, Bangs Laboratories, Inc) before seeding them on the micropatterns. 10 mM Hepes was added before microrheology experiments.
For immunofluorescence experiments, cells were fixed with 4% paraformaldehyde or with methanol. Primary antibodies were anti-β tubulin (Sigma #T4026), anti-GM130 (BD Transduction laboratories) and anti-vimentin (Santa Cruz). Actin was labelled using Alexa546-phalloidin (Invitrogen).
13
Secondary antibodies were from Jackson ImmunoResearch Laboratories. The live Golgi marker BodipyFL-ceramide (Invitrogen) was used to label the Golgi complex. Cells were incubated with 5 µM BodipyFL-ceramide for 15-30 min at 4ºC, washed with cold HBSS (Hank's Balanced Salt Solution, Invitrogen) then with warm culture medium and incubated at 37 ºC with 5% CO2 for a further 30 mins. The endoplasmic reticulum (ER) was labeled using ER Tracker (Molecular Probes/ Thermo Fisher). Cellular membranes were stained in live cells using CellMask (Molecular Probes/Thermo Fisher).
To destabilize the cytoskeleton, cells were incubated for 30 min with 2 µM nocodazole, 2 µM taxol, 50 nM latrunculin A (LatA), or 200 nM cytochalasin D (CytoD). To perturb internal membranes, Brefeldin A (BFA) was incubated at 3 μg/ml for 15-30 mins before microrheological measurements in cells previously labeled using BodipyFL-ceramide (see above). After the rheological measurements in the presence of BFA, cells were washed with culture medium and were allowed to recover for 1 hr before performing rheological measurements again in the absence of BFA. Control cells were also labeled with bodipyFL-ceramide. To deplete ATP, cells were incubated with 10 mM deoxyglucose and 10 mM sodium azide (NaN3) in Ca
2+
and Mg2+ enriched PBS for 30 mins. Control cells were incubated with 5 mM glucose for 30 mins.
Optical tweezers based intracellular microrheology, image acquisition and data
processing
The set-up combining optical tweezers and fast confocal microscopy was described in details previously(36). Briefly, a single fixed optical trap was built by coupling a 1060-1100 nm infra-red laser beam (2W maximal output power, IPG Photonics) to the back port of an inverted Eclipse microscope (Nikon) equipped with a resonant laser confocal A1R scanner (Nikon), a 37°C incubator and a nanometric piezostage (Mad City Labs). Coverslips with micropatterned cells containing typically 1 to 3 internalized beads were mounted in a Ludin chamber. A bead was first trapped by the optical tweezers (1 W laser output power, corresponding to 150 mW on the sample). An automated 0.5 µm step displacement was applied to the cell via the nanometric piezostage. Following the cell displacement, the bead was moved out of the trap center due to the viscoelastic nature of its microenvironment. The initial bead displacement, which we termed bead step amplitude and denoted with Xb, was smaller than the stage displacement Xs =0.5 µm. Because the optical tweezers position is fixed and acts as a spring on the bead, the bead position xb(t) relaxes from its maximal position Xb towards the center of the optical trap. The bead relaxation was recorded by acquiring images at 120 frames/sec in the resonant mode of the confocal scanner for 40 s using the NIS Nikon software.
Images of fixed cells were acquired as z-stacks separated by 0.5 µm in the galvanometric mode of the confocal scanner with an 8 frames averaging using the NIS Nikon software. For single cell images, the stack was projected as a maximum intensity projection using Image J. For averaged cell images, z-stacks were projected as average intensity projections using Image J then automatically aligned and averaged with a custom-written Image J macro. The averaged images are displayed using a fire look up table scaled between the minimum and the maximum intensity levels to highlight intensity variations.
14
Power law model
The relationships between the stress and the strain exerted on the bead microenvironment define the relaxation function G(t) and the creep function J(t) of the cytoplasm. If the initial strain is zero, then:
𝜎(𝑡) = ∫ 𝐺(𝑡 − 𝑡′)𝑑𝜀 𝑑𝑡′𝑑𝑡′ 𝑡 0 and 𝜀(𝑡) = ∫ 𝐽(𝑡 − 𝑡′) 𝑑𝜎 𝑑𝑡′𝑑𝑡′ 𝑡 0 .
In the case of our optical tweezers relaxation experiment the stress is given by 𝜎(𝑡) =𝑘𝑡𝑟𝑎𝑝4𝜋𝑅 𝑥2𝑏 and the strain is 𝜀(𝑡) =𝑥𝑠(𝑡)−𝑥𝑏(𝑡)
𝐿𝑐 , where xb and xs are the bead and the stage displacements relative to the trap center respectively, R is the bead radius, ktrap is the trap stiffness and Lc is length characteristic of the deformation of the bead microenvironment. Replacing in the expression of the stress, we find:
𝑥𝑏(𝑡) =𝜎1∗∫ 𝐺(𝑡 − 𝑡′)(𝑥̇𝑠− 𝑥̇𝑏)𝑑𝑡′
𝑡
0 (Eq. 1)
where 𝜎∗=𝑘𝑡𝑟𝑎𝑝 𝐿𝑐
4𝜋𝑅2 is a geometrical factor. Modelling the stage step displacement by a linear increase from 0 µ𝑚 to 𝑋𝑠= 0.5 µ𝑚 between 𝑡 = 0 and 𝑡 = 𝜏 seconds and taking the Laplace transform (𝐿𝑇(𝑓(𝑡)) =
𝑓̃(𝑠) = ∫ 𝑓(𝑡)𝑒∞ −𝑠𝑡 0 𝑑𝑡) of Eq.1 as in (42), we find 𝑥̃𝑏(𝑠) =𝜏𝑠𝑋𝑠2 1 1+𝜎∗𝑠𝐽̃ for 0 ≤ 𝑡 ≤ 𝜏 and 𝑥̃𝑏(𝑠) = 𝑋𝑠 𝜏𝑠2 1−𝑒−𝑠𝜏 1+𝜎∗𝑠𝐽̃ for 𝑡 > 𝜏,
where 𝑥̃𝑏(𝑠) is the Laplace transform of the bead displacement xb(t) and 𝐽̃(𝑠) is the Laplace transform of the creep function 𝐽(𝑡) (𝐽̃(𝑠) = 1
𝑠2𝐺̃(𝑠) with 𝐺̃(𝑠) the Laplace transform of the relaxation function 𝐺(𝑡)). Developing in powers of 𝜎∗𝑠𝐽̃ gives:
𝑥̃𝑏(𝑠) =𝜏𝑠𝑋𝑠2(1 − 𝑒−𝑠𝜏) ∑∞𝑛=0[−𝜎∗𝑠𝐽̃]𝑛 (Eq. 2).
Next we assume that the creep function behaves as a power law with an exponent and a prefactor A, 𝐽(𝑡) = 𝐴𝑡𝛼 (42). The Laplace transform of 𝐽(𝑡) is thus 𝐽̃(𝑠) = 𝐴Γ(1 + 𝛼)/𝑠1+𝛼 where Γ(1 + 𝛼) = ∫ 𝑒∞ −𝑡𝑡𝛼
0 𝑑𝑡 is the gamma function. Using the inverse Laplace transform and the following properties:
𝐿𝑇(𝑓(𝑡 − 𝜏)) = 𝑒−𝑠𝜏𝑓̃(𝑠), 𝑠𝑛−1(𝐿𝑇(𝐴𝑡𝛼))𝑛=Γ𝑛(1+𝛼) Γ(1+𝑛𝛼)𝐿𝑇((𝐴𝑡
𝛼)𝑛) and (1 + 𝑛𝛼)Γ(1 + 𝑛𝛼) = Γ(2 + 𝑛𝛼), we
obtain the bead displacement from Eq. 2: 𝑥𝑏(𝑡) = 𝑋𝑠[𝑡𝜏∑ [−Γ(1+𝛼)𝜎 ∗𝐴𝑡𝛼]𝑛 Γ(2+𝑛𝛼) ∞ 𝑛=0 −𝑡−𝜏𝜏 ∑ [−Γ(1+𝛼)𝜎 ∗𝐴(𝑡−𝜏)𝛼]𝑛 Γ(2+𝑛𝛼) ∞ 𝑛=0 ] (Eq. 3).
We use the first four terms of Eq. 3, that we term power-law (PL) model, to fit the first ten seconds of the relaxation of the bead position 𝑥𝑏(𝑡) as a function of time knowing 𝑋𝑠= 0.5 µ𝑚 and
𝜏 = 30 ms .The prefactor A and the exponent are the only two fit parameters. Because at longer times bead tracking is more noisy due to intracellular dynamics even when cells are plated on micropatterns (57), the data was fitted using the following weights: 0.9, 0.09 and 0.01 for 0<t<2s, 2<t<5s and 5<t<10s respectively).
The complex shear modulus G=G’+iG’’ is then deduced from A and as in (42) using 𝐺′= (2𝜋)𝛼cos (𝛼𝜋
2) /(𝐴 Γ(1 + 𝛼))
𝐺′′= (2𝜋)𝛼sin (𝛼𝜋
15
Spatial mapping
To generate the spatial maps, the two model-independent parameters (the rigidity index (RI) and the bead step amplitude (Xb)), the spring constant and the viscosity deduced from the fits with the SLL model and the complex shear modulus (its value G0, its real part G’ and its imaginary part G’’) deduced from the fits with the PL model were measured at different bead locations within the cell. For each cell, one or two beads were used. A bright field image (differential interference contrast, DIC) and a confocal fluorescence image were taken simultaneously to visualize the crossbow micropattern labelled with Alexa546-fibrinogen, the fluorescent bead and the nucleus. From these images, the X-Y position of the bead relative to center of the micropattern was measured. The distance between the bead and the nucleus was defined as the shortest distance between the center of the bead and the nuclear envelope. Each rheological parameter was plotted as a function of its X-Y position relative to the center of the micropattern using the ‘contour’ plot type in the OriginPro software (Origin Lab Corporation). Spatial maps were smoothed using 18 contour levels and the ‘smoothing’ function in OriginPro with the following parameter: ‘total points increase factor’=500, ‘smoothing parameter’=0.005). The convex hull of the set of bead X-Y coordinates was used as the map boundary. Data from N=19-166 beads, depending on the experimental conditions, were pooled to sample a maximum surface area on the micropattern. The coordinates of the most peripheral beads differed between experimental conditions or cell treatments, leading to different shapes of the map boundary. The polar plots were obtained by averaging the data along the polar radius in 30° intervals. The plots of the shear modulus as a function of the distance to the nucleus were obtained by averaging the data along all directions in 1 µm intervals from the nucleus.
Statistical analysis
Results are representative of at least three independent experiments. Data are expressed as means ± standard error of the mean. Statistical relevance was evaluated using Student’s t-tests and the P value is indicated (n.s, nonsignificant; *P < 0.01, **P < 0.001, and ***P < 0.0001, except when indicated).
Acknowledgements
We thank Vera Costa for providing the MCF-10A and MDA-MB-231 cells. We thank David Guet, Mathieu Pinot and Charlotte Alibert for technical assistance with the optical tweezers set-up. We thank Timo Betz, Maxime Dahan, Mathieu Coppey, Paul Janmey, and Sébastien Manneville for fruitful discussions. K.M. was funded by the Plan Cancer 2012-2014 INSERM-Tecsan (grant number PC201125) and by a grant from the Labex CelTisPhyBio. A.A. acknowledges funding from Agence Nationale de la Recherche (ImmunoMeca, ANR-12-BSV5-0007-01; Initiatives d’excellence, Idex ANR-11-IDEX-0005-02; and Labex Who Am I?, ANR-11-LABX-0071).
16
References
1. Guillot C, Lecuit T (2013) Mechanics of epithelial tissue homeostasis and morphogenesis. Science 340(6137):1185–9.
2. Lange JR, Fabry B (2013) Cell and tissue mechanics in cell migration. Exp Cell Res 319(16):2418–23.
3. Louveaux M, Hamant O (2013) The mechanics behind cell division. Curr Opin Plant Biol 16(11):774–779.
4. Vedula SRK, Ravasio A, Lim CT, Ladoux B (2013) Collective cell migration: a mechanistic perspective. Physiology (Bethesda) 28(6):370–9.
5. Asnacios A, Hamant O (2012) The mechanics behind cell polarity. Trends Cell Biol 22(11):584–91. Available at: http://www.ncbi.nlm.nih.gov/pubmed/22980034 [Accessed March 7, 2016].
6. Li Y, Schnekenburger J, Duits MHG (2009) Intracellular particle tracking as a tool for tumor cell characterization. J Biomed Opt 14(6):64005. Available at:
http://www.ncbi.nlm.nih.gov/entrez/query.fcgi?cmd=Retrieve&db=PubMed&dopt=Citation&list_uids=2005924 3 [Accessed September 14, 2011].
7. Baker EL, Lu J, Yu D, Bonnecaze RT, Zaman MH (2010) Cancer cell stiffness: integrated roles of three-dimensional matrix stiffness and transforming potential. Biophys J 99(7):2048–57. Available at:
http://www.pubmedcentral.nih.gov/articlerender.fcgi?artid=3042573&tool=pmcentrez&rendertype=abstract [Accessed August 11, 2011].
8. Guo M, et al. (2014) Probing the Stochastic, Motor-Driven Properties of the Cytoplasm Using Force Spectrum Microscopy. Cell 158(4):822–832. Available at: http://www.ncbi.nlm.nih.gov/pubmed/25126787 [Accessed August 14, 2014].
9. Agus DB, et al. (2013) A physical sciences network characterization of non-tumorigenic and metastatic cells. Sci Rep 3:1449.
10. Huber F, Boire A, López MP, Koenderink GH (2014) Cytoskeletal crosstalk: when three different personalities team up. Curr Opin Cell Biol 32C:39–47.
11. Wen Q, Janmey PA (2011) Polymer physics of the cytoskeleton. Curr Opin Solid State Mater Sci 15(5):177– 182.
12. Coughlin MF, Fredberg JJ (2013) Changes in cytoskeletal dynamics and nonlinear rheology with metastatic ability in cancer cell lines. Phys Biol 10(6):065001.
13. Laudadio RE, et al. (2005) Rat airway smooth muscle cell during actin modulation: rheology and glassy dynamics. Am J Physiol Cell Physiol 289(6):C1388–95. Available at:
http://www.ncbi.nlm.nih.gov/pubmed/16120653 [Accessed January 29, 2016].
14. Halaoui R, McCaffrey L (2014) Rewiring cell polarity signaling in cancer. Oncogene 34(8):939–950.
15. Goldenring JR (2013) A central role for vesicle trafficking in epithelial neoplasia: intracellular highways to carcinogenesis. Nat Rev Cancer 13(11):813–20.
17
16. Zegers MM, Friedl P (2014) Rho GTPases in collective cell migration. Small GTPases 5:e28997.17. Crocker JC, Hoffman BD (2007) Multiple-particle tracking and two-point microrheology in cells. Methods Cell Biol 83(07):141–78.
18. Weihs D, Mason TG, Teitell MA (2006) Bio-microrheology: a frontier in microrheology. Biophys J 91(11):4296–305. Available at:
http://www.pubmedcentral.nih.gov/articlerender.fcgi?artid=1635658&tool=pmcentrez&rendertype=abstract [Accessed July 28, 2011].
19. Bausch AR, Moller W, Sackmann E (1999) Measurement of local viscoelasticity and forces in living cells by magnetic tweezers. Biophys J 76(1 Pt 1):573–579. Available at:
http://www.ncbi.nlm.nih.gov/entrez/query.fcgi?cmd=Retrieve&db=PubMed&dopt=Citation&list_uids=9876170.
20. Broedersz CP, et al. (2010) Measurement of nonlinear rheology of cross-linked biopolymer gels. Soft Matter 6(17):4120-4127.
21. Almonacid M, et al. (2015) Active diffusion positions the nucleus in mouse oocytes. Nat Cell Biol 17(4):470– 9. Available at: http://www.ncbi.nlm.nih.gov/pubmed/25774831 [Accessed November 5, 2015].
22. Berret J-F (2016) Local viscoelasticity of living cells measured by rotational magnetic spectroscopy. Nat Commun 7:10134. Available at: http://www.nature.com/doifinder/10.1038/ncomms10134 [Accessed September 11, 2016].
23. Kasza KE, et al. (2007) The cell as a material. Curr Opin Cell Biol 19(1):101–7. Available at: http://www.ncbi.nlm.nih.gov/pubmed/17174543 [Accessed October 30, 2015].
24. Stamenović D (2008) Rheological behavior of mammalian cells. Cell Mol Life Sci 65(22):3592–605. Available at: http://www.ncbi.nlm.nih.gov/pubmed/18668200 [Accessed August 27, 2011].
25. Lim CT, Zhou EH, Quek ST (2006) Mechanical models for living cells--a review. J Biomech 39(2):195–216. Available at: http://www.ncbi.nlm.nih.gov/pubmed/16321622 [Accessed January 17, 2016].
26. Pritchard RH, Huang YYS, Terentjev EM (2014) Mechanics of biological networks: from the cell cytoskeleton to connective tissue. Soft Matter 10(12):1864–84. Available at:
http://www.ncbi.nlm.nih.gov/pubmed/24652375 [Accessed January 29, 2016].
27. Fabry B, et al. (2001) Scaling the microrheology of living cells. Phys Rev Lett 87(14):148102. Available at: http://www.ncbi.nlm.nih.gov/pubmed/11580676 [Accessed January 29, 2016].
28. Cai P, et al. (2013) Quantifying cell-to-cell variation in power-law rheology. Biophys J 105(5):1093–102.
29. Balland M, et al. (2006) Power laws in microrheology experiments on living cells: Comparative analysis and modeling. Phys Rev E Stat Nonlin Soft Matter Phys 74(2 Pt 1):021911. Available at:
http://www.ncbi.nlm.nih.gov/pubmed/17025476 [Accessed February 13, 2012].
30. Durand-Smet P, et al. (2014) A comparative mechanical analysis of plant and animal cells reveals convergence across kingdoms. Biophys J 107(10):2237–44. Available at:
http://www.pubmedcentral.nih.gov/articlerender.fcgi?artid=4241441&tool=pmcentrez&rendertype=abstract [Accessed January 29, 2016].
18
31. Hoffman BD, Massiera G, Van Citters KM, Crocker JC (2006) The consensus mechanics of culturedmammalian cells. Proc Natl Acad Sci U S A 103(27):10259–64. Available at:
http://www.pubmedcentral.nih.gov/articlerender.fcgi?artid=1502445&tool=pmcentrez&rendertype=abstract [Accessed January 29, 2016].
32. Guo M, et al. (2013) The role of vimentin intermediate filaments in cortical and cytoplasmic mechanics. Biophys J 105(7):1562–8. Available at: http://www.ncbi.nlm.nih.gov/pubmed/24094397 [Accessed March 30, 2014].
33. Tseng Y, Kole TP, Wirtz D (2002) Micromechanical mapping of live cells by multiple-particle-tracking microrheology. Biophys J 83(6):3162–76. Available at:
http://www.pubmedcentral.nih.gov/articlerender.fcgi?artid=1302394&tool=pmcentrez&rendertype=abstract.
34. Hecht FM, et al. (2015) Imaging viscoelastic properties of live cells by AFM: power-law rheology on the nanoscale. Soft Matter 11(23):4584–91. Available at: http://www.ncbi.nlm.nih.gov/pubmed/25891371 [Accessed January 29, 2016].
35. Daniels BR, et al. (2010) Differences in the microrheology of human embryonic stem cells and human induced pluripotent stem cells. Biophys J 99(11):3563–70. Available at:
http://www.pubmedcentral.nih.gov/articlerender.fcgi?artid=2998615&tool=pmcentrez&rendertype=abstract [Accessed March 7, 2016].
36. Guet D, et al. (2014) Mechanical role of actin dynamics in the rheology of the Golgi complex and in Golgi-associated trafficking events. Curr Biol 24(15):1700–11. Available at:
http://www.ncbi.nlm.nih.gov/pubmed/25042587 [Accessed October 14, 2014].
37. Rigato A, Rico F, Eghiaian F, Piel M, Scheuring S (2015) Atomic Force Microscopy Mechanical Mapping of Micropatterned Cells Shows Adhesion Geometry-Dependent Mechanical Response on Local and Global Scales. ACS Nano 9(6):5846–56. Available at: http://www.ncbi.nlm.nih.gov/pubmed/26013956 [Accessed January 29, 2016].
38. Park CY, et al. (2010) Mapping the cytoskeletal prestress. Am J Physiol Cell Physiol 298(5):C1245–52.
39. Mandal K, Wang I, Vitiello E, Orellana LAC, Balland M (2014) Cell dipole behaviour revealed by ECM sub-cellular geometry. Nat Commun 5:5749.
40. Schauer K, et al. (2010) Probabilistic density maps to study global endomembrane organization. Nat Methods 7(7):560–566. Available at: http://www.ncbi.nlm.nih.gov/pubmed/20512144.
41. Chan CJ, et al. (2015) Myosin II Activity Softens Cells in Suspension. Biophys J 108(8):1856–69. Available at: http://www.ncbi.nlm.nih.gov/pubmed/25902426 [Accessed December 9, 2015].
42. Desprat N, Richert A, Simeon J, Asnacios A (2005) Creep function of a single living cell. Biophys J 88(3):2224–33.
43. Théry M, et al. (2006) Anisotropy of cell adhesive microenvironment governs cell internal organization and orientation of polarity. Proc Natl Acad Sci U S A 103(52):19771–6. Available at:
http://www.pubmedcentral.nih.gov/articlerender.fcgi?artid=1750916&tool=pmcentrez&rendertype=abstract.
44. Van Citters KM, Hoffman BD, Massiera G, Crocker JC (2006) The role of F-actin and myosin in epithelial cell rheology. Biophys J 91(10):3946–56. Available at:
19
http://www.pubmedcentral.nih.gov/articlerender.fcgi?artid=1630462&tool=pmcentrez&rendertype=abstract [Accessed July 18, 2011].45. Bursac P, et al. (2005) Cytoskeletal remodelling and slow dynamics in the living cell. Nat Mater 4(7):557–61.
46. Wakatsuki T, Schwab B, Thompson NC, Elson EL (2001) Effects of cytochalasin D and latrunculin B on mechanical properties of cells. J Cell Sci 114(Pt 5):1025–36.
47. Wilhelm C, Gazeau F, Bacri J-C (2003) Rotational magnetic endosome microrheology: Viscoelastic architecture inside living cells. Phys Rev E 67(6):1–12. Available at:
http://link.aps.org/doi/10.1103/PhysRevE.67.061908 [Accessed August 1, 2011].
48. Cooper JA, Sept D (2008) New insights into mechanism and regulation of actin capping protein. Int Rev Cell Mol Biol 267:183–206.
49. Lippincott-Schwartz J, Yuan LC, Bonifacino JS, Klausner RD (1989) Rapid redistribution of Golgi proteins into the ER in cells treated with brefeldin A: Evidence for membrane cycling from Golgi to ER. Cell 56(5):801– 813.
50. Lippincott-Schwartz J, et al. (1991) Brefeldin A’s effects on endosomes, lysosomes, and the TGN suggest a general mechanism for regulating organelle structure and membrane traffic. Cell 67(3):601–16.
51. Guck J, et al. (2005) Optical deformability as an inherent cell marker for testing malignant transformation and metastatic competence. Biophys J 88(5):3689–98.
52. Mandadapu KK, Govindjee S, Mofrad MRK (2008) On the cytoskeleton and soft glassy rheology. J Biomech 41(7):1467–78.
53. Moeendarbary E, et al. (2013) The cytoplasm of living cells behaves as a poroelastic material. Nat Mater 12(3):253–61.
54. Ingber DE, Wang N, Stamenovic D (2014) Tensegrity, cellular biophysics, and the mechanics of living systems. Rep Prog Phys 77(4):046603. Available at:
http://www.pubmedcentral.nih.gov/articlerender.fcgi?artid=4112545&tool=pmcentrez&rendertype=abstract [Accessed January 29, 2016].
55. Nakamura N, et al. (1995) Characterization of a cis-Golgi matrix protein, GM130. J Cell Biol 131(6 Pt 2):1715–26. Available at:
http://www.pubmedcentral.nih.gov/articlerender.fcgi?artid=2120691&tool=pmcentrez&rendertype=abstract [Accessed February 13, 2012].
56. Hendricks LC, McClanahan SL, McCaffery M, Palade GE, Farquhar MG (1992) Golgi proteins persist in the tubulovesicular remnants found in brefeldin A-treated pancreatic acinar cells. Eur J Cell Biol 58(2):202–13. 57. Tee YH, et al. (2015) Cellular chirality arising from the self-organization of the actin cytoskeleton. Nat Cell
Biol 17(4):445–57. Available at: http://www.ncbi.nlm.nih.gov/pubmed/25799062 [Accessed March 23, 2016]. 58. Köster S, Weitz DA, Goldman RD, Aebi U, Herrmann H (2015) Intermediate filament mechanics in vitro and
in the cell: from coiled coils to filaments, fibers and networks. Curr Opin Cell Biol 32:82–91.
20
positioning of the nucleus. J Cell Sci 124(Pt 6):865–72.60. Gurland G, Gundersen GG (1995) Stable, detyrosinated microtubules function to localize vimentin intermediate filaments in fibroblasts. J Cell Biol 131(5):1275–90.
61. Grady ME, Composto RJ, Eckmann DM (2016) Cell elasticity with altered cytoskeletal architectures across multiple cell types. J Mech Behav Biomed Mater 61:197–207. Available at:
http://www.ncbi.nlm.nih.gov/pubmed/26874250 [Accessed February 19, 2016].
62. Gruenbaum Y, Aebi U (2014) Intermediate filaments: a dynamic network that controls cell mechanics. F1000Prime Rep 6(54):54.
63. Mizuno D, Tardin C, Schmidt CF, Mackintosh FC (2007) Nonequilibrium mechanics of active cytoskeletal networks. Science 315(5810):370–3. Available at: http://www.ncbi.nlm.nih.gov/pubmed/17234946 [Accessed July 18, 2011].
64. Trepat X, et al. (2007) Universal physical responses to stretch in the living cell. Nature 447(May):592–595.
65. Hale CM, Sun SX, Wirtz D (2009) Resolving the role of actoymyosin contractility in cell microrheology. PLoS One 4(9):e7054. Available at:
http://www.pubmedcentral.nih.gov/articlerender.fcgi?artid=2737638&tool=pmcentrez&rendertype=abstract [Accessed March 7, 2016].
21
Figure legends
Figure 1
Spatially-resolved intracellular microrheology. (A) Bright-field image of an RPE1 cell plated on a crossbow micropattern. 2 µm diameter beads were internalized in the cell (black arrow). The dashed and dotted lines show the micropattern and cell contours respectively. Scale bar, 10 µm. (B) (Top) Schematic of the step relaxation experiment. The bead is initially trapped at the center of the optical tweezers. A time t=0 s, the cell is moved in a stepwise fashion to the left on a distance Xs=0.5 μm. The bead is displaced on a distance Xb<Xs due to the viscoelastic nature of its microenvironment. (Bottom) Single and averaged bead displacement plots. Error bars represent standard error mean (N=152 beads from 147 cells). (C) Distribution of the beads locations relative to the micropattern. Position (x=0, y=0) denotes the center of the crossbow micropattern. 𝜃 denotes the angle between the bead position and the polarity axis (𝜃 = 0) of the crossbow micropattern. The dashed blue contour represents the average nucleus shape (see Fig. S1B). (D) The relaxation strongly depends upon the bead location within the cell: bead 1 located in the central region of the micropattern relaxes more slowly than bead 2 located at the periphery. The blue lines are fits to the experimental data using the power law (PL) model. (E) Maps showing the spatial distribution of the storage modulus (G’), the loss modulus (G’’), the shear modulus G0 and the G’/G’’ ratio. The maps are color-coded from blue (low values) to red (high values). Data are from N=152 beads from 147 cells. The dashed white contour represents the average nucleus shape (see Fig. S1B). (F) Polar plot of the shear modulus (G0) as a function of the angle 𝜃. Data were pooled and averaged in 30° intervals.
Figure 2
Contribution of the actin and microtubule cytoskeleton to the spatially averaged mechanical properties of the cytoplasm. (A) Relaxation curves for control cells (black) and for cells treated with drugs destabilizing microtubules (nocodazole, taxol) or microfilaments (latrunculin A and cytochalasin D) (red). Note that the cytoD and control curves superimpose. (B) Average values of the shear modulus G0, the storage modulus
G’, and the loss modulus G’’ in the presence of the indicated drug. Data shown in (A) and (B) are
averages from N= 152, 44, 56, 24 and 34 beads in control cells, nocodazole-, taxol-, LatA- and CytoD-treated cells respectively. (C) Mean square displacement (MSD) analysis of the motion of 2 µm diameter beads diffusing inside the optical trap in control cells (black) and in cells treated with LatA (red) or CytoD (blue). The averaged MSD plots as a function of time (left) were fitted using a caged diffusion model (see Supplementary Materials and Methods) to obtain the diffusion coefficient (right). Data shown are averages from N=54, 27, and 38 beads for control cells, LatA and CytoD treated cells respectively. Error bars represent standard errors. p-values are determined from Student’s t-test for unpaired samples with respect to control cells (*** p<0.0001; ** p<0.001; * p<0.01).
![Risiko- & [und] Schutzfaktoren der psychischen Gesundheit humanitärer Einsatzhelfer : eine systematische Literaturübersicht](data:image/gif;base64,R0lGODlhAQABAIAAAP///wAAACH5BAEAAAAALAAAAAABAAEAAAICRAEAOw==)