HAL Id: hal-03260021
https://hal.archives-ouvertes.fr/hal-03260021
Submitted on 21 Jun 2021
HAL is a multi-disciplinary open access
archive for the deposit and dissemination of
sci-entific research documents, whether they are
pub-lished or not. The documents may come from
teaching and research institutions in France or
abroad, or from public or private research centers.
L’archive ouverte pluridisciplinaire HAL, est
destinée au dépôt et à la diffusion de documents
scientifiques de niveau recherche, publiés ou non,
émanant des établissements d’enseignement et de
recherche français ou étrangers, des laboratoires
publics ou privés.
Copyright
Deposits and Implications for Explosive Volcanism
S. Besse, A. Doressoundiram, O. Barraud, L. Griton, T. Cornet, C. Muñoz, I.
Varatharajan, J. Helbert
To cite this version:
S. Besse, A. Doressoundiram, O. Barraud, L. Griton, T. Cornet, et al.. Spectral Properties and
Physi-cal Extent of Pyroclastic Deposits on Mercury: Variability Within Selected Deposits and Implications
for Explosive Volcanism. Journal of Geophysical Research. Planets, Wiley-Blackwell, 2020, 125 (5),
pp.e05879. �10.1029/2018JE005879�. �hal-03260021�
Spectral Properties and Physical Extent of Pyroclastic
Deposits on Mercury: Variability Within Selected
Deposits and Implications for Explosive
Volcanism
S. Besse1 , A. Doressoundiram2 , O. Barraud2 , L. Griton2 , T. Cornet1 , C. Muñoz1 ,
I. Varatharajan3 , and J. Helbert3
1Aurora Technology BV for ESA, European Space Agency, Madrid, Spain,2LESIA, Observatoire de Paris, Paris, France, 3Institute for Planetary Research, DLR, Berlin, Germany
Abstract
Explosive volcanism on the surface of planet Mercury is visible through the pyroclastic deposits that surround morphologic features often identified as the vent. Those deposits are known as faculae. The understanding of explosive volcanism provides important information on Mercury'sgeological, thermal, and volcanic history. Observations by the MESSENGER spacecraft are used to analyze in detail the spectral properties of 14 selected faculae with the aim of understanding their chemical and physical properties. Scientific observations obtained by the MASCS instrument are particularly suitable for this task, although their observational and geometrical constraints limit definitive conclusions.
Nonetheless, spectral properties in the visible, ultraviolet and near-infrared indicate that the selected faculae are probably larger than visible in images solely. Spectral parameters provide a means to isolate Mercury's pyroclastic deposits with respect to Mercury's average spectral behavior. The similar spectral behavior of the visible, ultraviolet and near-infrared domains suggests that the amount of mixing of pyroclastic materials with the underlying material, the differences in grain sizes between and inside the faculae, and the presence of opaque/mineral phases, could play significant roles in the spectral properties observed. Observations by the BepiColombo mission in nadir configuration covering a large range of phase angles will be highly complementary to the MESSENGER observations.
Plain Language Summary
The presence of volcanism on Mercury has been confirmed from observations taken by the NASA MESSENGER mission in 2011. As on Earth, various styles of volcanism have been detected; explosive volcanism which involves a low volume of lava and high volume of gas, and effusive volcanism, which is richer in lava and poorer in gas. Using observations in the near-infrared and visible spectral domain, this analysis aims at better characterizing the physical and chemical properties of the deposits resulting from explosive volcanism. In this manuscript, it is shown that the scale of deposits resulting from explosive volcanism has been underestimated, which cascades to a potential underestimation of the quantity of gas present in the interior of Mercury through its history. Additionally, it is shown that the amount of mixing of pyroclastic materials with the underlying material, the differences in grain sizes between and inside the faculae, and the presence of opaque/mineral phases, could play significant roles in the spectral properties observed in near infrared and visible spectral domain. Unfortunately, the limitations in the measurements from MESSENGER complicate the exploration of physical and chemical properties. These issues will be better explored with the BepiColombo mission, the next mission to explore the surface of Mercury.1. Introduction
Volcanism exposed on the surface of planets represents a unique opportunity to look into the interior, and trace composition and evolution through time. Mercury is no exception, and the confirmation of widespread volcanism on the surface (Byrne et al., 2018; Head et al., 2008; Head et al., 2011; Denevi et al., 2013; Kerber et al., 2009; Kerber et al., 2011; Prockter et al., 2010) facilitates our understanding of the evolution of this planet. In addition, the surprising high concentration of volatile elements (Nittler et al., 2011), and the low
RESEARCH ARTICLE
10.1029/2018JE005879
Key Points:
• Variations in spectral properties are correlated with the distance from the source
• Grain size, regolith mixing, and/or the presence of an opaque/mineral are possible controlling factors in the spectral variability observed • Faculae (e.g., Bitin, Agwo, Orm)
have a larger spatial extent than image data alone suggest
Correspondence to:
S. Besse, [email protected]
Citation:
Besse, S., Doressoundiram, A., Barraud, O., Griton, L., Cornet, T., Munoz, C., et al. (2020). Spectral properties and physical extent of pyroclastic deposits on Mercury: Variability within selected deposits and implications for explosive volcanism. Journal of Geophysical
Research: Planets, 125, e2018JE005879. https://doi.org/10.1029/2018JE005879
Received 9 NOV 2018 Accepted 8 APR 2020
Accepted article online 30 APR 2020
©2020. American Geophysical Union. All Rights Reserved.
abundance of iron on its surface with respect to its core, is highlighting the complex history of Mercury (Nittler et al., 2018).
Measurements performed by the MErcury Surface, Space ENvironment, GEochemistry, and Ranging (MESSENGER) spacecraft (Solomon et al., 2007, 2011) X-ray Spectrometer (XRS) confirm the mafic to ultra-mafic composition of these low-iron basalt-like smooth plains (Nittler et al., 2011; Weider et al., 2012), which may have been emplaced by voluminous low-viscosity lavas (Byrne et al., 2013; Head et al., 2011), similar to those forming the lunar maria but with much lower iron content. Explosive volcanism and its associ-ated pyroclastic deposits exhibit characteristic morphological properties (Kerber et al., 2009, 2011; Thomas et al., 2014) with vents surrounded by bright deposits, spectrally red (i.e., increasing reflectance with wave-lengths), known as faculae. For clarity through the rest of the manuscript, we will refer to facula/e for all pyroclastic deposits candidates, regardless if they have been provided an official facula/e name by the Inter-national Astronomical Union (IAU). Explosive volcanism has complex relationships with impact craters. The majority of volcanic vents are located within impact craters, and this gives an insight on the possible formation mechanism of explosive volcanism on Mercury, for instance, through dike propagation (Jozwiak et al., 2018; Thomas et al., 2015). Spectroscopic analyses have been more limited given that the iron-poor surface does not facilitate the spectral identification of minerals in the spectral range covered by MESSEN-GER. While Kerber et al. (2011) have shown that faculae are spectrally flat (i.e., no absorption bands) and are similar in albedo to putative pyroclastic deposits on the Moon, Goudge et al. (2014) highlighted the ultra-violet (UV) and visible (VIS) spectral properties of the faculae (i.e., a more pronounced downturn in the UV, and a higher VIS slope with respect to Mercury's average). A detailed analysis of faculae in the Caloris basin by Besse et al. (2015) confirmed their UV and VIS slope properties, and also added that faculae are distinguishable in the near-infrared (NIR) domain with respect to Mercury's spectral average. Besse et al. (2015) also demonstrated that similarly to the Moon (Jawin et al., 2015), spectral properties of faculae in the Caloris basin change as a function of distance from their source. These were interpreted to be due to vari-ability either in the iron content or grain size of the faculae by Goudge et al. (2014) and Besse et al. (2015). However, conclusions were not definitive given the nonoptimal viewing geometry of the Mercury Atmo-spheric and Surface Composition Spectrometer (MASCS, McClintock & Lankton, 2007) observations (i.e., high phase angle of 78◦minimum).
The final delivery of MESSENGER products to the Planetary Data System (PDS) has permitted the present work to expand upon the analysis of Besse et al. (2015) in several ways. First, there are now more spectra to be analyzed. Second, the spatial resolution of dedicated observations of the faculae is higher, which helps confirm their spectral variability as a function of distance. Third, better calibrations are now available for the spectra. Finally, it is possible to use more high-resolution images from the Mercury Dual Imaging System (MDIS; Hawkins et al., 2007) to provide local geological context. In this work, we use these data products to examine 14 pyroclastic deposits in depth to determine if a relationship exists between vent distance and spectral shape.
2. Hermean Faculae
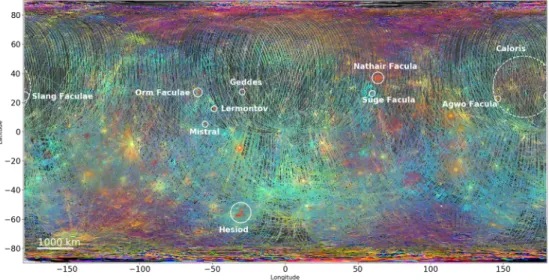
Faculae, representing putative pyroclastic deposits, are widely spread on Mercury's surface, except for a large area of smooth plains covering the north pole of the planet known as Borealis Planitia. Most smooth plains are probably the product of extensive effusive volcanism (Byrne et al., 2016; Head et al., 2011). Kerber et al. (2011) identified and characterized more than 35 faculae on the surface of Mercury, and Thomas et al. (2014) expanded the global description of explosive volcanism including more than 150 candidates, acknowledging that some are probably not faculae because they lack a central vent. Kerber et al. (2014) pushed the list of candidates to 200 locations at the surface, acknowledging also that not all of them are volcanic in nature. This study aims at providing a deep analysis of a selection of faculae presented in Figure 1, in particular to assess if similar spectral behavior found in Besse et al. (2015) could be present in other faculae, and confirm if this could be related to compositional or physical properties of the deposits. A similar spectral analysis of all the 200 faculae reported in previous work (Kerber et al., 2014; Thomas et al., 2015) using the MASCS data sets will require years of full time analysis.
The selected sample mitigates the potential biases in the interpretation of spectral properties if the cover-age, and viewing condition were not addressed properly. Additionally, some faculae are often considered as strong candidates for explosive volcanism by previous studies (e.g., Lermontov, and Mistral in Izenberg
Journal of Geophysical Research: Planets
10.1029/2018JE005879
Figure 1. Location of Hermean faculae studied in this analysis. The map is colored as a function of spectral properties
of the surface (the red channel is the reflectance at 575 nm, the green channel is the ratio 415 nm/750 nm, and the blue channel is the ratio 310 nm/390 nm). Faculae generally appear redder than the surrounding terrains. Faculae analyzed in this study are highlighted with the white circles, together with the Caloris basin. Lermontov, and Hesiod have, respectively, 2 and 5 faculae analyzed. The background map is a finished product of all the MASCS footprints and available through the ACT Quick Map tool.
et al., 2014; Slang and Agwo in Besse et al., 2015and Rothery et al., 2014). A total of 14 faculae have been analyzed in detail, although Section 4 reports mostly on Nathair Faculae, and the deposits in the Hesiod region. A survey of all the faculae is outside the scope of this analysis, as first an understanding of the spectral behavior needs to be consolidated.
2.1. Selected Targets to Mitigate Observational Bias
MESSENGER operations had several observational constraints that specifically limit the spatial coverage and viewing geometry of faculae. The previous analysis of Besse et al. (2015) sampled the region of Caloris, located in the northern hemisphere. Given the important changes in spatial resolution for all remote sensing instruments of the MESSENGER mission as a function of latitude, faculae located in the southern hemi-sphere were included in this study to ensure that spatial resolution is not influencing the analysis of Besse et al. (2015). Faculae in proximity to the Hesiod crater (Latitude −54.4; Longitude −34.3◦E) were selected to probe different latitude with respect to Besse et al. (2015). Additionally, dedicated observations of facu-lae were performed through the end of the MESSENGER mission. Nathair Facula (Latitude 63.8; Longitude 35.8◦E) was targeted with an improved spatial resolution of 500 m per footprint. Nathair Facula was added to our analyzed sample to also assess the possible bias in the spectral parameters with respect to the spatial resolution.
2.2. Selected Targets to Optimize the Spatial Coverage of the Faculae
Space weathering can also affect the spectral properties of the faculae in many ways. The selection of faculae at various latitudes with Nathair, Orm, Suge, Slang, Agwo, and the faculae located at the Hesiod, Lermon-tov, Geddes, and Mistral craters will mitigate possible bias in the analysis of faculae properties influenced by space weathering. The combination of operational constrains of MESSENGER, time allocation for obser-vations by MASCS, and the distribution of faculae on Mercury's surface still impose an uneven selection of faculae with respect to covering a full range of latitudes and longitudes.
Mercury's 3:2 spin orbit resonance results in two hot poles on the equator at longitudes 0◦and 180◦E where noon-time temperature is about 100 Khigher than at the cold poles at 90◦and 270◦E (Siegler et al., 2013). This temperature variation could affect the weathering of faculae (Domingue et al., 2014) (although there is also a time dependence that cannot be assessed given the uncertainty on the ages of faculae), and samples need to be selected at various longitudes when possible.
2.3. Selected Targets to Maximize the Variability in Geological Context
Faculae in the Hesiod region provide two additional advantages with respect to their geological context. First, the five faculae officially named Pampu, Ular, Sarpa, Havu, and Bitin are clustered as are many in the Caloris basin, although in a different setting. In fact, those five identified faculae are so close to each other that they may originate from the same magma source. This is another opportunity to analyze the spectral properties of a cluster to infer properties on the source. Second, the Hesiod faculae are very close to the Kuniyoshi crater where faculae are described as potentially Kuiperian-aged (<1 Ga) (Thomas et al., 2014). Therefore, the Hesiod region provides an opportunity to see if space weathering of faculae (and its time dependency) could affect the spectral properties. The selected faculae also sample the influence of craters as host of the faculae. For instance, the faculae Suge, Agwo, Slang, Orm, and the deposits located at the Hesiod, Lermontov, Geddes, and Mistral craters are hosted in craters of various sizes, whereas Nathair Facula has no crater host. Finally, we also selected faculae that have a clear visible vent (e.g., Nathair, Agwo), and faculae without easily identified vents (e.g., Orm, and Suge). Spectral parameters could also help to distinguish whether faculae without vents are related to explosive volcanism.
3. Spectral Analysis and Methods
Faculae have specific spectral properties in the UV, VIS, and NIR (Besse et al., 2015; Goudge et al., 2014; Izenberg et al., 2014; Kerber et al., 2011; Thomas et al., 2014) that differ from other bright features on Mer-cury's surface (e.g., fresh impact craters, hollows). Therefore, the analysis of faculae requires utmost care, specifically when those spectral properties (i.e., spectral slope variations) are changing at local scale. Pyro-clastic deposits are quasi-radial deposits thought to be created via the ballistic emplacement of rock and melt fragments from a central vent in absence of a substantial atmosphere and atmospheric circulation (Brož et al., 2018). The distance to which a pyroclast is emplaced depends on the energy by which it was pro-pelled from the vent, and the angle of dispersion from the volcanic conduit. For this reason, understanding any changes in the deposit with distance can help in our interpretation of its formation. Using the avail-able products from the MASCS spectrometer at the time of writing, Goudge et al. (2014) concluded that intrinsic variability, and mixing with the background material are the most probable factors explaining the spectral variability among faculae. Although the two factors are with no doubt causing to a certain extent the spectral variability observed, the fact that footprints were selected and analyzed regardless of their dis-tance to the vent by Goudge et al. (2014) is certainly affecting the analysis. Besse et al. (2015) found evidence that spectral variability is important within faculae themselves, thus reenforcing the fact that interfaculae comparison should be made with care.
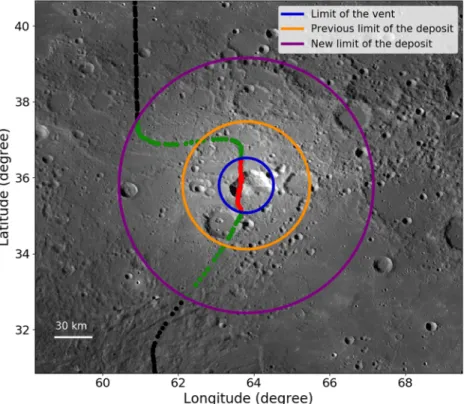
Additional calibration steps with respect to the data set downloaded at the Planetary Data System were applied using the approach mentioned in Besse et al. (2015). Spectral parameters are calculated on spectra collected by MASCS, respectively, the Visible Imaging Spectrometer (VIS) covering wavelengths from 300 to 900 nm and the Near-Infrared Imaging Spectrometer (NIR) for the wavelengths between 900 and 1,450 nm. The temperature variation within Mercury's environment between dayside and nightside of the planet strongly affects the NIR channel, which is much more sensitive to these variations than the VIS channel, and results in producing a lot of noise in the data (Izenberg et al., 2014). We use a simplifying assumption that faculae, on airless bodies like Mercury, should be circular and centered at the source of the eruption. The source is here considered as a point source, with a given vent radius (Rv, the blue circle of Figure 2). Given that the methodology aims at processing several hundred of footprints over one facula, the approx-imation of the vent radius is done in a conservative way. The consequence is that some footprints located outside of the vent are not processed as they are considered to be part of the circular approximation of the vent, as seen in Figure 2. This approximation is conservative and do not change the results of this study. The estimated radius of the pyroclastic deposit from this study, which lies beyond the edges of the vent, is noted Rn (the purple circle of Figure 2). To optimize the selection of MASCS footprints, initial measurements of the faculae extent are obtained from Kerber et al. (2011) as a starting point (Ro, the orange circle). This is revised in this study (Rn, the purple circle). As a general approach, we also select footprints located as far as twice the proposed radius of the faculae to accommodate for possible underestimated size. After the selec-tion of the spectra, the algorithm described in Besse et al. (2015) is used to obtain calibrated spectra on the entire 300–1,450 nm domain.
Journal of Geophysical Research: Planets
10.1029/2018JE005879
Figure 2. Schematic of Nathair Facula with footprints of one MASCS orbit. The source and its estimated radius
corresponds to the blue circle and noted Rv in the text, while the estimated radius of the facula from this study corresponds to the purple circle and noted Rn in the text. The previous estimated radius of the facula by Kerber et al. (2011) corresponds to the orange circle and noted Ro in the text. The green footprints, whose center is located within the facula are selected for the analysis. The black footprints are rejected because they are outside the facula. The red footprints are preserved but not used in this analysis because they are inside the vent.
The UV downturn and the VIS slope were first introduced by Goudge et al. (2014) while calculating the VIS slope of the spectrum on the domain 550–750 nm. In this analysis, we extend this domain to 445–750 nm to increase the statistics used for deriving the slope. The mathematical definition of the spectral parameters is summarized in Table 1. Moreover we calculate the slope of the spectrum in the near-infrared (NIR) domain. The VIS and NIR slopes are normalized to those of the Mercury Mean Spectrum corresponding to the mean value of more than 850,000 spectra of MASCS (Izenberg et al., 2014).
4. Results
4.1. Nathair Facula, the Largest Known Facula
Table 1
Summary of the Spectral Parameters Used to Highlight the Characteristics of the Faculae
Name Spectral range (nm) Mathematical definition UVdownturn 300–400 Depth300 + Depth325 +
Depth350(Goudge et al.,
2014)
VIS slope 445–750 (Re𝑓lectance(750)−Re𝑓lectance(445)
750−445
)
NIR slope 1,050–1,400 (Re𝑓lectance(1400)1400−1050−Re𝑓lectance(1050)) Color index 310/390 Reflectance(310)∕Reflectance(390)
415/750 Reflectance(415)∕Reflectance(750)
700/1,300 Reflectance(700)∕Reflectance(1300)
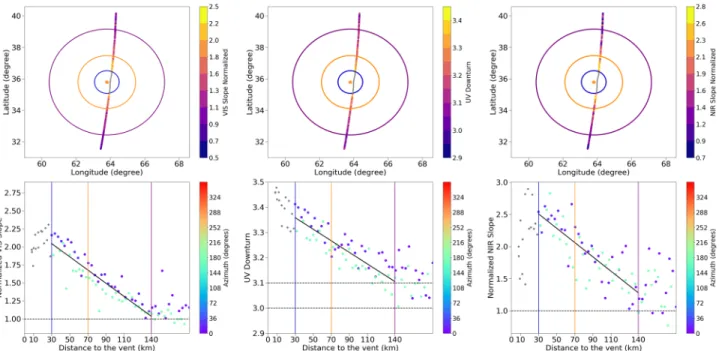
The excellent coverage of Nathair Facula, which is the largest known example on Mercury, is ideal to analyze orbits contain-ing a large number of spectra with relatively small footprints. In Figure 3, the evolution of spectral parameters UV downturn, normalized VIS slope, and normalized NIR slope for the orbit ob2-12212-072558 is presented.
The spectral parameters reach their maximal values near the edge of the volcanic vent and then decrease linearly until reaching respectively 3.1 (i.e., value of UV downturn for the average spec-trum of Mercury) and 1.0 (i.e., average value of normalized VIS slope and normalized NIR slope for Mercury). This linear decrease, however, does not agree with the proposed edges of the facula extent, represented by the orange circle at 70 km on Figure 3. This analysis shows that the decrease goes much further to a distance of about 140 km from the vent, and this may correspond to the actual extent of the pyroclastic deposits. In
Figure 3. Variability of the spectral parameters along the orbit ob2-12212-072558 in Nathair Facula. The top three panels represent planviews of the same orbit,
color coded based on the strength of spectral criteria (north is up, corresponding to azimuth 0/360). The plotted orbit is a series of footprints described by its center and four points representing the ellipse. In this case, all the points are superposed given the high resolution of the observation. The bottom three panels display the evolution of each spectral criterion with respect to the vent center distance, color coded based on the geographical azimuth. The orange and purple circles indicate respectively the size of the facula estimated by Kerber et al. (2011) using fly-by imaging, and the one used in this analysis similarly as described in Figure 2.
their revised analysis of Nathair facula, Thomas et al. (2015) reported a radius of 130 km for Nathair facula, a value that is in agreement with our measurement.
Thus, it is concluded that the decrease in spectral parameters with distance from the center of the faculae observed on the faculae of Caloris in Besse et al. (2015) is also observable in the case of Nathair Facula and that spectral properties of faculae could be used to estimate their sizes.
4.2. The Diversity of Faculae in the Hesiod Area
The Hesiod region hosts at least five faculae close to each other. Those faculae have been named Pampu, Ular, Sarpa, Havu, and Bitin Faculae in order of increasing latitude. The description of the results concerning the faculae in the Hesiod region is focused on Havu facula, and Bitin Facula because they have contrasting results. Those two faculae highlight the spectral variability that could be found in the faculae of the Hesiod region, while the interpretation of all the faculae of the Hesiod region is discussed in Section 5.
Regarding Havu facula, the boundaries of the pyroclastic deposit, whose vent is located between two craters, are not confined within any morphological apparent structure (as will be shown differently in the case of the Bitin facula) and the decrease of spectral parameters gives a clear estimation of its size. In fact, in this particular case, the previous estimate of the radius of the deposits (Kerber et al., 2011) turns out to match very well the decrease of the spectral parameters. As seen in Figure 4, both the VIS slope and UV downturn show a linear decrease that reach Mercury's average at the expected value. In the case of Hesiod in general, the NIR slope is not conclusive. The lower SNR is most likely due to variations of the instrument temperature. It is also interesting to notice that the size of the footprints of the Havu facula observations are much bigger than the footprints of the Nathair facula observations. This confirms that spatial resolution is not biasing the result, as discussed in Section 2.
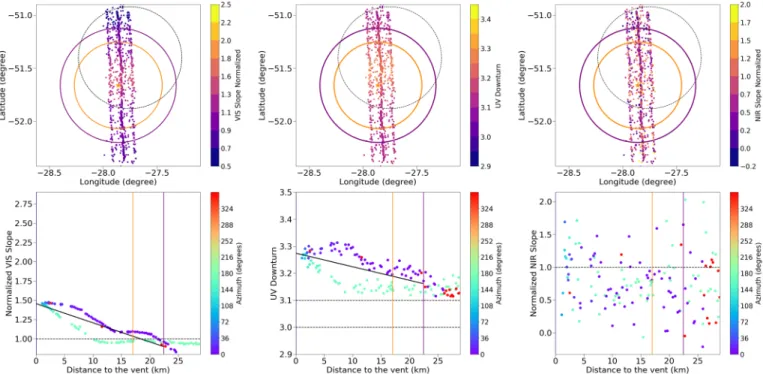
The case of Bitin facula is a case of a facula extent likely limited by its geological context, and its host crater. As described in Section 3, the used methodology postulate is that the faculae are deposited isotropically around the center of the source. Therefore, as soon as this assumption does not hold anymore, specific variability can be found through a deviation to the linear decrease as a function of distance, as seen in Figure 5. The Bitin facula is located on the southern part of the crater (i.e., dashed line in Figure 5). Both
Journal of Geophysical Research: Planets
10.1029/2018JE005879
Figure 4. Variability of the spectral parameters along the orbit orb-11271-134129 in Havu facula. The top three panels describe the footprints of the orbit, and
the bottom panels the normalized VIS slope as a function of distance, the UV downturn, and the normalized NIR slope. Same color codes as in Figure 3 are used. For this observation located in the southern hemisphere, the resolution is not as good as for Nathair Facula, and the width of the footprints can be seen.
the VIS slope and the UV downturn show important dichotomies in this north-south orbit. In the VIS slope, the southern part of the orbit (cyan color) is rapidly dropping to Mercury's average and similarly for the UV downturn. The northern part of the orbit has a smoother decrease of the spectral parameters, although not
Figure 5. Variability of the spectral parameters along the orbit ob2-12082-072309 in Bitin facula. The top three panels describe the footprints of the orbit,
and the bottom panels the normalized VIS slope as a function of distance, the UV downturn, and the normalized NIR slope. Same color codes as in Figure 3 are used.
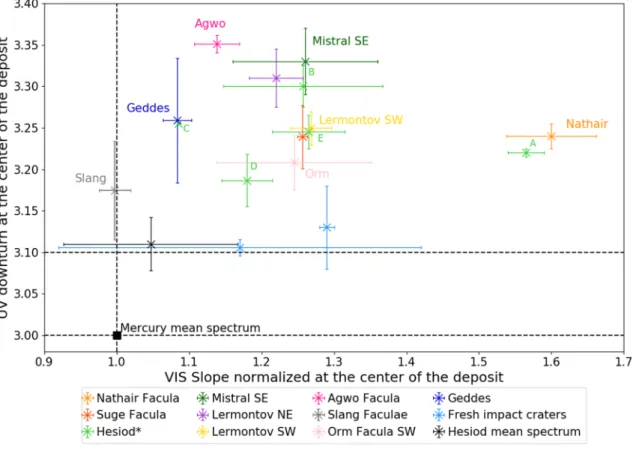
Figure 6. Normalized parameter space for selected faculae in the visible and ultraviolet domains. The Mercury mean spectrum corresponds to that of Izenberg
et al. (2014), while the Hesiod Mercury mean spectrum average is derived from a flat and featureless region north of Hesiod. The two fresh craters represent different stages of crater degradation with the one on the right appearing morphologically fresher than the other one.
linear. This could be explained by the edges of the host crater which are much further away, and thus do not disturb the distribution of the pyroclastic deposits. In fact, the drop of the spectral parameters to Mercury's average in the southern part corresponds exactly to the location of the edge of the host crater. This edge could be seen as a physical barrier for the expansion of the pyroclastic deposits. Nevertheless, even in this case of an external factor that probably controls the distribution of faculae on the surface, the VIS slope and UV downturn behave similarly. Unfortunately, the NIR slope is similar to the case of Havu facula, and cannot be used.
4.3. Expanding the Spectral Analysis to Multiple Faculae
Faculae have an intrinsic spectral variability, which means that simple spectral comparisons between facu-lae, such as the one done by Goudge et al. (2014) should be done carefully, as described in Section 3. Besse et al. (2015) emphasized that comparisons are possible if the spectra from different faculae are taken at similar location from their vents. In this analysis, we use as a reference point the spatial midpoint between the center of the vent, and the edge of the facula. This approach will minimize the issue of intrinsic spectral variability as a function of distance; however, it will not sufficiently mitigate the intrinsic variability in the case of compound vents such as Agwo (Rothery et al., 2014). Although it would be very interesting to select a reference point closer to the vent so that it would increase the signal, the analysis of many MASCS orbits has shown that the likelihood of having the orbit in the first third of the distance to the vent is very low. Thus, to globally compare the spectral properties of faculae, spectra located at the spatial midpoint between the center of the vent, and the edge of the faculae are extracted and plotted in Figure 6.
As already mentioned in previous studies (Goudge et al., 2014; Head et al., 2008; Kerber et al., 2011; Thomas et al., 2014), faculae appear “redder” than Mercury's average (i.e., the spectral slope is increasing with wave-length). Additionally, faculae have a more pronounced downturn in the UV, stronger than those of Mercury average (Besse et al., 2015; Goudge et al., 2014). An averaged floor spectra of the Hesiod region taken, in a faculae-free environment, shows that in that area the average floor in the UV downturn is higher by 0.1, and
Journal of Geophysical Research: Planets
10.1029/2018JE005879
slightly higher (i.e., with respect to Izenberg et al., 2014 values) for the VIS slope (i.e., dark cross in Figure 6). UV downturn parameter values for all faculae studied are greater than 3.15, and none of the values are found close to Mercury's average as reported in Goudge et al. (2014). This could be due to the limited selection of faculae of this study, and the consistent selection of spatial midpoint footprints to be compared. Spectral parameters of two supposedly fresh impact craters given their morphologies (i.e., steep walls, bright ejecta rays) are plotted. Faculae are easily distinguishable from other common features such as Mercury's average background, or impact craters regardless of their weathering state. The spread of values in UV downturn is difficult to interpret, as already noted by Goudge et al. (2014). However, faculae that contain compound vents have a stronger UV downturn (i.e., Mistral, Agwo, Lermontov). From the VIS slope parameter, some faculae are shown to be among the reddest material on the surface of Mercury, as described in Izenberg et al. (2014) (Figure 5c).
5. Discussion
Pyroclastic deposits are dispersed on most of the surface of Mercury. Previous spectral analyses of Goudge et al. (2014) and Besse et al. (2015) highlighted both the variability of the faculae and their similarity. With this improved analysis of additionally selected faculae, it is now possible to infer spectral properties that will better describe the properties of facuale.
5.1. Multiwavelength Slopes and Extent of Faculae
Table 2
Properties and Newly Estimated Radius of Faculae Analyzed in This Study
ID Facula/e Latitude Longitude Rv Rokerber Rn
1 Nathair 35,8 63,8 30 70 140 2 Suge 26,2 59,8 0 20 23 3 Pampu −57,2 −31,7 0 30 40 4 Ular −55,03 −29,92 5 24 30 5 Sarpa −53,16 −30,75 5 30 30 6 Havu −52,22 −28,45 3.7 20 20 7 Bitin −51,66 −27,86 0 17 22,5 8 Mistral SE 4,2 −54,2 0 19 19 9 Lermontov NE 15,8 −48,2 6 33 40 10 Lermontov SW 15,1 −49,1 5 31 45 11 Agwo 22,3 146,2 8 24 35 12 Slang 24,3 −179 0 54 54 13 Orm 26 −60,3 3 18 28 14 Geddes 27,2 −29,5 13 21 27
Note.Radius for Rv, Ro, and Rn are in kilometers. When Rv is equal to zero, it
means that no vent was identified. Ro measurement is taken from Kerber et al. (2011).
Nathair Facula shows a clear decrease of the VIS slope, UV down-turn and NIR slope parameters as a function of distance. The decrease is linear, and given the numerous spectra selected for the analyses (i.e.,> 5000), this is a robust detection. Although not as linear as in the case of Nathair Facula, the deposits of the Hesiod region (i.e., Bitin and Havu Faculae) also show a decrease of the VIS slope and UV downturn as a function of distance. This decrease was also noted by Besse et al. (2015) for various faculae in Caloris. The slope and shape of these decreases differ between the faculae. In the case of Nathair Facula, the slopes of the UV, VIS, and NIR parameters are extremely well constrained from the north to the south sides, as shown in Figure 3. They all point to the same dis-tance at which Mercury's background becomes dominant. The fact that all the three different wavelength regimes behave the same is indicative of a mechanism that will affect the spectral response of a surface in a similar way. Based on previous suggestions of pos-sible space weathering, grain size, and compositional effects, it is difficult to explain how composition or space weathering (see later Section 5.2) will affect the slopes similarly in the UV, VIS, and NIR domains. The addition of an opaque phase could affect all three slopes in the same way, although it is difficult to explain how that would affect specifically the faculae given that nanophase iron is often invoked as an opaque phase, and is not related to the volcanic eruption (Noble & Pieters, 2003). Other constituents could be invoked such as sulfides, or sulfur, the latter being proposed to be a possible driver of pyroclastic explosions (Kerber et al., 2009). Conversely, the pro-posed depletion in sulfides of facula as observed by the XRS instrument (Weider et al., 2016) could explain spectral variability in the different wavelength domains; however, measurements were only done on one facula, and thus cannot yet be extrapolated to all faculae. Regolith mixing could also explain this trend given that a mixed regolith with the substrate (e.g., Mercury's background) is expected as a function of distance from the source (Goudge et al., 2014). However, studies of regolith mixing impact on spectral slopes in dif-ferent wavelengths domains is lacking, thus limiting the conclusion. Analysis on the lunar surface by Jawin et al. (2015) were focused on the absorption bands only. Therefore, regolith mixing, changes in grain sizes, and/or the presence of an opaque/mineral phases could all contribute to the variability of specral properties in all wavelength domains.
From all the faculae analyzed following the approach described in sections 3, and 4, the proposed new radius for 14 faculae is summarized in Table 2. The result of this analysis shows that around 65% of the faculae have a radius larger than previously mapped in the analysis by Kerber et al. (2011). This result highlights that previous mapping of faculae would need to be revisited. Although this revision was started based on MDIS images (Thomas et al., 2014), a combined approach with spectral observations from MASCS would provide an objective analysis of the faculae sizes. The mapping of the faculae done by Kerber et al. (2011) was used as inputs to derive the amount of volatiles needed to explain the distribution of faculae. As presented in this analysis, if the extent of the faculae is systematically underestimated (e.g., Nathair facula, Bitin Facula), the derived volume of volatiles will be inaccurate and likely underestimated (by up to a factor of 2 given that the volume of volatiles is mostly proportional to the size of the facula).
5.2. Spectral Parameter Space of Faculae
As already discussed in previous studies (Besse et al., 2015; Goudge et al., 2014), the increase of the UV downturn could be caused by either a lower iron content or an increase in grain size with respect to the surface on which they land. Additionally, sulfides may also affect the UV downturn, see Section 5.4. In the visible, it is interesting to find that the faculae are similar or even much redder than fresh impact craters (Figure 6). Although Thomas et al. (2014) proposed that some of the faculae are extremely young, it is dif-ficult to conceive that all will be very young based solely on the comparison of spectral slopes in the visible with fresh looking craters. The Nathair Facula is dated at 3.3 Ga, (Thomas et al., 2014), and explosive vol-canism at Kuniyoshi crater is dated to be Kuiperian (Thomas et al., 2014), based on the freshness of the crater morphology, the possible presence of rays, and the sparseness of superimposed craters. Pampu facula is located 120 km to the east of the Kuniyoshi crater. Although Pampu facula is not necessarily of the same age as the facula at Kuniyoshi crater, Pampu and Nathair Faculae have the similar and “reddest” slope in the visible of all the sampled facula, and yet the time range of those faculae could span over billion of years. Therefore, the correlation between the VIS Slope and the age is not necessarily straightforward.
One important piece of information from Figure 6 is the nonlinear relationship between increases in VIS slope and UV downturn. The two best documented faculae are certainly Agwo in Caloris (Rothery et al., 2014; Besse et al., 2015; Blewett et al., 2014) and Nathair (Kerber et al., 2011). They do not follow the linear relationship or correlation with age as already mentioned by Goudge et al. (2014) (Figures 11b, 12, and 14). Similarly to what was described before, the amount of mixing with the underlying material, differences in grain sizes, and/or the presence of opaque/mineral phases could explain those variations.
Finally, the last important lesson from Figure 6 is the fact that pyroclastic deposits can be spectrally isolated from the rest of Mercury's features. From this analysis which is still statistically limited, a combination of UV and VIS empirical values could allow the extraction of faculae. For instance, UV downturn above 3.2 and VIS slope above 1.15 would select most of the faculae analyzed here while leaving aside Mercury's background, fresh craters, and a small number of faculae already identified from MDIS images. This kind of backward processing of all the orbits of MASCS is beyond the scope of this paper but needs to be investigated to help in the identification and mapping of faculae.
5.3. Space Weathering Likely Not a Controlling Factor for the Spectral Variability of Faculae
Variations of the UV downturn in particular, and also the VIS slope could be also produced by means of space weathering. This was already described as less likely by Goudge et al. (2014) and Besse et al. (2015). In this analysis, two additional lines of evidences could be extracted to emphasize that space weathering is the less likely process at the origin. Space weathering combines a mixture of processes that modify a surface, physically and chemically. By changing the spatial location of the selected faculae, it is possible to explore the potential impact of individual processes of the space weathering such as temperature and magnetic shielding.
First, the spin orbit resonance results in two hot poles on the equator at longitudes 0◦and 180◦E where noon-time temperature is about 100 K higher than at the cold poles at 90◦and 270◦E and can contribute to spectral changes. Using the careful selection of spectra described earlier, no correlation can be found between the variability of the UV downturn and/or VIS slope with the longitude of the faculae, and thus potentially with the hot spots. Given the spectral similarities that are observed for faculae at different longitude, it is very unlikely that the spectral changes are produced by individual weathering processes of the faculae. However, this result does not mean that faculae are not experiencing weathering processes at all. The entire surface of
Journal of Geophysical Research: Planets
10.1029/2018JE005879
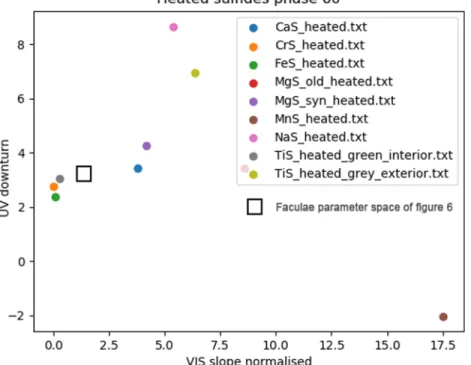
Figure 7. Values of VIS slope and UV downturn similarly calculated as previously for laboratory measurements of
various sulfides (Varatharajan et al., 2019).
Mercury experiences continual weathering, however, this could not explain the spectral variability observed at the faculae.
5.4. Laboratory Measurements to Infer Compositional Variations
One of the still relevant questions is about the process/composition that makes these faculae redder and different in the UV than Mercury's average surface. Some crucial information comes from the elemental abundances measured by the MESSENGER X-ray Spectrometer Nittler et al. (2011). The high abundance of sulfur and sulfides could be a good candidate to explain the spectral properties of faculae. In fact, Blewett et al. (2013) have shown that the lack of sulfides could be an explanation of the “bluer” spectra of Mercury's hollows. In the case of the faculae, a higher concentration of sulfides will increase the reddening of the spectra with respect to the rest of Mercury's surface. Additionally, Helbert et al. (2013) highlighted that the lack of sulfides could increase the reflectance, as shown previously for faculae by Kerber et al. (2011). Furthermore, sulfur is a volatile species linked to explosive volcanism on Earth and abundant on Mercury. Kerber et al. (2011) modeled the abundances in ppm of volatile species needed to produce the extent of the faculae identified before orbit insertion of the MESSENGER spacecraft. Species like SO2and H2Scould be
the volatile driver of explosive volcanism on Mercury.
Following the spectral analysis done with the MASCS data, a similar analysis was performed on specific samples measured with the Planetary Spectroscopy Laboratory (PSL) at DLR (Maturilli et al., 2018). As seen in Figure 7, which is focusing on sulfides (Varatharajan et al., 2019), some specific sulfides compositions match the parameter space of the faculae for UV downturn and VIS slope. In particular, the CrS, FeS, and TiS are rather close to the values of faculae, with a VIS slope normalized of 0–0.5 (so they exhibit flatter VIS spectra than Mercury average), and a UV downturn of 2–2.5 to 3. However, given the diversity of composition and responses in the spectral parameters of all the samples, it is also difficult to point with certitude to one composition, and a direct link to faculae composition will be very uncertain. On top of that, laboratory measurements are made on pure sulfides, which corresponds to conditions impossible to find on the surface or Mercury. Therefore, the important factor here is the trend toward strongly increased UV downturn and moderately increased VIS slope that are both visible in laboratory measurements and orbital data.
However, analysis by Weider et al. (2016) using the MESSENGER X-ray Spectrometer have shown that Nathair Facula is in fact depleted in sulfur due to possible loss in the eruption itself. This result, and the lack of sulfides in the facula, is in agreement with the higher reflectivity of the facula with respect to Mercury's
average. The lack of X-ray measurements with energetic solar flare (needed to detect specific species in X-ray spectroscopy) over other faculae than Nathair from MESSENGER, and the limited samples analyzed in labo-ratory are limiting the conclusions. Future orbital measurements from the BepiColombo mission (Benkhoff et al., 2010) will help in determining if the properties seen at Nathair Facula are repeated at other faculae.
6. Conclusion
While extensive analysis and care is required to extract information from the MASCS observations, the sci-entific analysis of a selection of 14 faculae on the surface of Mercury is helpful to better characterize the properties of explosive volcanism. The unusual geometrical conditions of the MASCS spectrometer with high phase angle, and the limited sample of faculae analyzed, are preventing definitive conclusions on the nature of faculae. Nonetheless, it is proposed that the spectral variability observed on the faculae of Mercury could be associated with either (i) the amount of mixing of pyroclastic materials with the underlying mate-rial (which can be expected to increase with age), (ii) differences in grain sizes intrafaculae and interfaculae, (iii) the presence of opaque/mineral phases, and potentially a combination of any of those three. Decoupling the various influences of each process would require extensive modeling of the MASCS data set.
Dedicated analysis from the Simbio-Sys instrument (Flamini et al., 2010), the MIXS instrument (Fraser et al., 2010), and the MERTIS instrument (Hiesinger & Helbert, 2010) on-board the BepiColombo spacecraft (Benkhoff et al., 2010) will certainly help in confirming the additional contribution of space weathering and mineralogical composition in the spectral variability of faculae. Given that the pointing geometry of the Simbio-Sys instrument, and in particular the VIHI spectrometer will be in much more favorable conditions (i.e., nadir looking with moderate phase angle, it is expected that the interpretation of the spectral properties will be easier and certainly interesting to compare to MASCS.
While using the spectral parameters as a means to evaluate the extent of pyroclastic deposits, this analysis has shown that in some cases (e.g., Nathair and Bitin faculae) the extent of the pyroclastic deposits has been underestimated. This has important implications for deriving the total volume of volcanic materials that erupted on the surface, and the total amount of volatiles inside the planet that has contributed to explosive volcanism, as previously estimated by Kerber et al. (2011). In view of this analysis, a large-scale reassessment of the size of pyroclastic deposits should certainly be done.
References
Benkhoff, J., van Casteren, J., Hayakawa, H., Fujimoto, M., Laakso, H., Novara, M., et al. (2010). BepiColombo—Comprehensive exploration of Mercury: Mission overview and science goals. Planetary and Space Science, 58, 2–20.
Besse, S., Doressoundiram, A., & Benkhoff, J. (2015). Spectroscopic properties of explosive volcanism within the Caloris basin with MESSENGER observations. Journal of Geophysical Research: Planets, 120, 2102–2117. https://doi.org/10.1002/2015JE004819 Blewett, D. T., Levy, C. L., Chabot, N. L., Denevi, B. W., Ernst, C. M., & Murchie, S. L. (2014). Phase-ratio images of the surface of Mercury:
Evidence for differences in sub-resolution texture. Icarus, 242, 142–148.
Blewett, D. T., Vaughan, W. M., Xiao, Z., Chabot, N. L., Denevi, B. W., Ernst, C. M., et al. (2013). Mercury's hollows: Constraints on formation and composition from analysis of geological setting and spectral reflectance. Journal of Geophysical Research: Planets, 118, 1013–1032. https://doi.org/10.1029/2012JE004174
Brož, P., ˇCadek, O., Wright, J., & Rothery, D. A. (2018). The apparent absence of kilometer-sized pyroclastic volcanoes on Mercury: Are we looking right? Geophysical Research Letters, 45, 12,171–12,179. https://doi.org/10.1029/2018GL079902
Byrne, P. K., Klimczak, C., Williams, D. A., Hurwitz, D. M., Solomon, S. C., Head, J. W., et al. (2013). An assemblage of lava flow features on Mercury. Journal of Geophysical Research: Planets, 118, 1303–1322. https://doi.org/10.1002/jgre.20052
Byrne, P. K., Ostrach, L. R., Fassett, C. I., Chapman, C. R., Denevi, B. W., Evans, A. J., et al. (2016). Widespread effusive volcanism on Mercury likely ended by about 3.5 Ga. Geophysical Research Letters, 43, 7408–7416. https://doi.org/10.1002/2016GL069412
Byrne, P. K., Whitten, J. L., Klimczak, C., Mccubin, F. M., & Ostrach, L. R. (2018). The volcanic character of Mercury. In S. Solomon, L. Nittler, & B. Anderson (Eds.), Mercury the view after messenger, Cambridge Planetary Science (pp. 287–323). Cambridge: Cambridge University Press. https://doi.org/10.1017/9781316650684.012
Denevi, B. W., Ernst, C. M., Meyer, H. M., Robinson, M. S., Murchie, S. L., Whitten, J. L., et al. (2013). The distribution and origin of smooth plains on Mercury. Journal of Geophysical Research: Planets, 118, 891–907. https://doi.org/10.1002/jgre.20075
Domingue, D. L., Chapman, C. R., Killen, R. M., Zurbuchen, T. H., Gilbert, J. A., Sarantos, M., et al. (2014). Mercury's weather-beaten surface: Understanding Mercury in the context of lunar and asteroidal space weathering studies. Space Science Review, 181, 121–214. Flamini, E., Capaccioni, F., Colangeli, L., Cremonese, G., Doressoundiram, A., Josset, J. L., et al. (2010). SIMBIO-SYS: The spectrometer
and imagers integrated observatory system for the BepiColombo planetary orbiter. Planetary and Space Science, 58, 125–143. Fraser, G. W., Carpenter, J. D., Rothery, D. A., Pearson, J. F., Martindale, A., Huovelin, J., et al. (2010). The mercury imaging X-ray
spectrometer (MIXS) on BepiColombo. Planetary and Space Science, 58(1-2), 79–95.
Goudge, T. A., Head, J. W., Kerber, L., Blewett, D. T., Denevi, B. W., Domingue, D. L., et al. (2014). Global inventory and characterization of pyroclastic deposits on Mercury: New insights into pyroclastic activity from MESSENGER orbital data. Journal of Geophysical Research:
Planets, 119, 635–658. https://doi.org/10.1002/2013JE004480
Hawkins, S. E., Boldt, J. D., Darlington, E. H., Espiritu, R., Gold, R. E., Gotwols, B., et al. (2007). The Mercury dual imaging system on the MESSENGER spacecraft. Space Science Review, 131, 247–338.
Acknowledgments
ESA supported this research through the European Space Astronomy Centre (ESAC) Faculty council, together with an extended visit of O. Barraud at ESAC. Doressoundiram acknowledges the support of CNES. The MASCS data used in this paper are available at the PDS Geosciences Node of Washington University, St. Louis, USA. The data set
mess-e_v_h-mascs-3-virs-cdr-caldata-v1/messmas_2101/data/ddr/was used which contains the latest calibration provided by the MESSENGER science team during the postoperation phase. Sebastien Besse acknowledges the support of numerous MESSENGER team members in answering questions regarding the understanding of the mission, and the MASCS observations. The authors thank the anonymous reviewer and Dave Rothery for their careful and constructive reviews, and Tanya Lim who provided great help in improving the flow of the manuscript.
Journal of Geophysical Research: Planets
10.1029/2018JE005879
Head, J. W., Chapman, C. R., Strom, R. G., Fassett, C. I., Denevi, B. W., Blewett, D. T., et al. (2011). Flood volcanism in the northern high latitudes of Mercury revealed by MESSENGER. Science, 333, 1853.
Head, J. W., Murchie, S. L., Prockter, L. M., Robinson, M. S., Solomon, S. C., Strom, R. G., et al. (2008). Volcanism on Mercury: Evidence from the first MESSENGER flyby. Science, 321, 69.
Helbert, J., Maturilli, A., & D'Amore, M. (2013). Visible and near-infrared reflectance spectra of thermally processed synthetic sulfides as a potential analog for the hollow forming materials on Mercury. Earth and Planetary Science Letters, 369, 233–238.
Hiesinger, H., & Helbert, J. (2010). The Mercury radiometer and thermal infrared spectrometer (MERTIS) for the BepiColombo mission.
Planetary and Space Science, 58, 144–165.
Izenberg, N. R., Klima, R. L., Murchie, S. L., Blewett, D. T., Holsclaw, G. M., McClintock, W. E., et al. (2014). The low-iron, reduced surface of Mercury as seen in spectral reflectance by MESSENGER. Icarus, 228, 364–374.
Jawin, E. R., Besse, S., Gaddis, L. R., Sunshine, J. M., Head, J. W., & Mazrouei, S. (2015). Examining spectral variations in localized lunar dark mantle deposits. Journal of Geophysical Research: Planets, 120, 1310–1331. https://doi.org/10.1002/2014JE004759
Jozwiak, L. M., Head, J. W., & Wilson, L. (2018). Explosive volcanism on Mercury: Analysis of vent and deposit morphology and modes of eruption. Icarus, 302, 191–212.
Kerber, L., Besse, S., Head, J. W., Blewett, D. T., & Goudge, T. A. (2014). The global distribution of pyroclastic deposits on Mercury: The view from orbit. Lunar and Planetary Science Conference, 45, 2862.
Kerber, L., Head, J. W., Blewett, D. T., Solomon, S. C., Wilson, L., Murchie, S. L., et al. (2011). The global distribution of pyroclastic deposits on Mercury: The view from MESSENGER flybys 1–3. Planetary and Space Science, 59, 1895–1909.
Kerber, L., Head, J. W., Solomon, S. C., Murchie, S. L., Blewett, D. T., & Wilson, L. (2009). Explosive volcanic eruptions on Mercury: Eruption conditions, magma volatile content, and implications for interior volatile abundances. Earth and Planetary Science Letters, 285, 263–271. Maturilli, A., Helbert, J., Varatharajan, I., D'Amore, M., & Hiesinger, H. (2018). a spectral library of emissivity spectra for MERTIS on
BepiColombo. LPI Contributions, 2047, 6060.
McClintock, W. E., & Lankton, M. R. (2007). The Mercury atmospheric and surface composition spectrometer for the MESSENGER mission. Space Science Review, 131, 481–521.
Nittler, L. R., Chabot, N. L., Grove, T. L., & Peplowski, P. N. (2018). The chemical composition of Mercury. In S. Solomon, L. Nittler, & B. Anderson (Eds.), Mercury the view after messenger, Cambridge Planetary Science (pp. 30–51). Cambridge: Cambridge University Press. https://doi.org/10.1017/9781316650684.003
Nittler, L. R., Starr, R. D., Weider, S. Z., McCoy, T. J., Boynton, W. V., Ebel, D. S., et al. (2011). The major-element composition of Mercury's surface from MESSENGER X-ray spectrometry. Science, 333, 1847–1850.
Noble, S. K., & Pieters, C. M. (2003). Space weathering on Mercury: Implications for remote sensing. Solar System Research, 37, 31–35. Prockter, L. M., Ernst, C. M., Denevi, B. W., Chapman, C. R., Head, J. W., Fassett, C. I., et al. (2010). Evidence for young volcanism on
Mercury from the third MESSENGER flyby. Science, 329, 668.
Rothery, D. A., Thomas, R. J., & Kerber, L. (2014). Prolonged eruptive history of a compound volcano on Mercury: Volcanic and tectonic implications. Earth and Planetary Science Letters, 385, 59–67.
Siegler, M. A., Bills, B. G., & Paige, D. A. (2013). Orbital eccentricity driven temperature variation at Mercury's poles. Journal of Geophysical
Research: Planets, 118, 930–937. https://doi.org/10.1002/jgre.20070
Solomon, S. C., McNutt, R. L., Gold, R. E., & Domingue, D. L. (2007). MESSENGER mission overview. Space Science Review, 131, 3–39. Solomon, S. C., McNutt, R. L., & Prockter, L. M. (2011). Mercury after the MESSENGER flybys: An introduction to the special issue of
Planetary and Space Science. Planetary and Space Science, 59, 1827–1828.
Thomas, R. J., Rothery, D. A., Conway, S. J., & Anand, M. (2014). Long-lived explosive volcanism on Mercury. Geophysical Research Letters,
41, 6084–6092. https://doi.org/10.1002/2014GL061224
Thomas, R. J., Rothery, D. A., Conway, S. J., & Anand, M. (2014). Mechanisms of explosive volcanism on Mercury: Implications from its global distribution and morphology. Journal of Geophysical Research: Planets, 119, 2239–2254. https://doi.org/10.1002/2014JE004692 Thomas, R. J., Rothery, D. A., Conway, S. J., & Anand, M. (2015). Explosive volcanism in complex impact craters on Mercury and the Moon:
Influence of tectonic regime on depth of magmatic intrusion. Earth and Planetary Science Letters, 431, 164–172.
Varatharajan, I., Maturilli, A., Helbert, J., Alemanno, G., & Hiesinger, H. (2019). Spectral behavior of sulfides in simulated daytime surface conditions of Mercury: Supporting past (MESSENGER) and future missions (BepiColombo). Earth and Planetary Science Letters, 520, 127–140.
Weider, S. Z., Nittler, L. R., Murchie, S. L., Peplowski, P. N., McCoy, T. J., Kerber, L., et al. (2016). Evidence from MESSENGER for sulfur-and carbon-driven explosive volcanism on Mercury. Geophysical Research Letters, 43, 3653–3661. https://doi.org/10.1002/2016GL068325 Weider, S. Z., Nittler, L. R., Starr, R. D., McCoy, T. J., Stockstill-Cahill, K. R., Byrne, P. K., et al. (2012). Chemical heterogeneity on Mercury's surface revealed by the MESSENGER X-Ray Spectrometer. Journal of Geophysical Research: Planets, 117, E00L05. https://doi.org/10. 1029/2012JE004153