Design guidelines for optical resonator biochemical sensors
The MIT Faculty has made this article openly available. Please share
how this access benefits you. Your story matters.
Citation Juejun Hu, Xiaochen Sun, Anu Agarwal, and Lionel C. Kimerling, "Design guidelines for optical resonator biochemical sensors," J. Opt. Soc. Am. B 26, 1032-1041 (2009) http://www.opticsinfobase.org/ abstract.cfm?URI=josab-26-5-1032
As Published http://dx.doi.org/10.1364/JOSAB.26.001032
Publisher Optical Society of America
Version Author's final manuscript
Citable link http://hdl.handle.net/1721.1/49440
Terms of Use Creative Commons Attribution-Noncommercial-Share Alike
Design guidelines for optical resonator biochemical sensors
Juejun Hu,* Xiaochen Sun, Anu Agarwal,* and Lionel C. Kimerling
Microphotonics Center, Massachusetts Institute of Technology, Cambridge, MA 02139, USA
*
Corresponding authors: [email protected], [email protected]
In this paper, we propose a design tool for dielectric optical resonator-based biochemical refractometry sensors. Analagous to the widely accepted photodetector figure-of-merit, the detectivity D*, we introduce a new sensor system figure of merit, the time-normalized sensitivity S*, to enable quantitative, cross-technology-platform comparison between resonator sensors with distinctive device designs and interrogation configurations. The functional dependence of S* on device parameters, such as resonant cavity quality factor (Q), extinction ratio, system noise, and light source spectral bandwidth, is evaluated using a Lorentzian peak fitting algorithm and Monte-Carlo simulations, to provide theoretical insights and useful design guidelines for optical resonator sensors. Importantly, we find that S* critically depends on the cavity Q-factor, and this paper develops a method of optimizing sensor resolution and sensitivity to noise as a function of cavity Q-factor. Finally, we compare the simulation predictions of sensor wavelength resolution with experimental results obtained in Ge17Sb12S71 resonators, and good agreement is confirmed. © 2008 Optical Society of America
OCIS codes: 130.3120, 130.6010, 230.5750, 280.0280, 280.1415, 280.1545.
Recently there has been an increasing interest in employing dielectric optical micro-resonators (resonant/optical cavities) as miniaturized biochemical sensors, and such a sensing mechanism has been demonstrated using a number of resonator devices including spheres [1], micro-rings [2-4], micro-disks [5], micro-toroids [6], capillary tubules [7-8], and photonic crystal cavities [9-10]. Optical resonance in low loss dielectric structures (in contrast to surface plasmon resonance on metal-dielectric interface, which is accompanied by large optical losses and resonant peak broadening) leads to strong photon-molecule interactions, and therefore high sensitivity. Furthermore, as a sensing device platform, the planar nature of integrated optical resonators such as rings/disks and 2-d photonic crystals allows robust on-chip coupling suitable for high volume production and field use, unique advantages over their non-planar counterparts.
Despite the great variety of resonator configurations for sensing, basically two major sensing mechanisms have been proposed in resonator-based sensors: refractive index sensing and absorption sensing [11]. The former mechanism requires the detection of molecular binding-induced refractive index change near the sensor surface, accomplished by measuring the optical resonant frequency shift of a high-Q resonator. In this case, the specificity/selectivity of the sensor relies on functional surface coatings that bind only to a specific type of target molecule, such as in antibody-antigen pairs and complimentary DNA strands. Figure 1 schematically illustrates an optical resonator refractive index sensor system we discuss in this paper, which consists of a sensor device (a waveguide-coupled optical resonator), a light source, and signal read-out components. For absorption sensing, the optical absorption of chemical molecules near the sensor surface leads to a detectable resonant peak extinction ratio change accompanied by a resonant cavity Q-factor decrease. Therefore, it is possible to perform absorption spectroscopy at resonant wavelengths (multiple longitudinal modes) of a resonator, simply by measuring its
transmission spectra. The characteristic absorption fingerprint can be used to differentiate between different molecules.
Despite a large body of published literature on resonator-based sensors, especially refractive index sensors, rigorous quantification of their performance matrices has been scarce [12]. Comparison between different sensor technologies and/or device configurations is impractical due to the absence of a widely accepted figure of merit (FOM). The quantity RI sensitivity, defined as the resonant peak wavelength shift (nm) per unit refractive index change (refractive index unit, RIU), has often been used to quantify surface plasmon resonance (SPR) sensor performance [13], and has also been quoted as a figure of merit for resonator refractometry sensors [14]. However, this criterion fails to take into account factors that can significantly affect resonator sensor performance, in particular resonant peak full width at half maximum (FWHM) which largely affects the wavelength resolution. Refractive index limit of detection (RI LOD), i.e. the minimum resolvable refractive index change of a sensor, offers an alternative description of sensor system performance. It depends on the measurement instrumentation (light source spectral width, which leads to a finite wavelength resolution of light source, and system noise characteristics) as well as on the noise bandwidth in a measurement. For instance, most types of noise can be effectively reduced by applying multiple scan averaging, and therefore even the same sensor system can yield very different RI LOD values. As a consequence, RI LOD is not an ideal performance measure for comparison between different sensing technology platforms.
In this paper, we first introduce a new system performance measure for optical sensors, time-normalized sensitivity S*, to enable quantitative comparison between sensor systems in the white noise limited regime. Then we use a resonant peak fitting algorithm and Monte-Carlo
simulations to investigate factors that affect the sensor limit of detection (LOD). We show that resonant peak fitting is a powerful tool to improve the sensor wavelength resolution to well below the resonant peak FWHM, in a way similar to computer algorithms for commercial SPR systems that calculate the exact position of the SPR peak minimum to a fraction of a single diode size [15]. Results of our Monte-Carlo simulations are used to derive optimum sensor designs. In addition to the white-noise-limited performance analysis, we also discuss non-white noise sources such as temperature fluctuations. Although we focus on index sensors in this paper, our sensor performance measures and peak fitting algorithm can easily be fine-tuned to absorption sensors.
Theory and Simulation
Definition of time-normalized sensitivity S*
We define time-normalized sensitivity S* of a sensor system as inverse of the index change ∆nmin that produces a SNR of unity, normalized to square root unit equivalent bandwidth
N f ∆ , i.e. min min min 2 2 1 * λ λ λ ⋅∆ Γ ⋅ ∆ = ∆ ⋅ ∆ = ∆ ⋅ ∆ = g iv RI n N f y Sensitivit N f n N f S (1)
with a unit of Hz1/2/RIU for refractive index sensors. Importantly, the term “time-normalized” suggests that S* is independent of noise bandwidth and hence measurement integration time, a necessary feature for a measurement system FOM (similar to detectivity D*, the FOM for photodetectors). In Eq. (1), ng is the group index of the resonator mode, λ stands for the operating wavelength, Γiv represents the optical power confinement factor in the interrogation volume (denoted as iv) since only a fraction of optical energy is interacting with the target
molecules, and the 2 factor comes in since we are looking into a wavelength shift by taking the difference of two independent transmission spectra measurements. The equivalent bandwidth
N f
∆
can have different expressions depending on the interrogation configuration. Three common interrogation configurations are wavelength interrogation, angular interrogation and intensity interrogation. In a wavelength interrogation scheme, transmission spectra of the resonator sensor are repeatedly measured to determine the time evolution of the resonant wavelength. As shown in Fig. 2, a spectroscopic scan of the transmission spectra usually is comprised of transmitted intensity measurements at N discrete wavelength values (and hence the name “wavelength interrogation”). If each transmitted intensity measurement at a single wavelength has an integration time τ and a corresponding single-measurement noise bandwidth ∆f (∆f ~ 2π/τ), the equivalent bandwidth of the sensor measurement becomes
N f
∆
(with the implicit and usually valid assumption that measurement rate is much smaller than laser scanning rate). In this case, N becomes inversely proportional to resonant cavity Q-factor if the light source spectral width δλs is kept constant (see Eq. 10), and the definition of equivalent bandwidth eliminates the dependence of S* on factors not inherent to the sensor system (integration time and light source spectral width), which is verified in our simulations as we will show in the following sections. In contrast, transmitted intensity as a function of wavelength can be measured by a linear array of photodetectors simultaneously provided that the transmitted light is spatially separated via a dispersive element (spatial or angular interrogation), and in this case N = 1. Most resonator sensors adopt the wavelength interrogation method, since few dispersive elements are able to attain the wavelength resolution required to characterize a high-Q resonant peak. Finally, we exclude intensity interrogation scheme in our discussion, since it is susceptible to baseline drift
(e.g. due to 1/f noise) and typically has inferior signal-to-noise ratio compared to the other two configurations.
Since the definition of time-normalized sensitivity includes noise contributions from measurement instruments, S* is a performance measure for the entire sensor system comprised of the sensing element (i.e. optical resonator) as well as the peripheral optical and electronic components used for signal read-out and processing, as is shown in Fig. 1. For quantitative evaluation of optical sensors across technology-platforms (e.g. comparing micro-ring resonator sensors with grating sensors or SPR sensors), it is helpful to derive a device performance measure that eliminates the dependence on instrumentation and is only a function of optical resonator parameters. We will establish the connection between device parameters and system performance based on the results of a peak fitting algorithm.
Noise analysis
We categorize the noise sources into two types: intensity noise which affects the transmitted optical signal intensity, and wavelength noise which leads to a spectral shift of both the incident light signal and the resonant wavelength (see Fig. 2). The former category includes photodetector noise, light source intensity fluctuation and possible fiber-to-chip coupling variation, whereas the latter is mainly due to light source wavelength shift (i.e. source wavelength repeatability) and resonant wavelength change of the optical resonator often due to temperature fluctuations. An implicit assumption in the definition of time-normalized sensitivity S* is that the sensor system works in a white-noise limited regime, i.e. the noise of the sensor system has no frequency dependence in the noise bandwidth range of interest. Such a noise characteristics can be described with a constant sensor noise spectral density function (NSD, which can be defined as the Fourier transform of the signal autocorrelation function in analogy to power spectral density
function in statistical signal processing). For a typical sensor system, the noise bandwidth ∆f of transmitted intensity measurement at a single wavelength point usually varies from 100 Hz to 10 kHz depending on the application scenario. Within this bandwidth range the noise spectral density for most of the aforementioned noise sources is approximately constant. In this case, S* can also serve as a general FOM for many classes of optical sensors, including SPR sensors and fiber-optic sensors. Temperature fluctuations may have non-white noise characteristics depending on the thermal mass and temperature stabilization scheme and therefore need to be considered separately.
Simulation results and discussion
According to Eq. (1), S* of a resonator sensor is determined by the minimum wavelength shift ∆λmin that can be resolved by the system. Therefore, we focus on the impact of resonator parameters and instrumentation factors (light source spectral width and noise characteristics) on ∆λmin. Monte-Carlo simulations are performed for cavity Q-factors in the range of 103 to 106, light source spectral width ∆λmin from 0.01 pm to 10 pm and different noise amplitude. Details of the simulation methodology are presented in the Appendix section.
The numerical simulation results are plotted in two design maps in Fig. 3. The resonator sensor wavelength resolution ∆λmin is given at fixed intensity and wavelength noise amplitude of 0.1 dB and 0.1 pm, respectively. Noise-limited resolution at any given noise level can be thereby determined using conclusions (1) and (2) detailed below. The simulation results suggest that it is possible to obtain wavelength resolution much smaller than both the light source line width and resonant peak FWHM using the peak fitting algorithm, provided that wavelength and intensity noises are suppressed.
(1) Intensity noise and wavelength noise are orthogonal in terms of their impact on the sensor wavelength resolution ∆λmin, i.e.
2 min, 2
int min,
min λ ensity λ wavelength
λ = ∆ +∆
∆ (2)
where ∆λmin, intensity and ∆λmin, wavelength denote the wavelength resolution when only intensity or wavelength noise is present, respectively;
(2) ∆λmin is linearly proportional to the noise amplitude for both types of noises;
(3) At a given noise amplitude, ∆λmin scales with the square root of light source spectral width δλs at a given cavity Q for both types of noises, i.e.
angular wavelength N FWHM FWHM s λ λ δλ λ ∆ ∆ ∝ ∝ ∆ min / (3)
where ∆λFWHM is the resonant peak spectral width (FWHM), N stands for the number of discrete spectral data points that comprises a spectral scan across the resonant peak, and λ0 represents the resonant wavelength. Note that the specific form of this expression can be dependent on the interrogation scheme employed. Empirically this proportionality relationship stands for δλs values up to about 20% of the resonant peak FWHM, beyond which the peak fitting algorithm becomes inapplicable since there are too few data points available.
(4) At a given noise amplitude, ∆λmin, intensity is inversely proportional to the square root of cavity Q, i.e. 0 int min, 1 λ λ λ FWHM ensity Q ∆ = ∝ ∆ (4)
(5) At a given noise amplitude, ∆λmin, wavelength is proportional to the square root of cavity Q, i.e. FWHM wavelength Q λ λ λ ∆ = ∝ ∆ 0 min, (5)
Figures 4, 5 and 6 show some examples of simulation results indicating the functional dependence of wavelength resolution ∆λmin on noise amplitude, light source spectral width δλs and cavity Q, respectively. Conclusion (1) basically states that intensity noise and wavelength noise are independent and can be separately considered in sensor performance evaluation, and conclusion (2) establishes the linear proportionality between noise amplitude and sensor resolution. Therefore, ∆λmin and S* of a given resonator sensor device at any given noise levels can be completely defined if the corresponding values at one arbitrary intensity noise level and at one arbitrary wavelength noise level is determined.
Conclusions (3) can be intuitively understood by noticing that fixed noise amplitude implies the same single-measurement noise bandwidth ∆f for transmission measurement at each individual wavelength point comprising a wavelength-sweeping scan. For a resonator with a given cavity Q-factor, smaller light source spectral width δλs means more data points are involved comprising a spectral scan across the resonant peak, giving a more accurate description of the resonant peak. In a wavelength-interrogation scheme, S* becomes independent of the source spectral width δλs, since the improved wavelength resolution is cancelled out by decrease of equivalent noise bandwidth
N f
∆
. However, in a spatial or angular interrogation configuration, the equivalent noise bandwidth remains constant (N =1) and narrow line width sources do lead to S* improvement.
Conclusion (4) phrases that time-normalized sensitivity S* is linearly proportional to cavity Q-factor when a wavelength interrogation scheme is used, since N is proportional to the resonant peak FWHM. Intuitively high Q-factor leads to sharp resonant peaks and hence improved wavelength resolution.
Intuitively, wavelength noise translates to intensity noise with increased amplitude in a sharp (high-Q) resonant peak due to the large curve slope involved. Such an intuitive notion is reflected in conclusion (5), which states that high-Q resonator sensors are more susceptible to wavelength noise interference. Moreover, according conclusion (5), S* of a wavelength-interrogation sensor system becomes independent of cavity Q-factor under wavelength noise-limited operation, which is often associated with scenarios where temperature fluctuation becomes significant. As we will see in the next section, such a limitation eventually imposes a limit to performance improvement by increasing cavity Q-factor.
Resonator device figure of merit
Based on the simulation results, a wavelength-interrogated optical resonator sensor working in the intensity-noise-limited regime can be characterized by a device figure of merit solely dependent on resonator parameters:
* 2 0 S n Q FOM iv g iv = Γ ∝ Γ = α π λ wavelength interrogation (6)
where α is the equivalent linear waveguide loss in the cavity and the second equality holds for critically coupled resonators.
Similarly, an intensity-noise-limited device FOM can be derived when an angular interrogation configuration is used (in this case N = 1):
* 0 S n Q FOM g iv ∝ Γ = λ angular interrogation (6)
Parameter dependence of S*
Table 1 summarizes the functional dependence of S* on the device parameters in different noise-limited regimes and interrogation schemes, derived from the simulation results presented in the previous section.
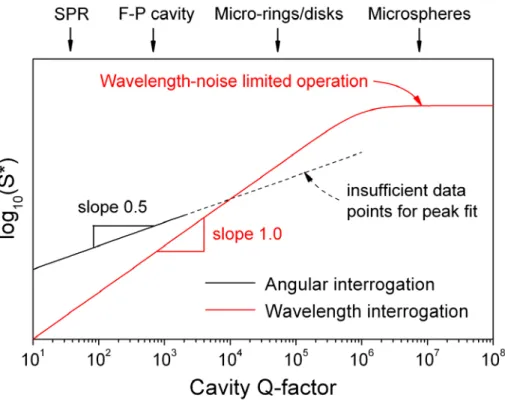
Table 1 shows that cavity Q-factor is a key parameter determining the sensitivity S* of resonator sensors. Figure 7 gives an example that illustrates the complex dependence of the logarithm of time-normalized sensitivity S* on cavity Q-factor in different regimes. Notably, angular interrogation provides improved S* over wavelength interrogation for low-Q resonator sensors (Q < 103) whereas wavelength interrogation becomes the preferred configuration for resonator sensors with higher Q-factors (Q > 104) due to the limited angular dispersion capability. Such an observation is consistent with the fact that most commercial SPR sensor systems adopt the angular interrogation scheme. In addition, S* of high-Q resonator sensors is largely bounded by wavelength noise, and a moderately high Q-factor (~ 106) is sufficient to deliver wavelength-noise-limited operation (in analogy to background limited performance of infrared detectors).
Thermally-induced index fluctuation: origin
In the previous sections, we have focused our discussions on white noises which well described a lot of noise sources such as photodetector noise and light source intensity fluctuation in the bandwidth range of interest. Temperature fluctuation is another important noise source for resonator sensors since it leads to random variation of resonant wavelength. According to conclusion (5), wavelength noise due to temperature fluctuations cannot be alleviated by
improving the cavity Q-factor; therefore effectively temperature fluctuations pose a limit to the sensitivity of sensors using high-Q optical resonators. Further, in certain sensor system configurations and application scenarios, a sensor device with finite thermal mass may have a characteristic time constant comparable to the measurement time, and in this case the frequency dependence of noise spectral density becomes significant and needs to be taken into account. The performance of a non-white-noise-limited sensor cannot be appropriately quantified by S* and a rigorous description involves specifying the noise spectral density of thermal noise and the measurement noise bandwidth. However, a simple estimation can be made based on the thermo-optic properties of the sensor device and the system temperature stabilization/compensation capability using the following formula:
system device T T dT dn n = ⋅ ⋅∆ ∆ 2 ( ) (8)
where ∆nT gives the refractive index change resolution limited by temperature noise, device
dTdn )
(
is the thermo-optic coefficient of the optical resonator and ∆Tsystem denotes the average temperature fluctuation with the given temperature stabilization/compensation scheme.
Thermally-induced index fluctuation: mitigation
Two approaches can be pursued to reduce ∆nT: using a reference channel in close proximity to the sensor device to provide compensation for the temperature variations, which effectively is equivalent to the reduction of ∆Tsystem. However, this technique requires that the reference channel and the actual sensor device have identical thermo-optic characteristics and yet distinctive response to analyte solution, which is difficult to realize. Therefore this scheme
decrease the resonator thermo-optic coefficient device
dTdn )
( , which favors dielectric materials with low thermo-optic coefficients over semiconductors as the resonator material. The device TO coefficient for a resonator sitting on a substrate and immersed in water solution is given by the summation of contributions from the resonator itself, the substrate and the solution in the interrogation volume: clad clad substrate substrate core core device dT dn dT dn dT dn dT dn dT dn ) ( ) ( ) ( ) ( ) ( =
∑
Γ⋅ =Γ +Γ +Γ (9)where Γ is the optical confinement factor. In addition, we notice that water has a negative thermo-optic coefficient of -10-4 K-1 [16], whereas most dielectric materials have positive thermo-optic coefficients in the range of 10-6 to 10-4 K-1. Such a combination of TO coefficients with opposite signs allows temperature-insensitive (athermal) designs for sensors working in an aqueous environment, essentially canceling out the material TO effect. According to Eq. (9), dielectric materials with a moderate positive TO coefficient (in the order of 10-5 K-1) is particularly suitable for minimizing the TO coefficient of sensor devices operating in water, while maintaining high optical confinement in the interrogation volume and hence high RI sensitivity without inducing excess radiative loss. It has been experimentally established that athermal designs can decrease the temperature sensitivity of silica waveguide devices up to almost two orders of magnitude compared to devices without such designs [17].
Application to S* optimization
As an example, let’s consider a sensor system comprising of an optical resonator with a moderate cavity Q-factor of 105. When a laser with a spectral line width of 0.1 pm (corresponding to ~ 10 MHz at 1550 nm wavelength, which can be obtained in several types of single-frequency
semiconductor lasers such as distributed feedback lasers) is used for wavelength interrogation, Fig. 3a predicts a resonant wavelength resolution of 0.01 pm when the sensor is working in the intensity-noise-limited regime with an intensity noise amplitude of 0.1 dB, equivalent to a signal-to-noise ratio of 16.3 dB. Such an SNR is readily achievable in photonic systems (good photonic link systems can achieve SNR well above 30 dB even at megahertz operation bandwidth [18]). Similarly, Fig. 3b points to a wavelength-noise-limited resonant wavelength resolution of 0.01 pm given a wavelength noise amplitude of 0.1 pm. Consider a dielectric material with a TO coefficient of 10-5 K-1 (similar to that of silica), a resonator sensor can possibly reduce the device TO coefficient to 10-6 K-1 by incorporating temperature-insensitive designs. Therefore, if the sensor was to operate in the wavelength-noise-limited regime, it is necessary to stabilize/compensate temperature fluctuations down to < 0.05 K. In resonators with even higher Q-factors (optical resonators with Q-factors exceeding 108 have been demonstrated [19, 20]), temperature control and/or compensation are critical issues that need to be addressed for high-Q optical resonator sensors before their intensity-noise-limited detection capability can be achieved.
Take an RI sensitivity of 200 nm/RIU [21], 0.1 pm wavelength resolution points to a refractive index LOD of 5 × 10⁻⁸ RIU and a time-normalized sensitivity S* = 2 × 10⁸ Hz1/2/RIU (assuming an equivalent measurement bandwidth
N f
∆
= 100 Hz, a typical value used in our sensor tests), representing at least one to two orders of magnitude performance improvement over SPR sensors [13]. Such high sensitivity is directly attributed to the narrow spectral width of resonant peaks in a high-Q optical resonator (in contrast to the broad resonant band stretching tenths of nanometers wavelength in SPR sensors) and the resulting fine wavelength resolution.
In biological applications, it is often convenient to convert the bulk RI LOD and S* to observables such as molecular area density, molecular mass LOD or solution concentration [22].
If we use human serum albumin (HSA, molecular weight ~ 66,000) as a model molecule and a planar glass resonator [21] as the sensing device, 0.1 pm wavelength resolution leads to a molecular area density of approximately 1 pg/cm2. Assume a microdisk resonator with a radius of 20 µm, this corresponds to a molecular mass LOD of ~ 13 attograms (~ 120 HSA molecules) [23]. Further LOD improvement is possible by reducing system temperature fluctuations and instrument noise figures.
Experiment and Discussion
Racetrack, micro-ring, and microdisk optical resonators in Ge17Sb12S71 chalcogenide glass with different cavity Q values are used to verify the wavelength resolution predictions shown in Fig. 3. Fabrication process of the resonator devices has been described in detail elsewhere [21, 24, 25]. The transmission spectra of the fabricated devices are measured on a Newport AutoAlign workstation in combination with a LUNA tunable laser (optical vector analyzer, LUNA Technologies, Inc.). According to the instrument specification, the laser has wavelength repeatability (i.e. wavelength noise amplitude) of 0.1 pm, and the wavelength step size we use in the measurement (i.e. light source spectral width δλs) is ~ 2.6 pm. Lens-tip fibers are used to couple light from the laser into and out of the devices, and reproducible coupling is achieved via an automatic alignment system with a spatial resolution of 50 nm. The sample is mounted on a thermostat stage and kept at 25 ˚C for all measurements. Short-term temperature fluctuation of the thermostat stage is estimated to be < 0.03 ˚C, corresponding to a temperature-fluctuation-limited RI LOD of ~ 10-7 RIU, which is an order of magnitude smaller than intensity-noise-limited RI LOD and is thus not taken into account in the analysis. The transmission spectra through a resonator are measured multiple times, and Lorentzian peak fit is applied to each measured spectrum to derive the resonant wavelength. The experimentally measured resonant
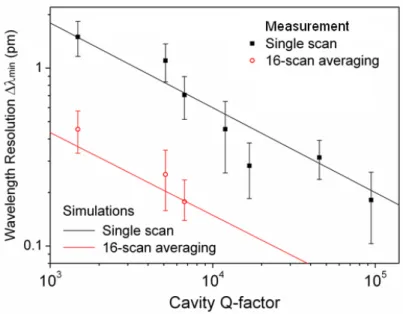
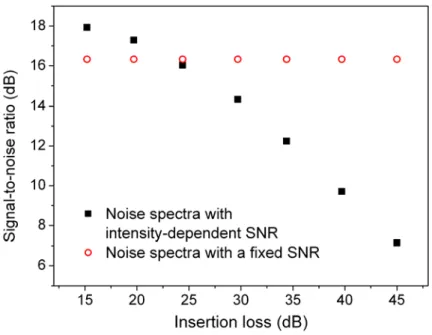
wavelength resolution ∆λmin is defined as the statistical standard deviation of the resonant wavelength values from each peak fit, and is compared with simulation results taking into account the actual noise characteristics of the measurement instrumentation. Since the amplitude of intensity noise is dependent on the transmitted optical signal intensity in the measurement, experimentally measured noise amplitudes in a single scan and after multiple wavelength-sweeping scan averaging are used in the simulations for direct comparison with experimental results. Figure 9 shows the noise amplitude as a function of transmitted signal intensity in a single scan (filled squares). Our simulations indicate that the resonant wavelength resolution is primarily limited by intensity noise, and thus is inversely proportional to the cavity Q-factor.
The experimentally measured resonant wavelength resolution ∆λmin obtained from single wavelength-sweeping scans and 16-scan averaging is shown in Fig. 8, along with the simulation results. Good agreement between experiment and the theoretical predictions supports the validity of our simulation methodology, and confirms the inverse proportionality relationship between ∆λmin and cavity Q-factor. The four-fold reduction of ∆λmin after 16-scan averaging as is verified by our measurement indicates that the intensity noise limiting resonant wavelength resolution can be approximated by a white distribution. This result suggests possible further improvement of wavelength resolution and hence refractive index LOD by using increased number of averaging scans before temperature fluctuations become the performance limiting factor.
Summary and Conclusion
In this paper, we propose a new refractometry sensor system figure of merit: time-normalized sensitivity S*. Compared to refractive index limit of detection ∆nmin, time-normalized sensitivity S* eliminates the dependence on noise bandwidth, a factor not inherent to a sensor system.
Therefore, S* is a more appropriate performance measure when comparing different optical sensor technologies.
Based on Monte-Carlo simulations, we show that there are two distinctive operation regimes for optical resonator sensors: intensity-noise-limited operation and wavelength-noise-limited operation. In addition, according to the device FOM’s Eq. (6) and Eq. (7), which comprising solely of resonator device parameters, cavity Q-factor is the key design variable for improving S* (Fig. 7). Our analysis suggests that resonators with a moderately high Q-factor of ~ 105 are capable of delivering the desirable wavelength-noise-limited performance (in analogous to background limited operation of photodetectors). We further propose to incorporate temperature-insensitive designs to reduce wavelength noise due to temperature fluctuations. We show through an example that a refractive index LOD of 5 × 10⁻⁸ RIU and a time-normalized sensitivity S* = 2 × 10⁸ Hz1/2/RIU is well within reach of current resonator sensors. Such sensitivity already represents one to two orders of magnitude improvement over SPR sensors, which is attributed to the narrow spectral width of resonant peaks in dielectric resonators and the resulting fine spectral resolution.
Lastly, we perform experiments to verify the theoretical predictions of resonant wavelength resolution ∆λmin. Good agreement between experiment and simulation is observed, which confirms the validity of our simulation approach and theoretical framework.
Appendix: simulation methodology
The main purpose of the simulations is to make quantitative sensor system performance predictions based on given optical resonator device parameters and instrumentation noise characteristics, and thereby bridge the gap between device parameters and system performance.
The sensor device under investigation is comprised of a traveling wave resonator and a coupling bus waveguide (Fig. 1). Transmission spectra of the resonator are monitored in situ, and the resonant peak wavelength is tracked to detect the presence of molecules near sensor surface. It should be noted that conclusions derived based on travelling wave resonators can be directly applied to other resonator-based sensors, including standing wave resonators (e.g. 2-d photonic crystal cavities) and SPR sensors, provided that appropriate forms of peak fitting functions are used. In the simulation, firstly transmission spectra through a resonator are calculated using the generalized coupling matrix method [26]. Our simulation and experimental results indicate a weak dependence of sensor detection limit on the resonant peak extinction ratio, and therefore a fixed extinction ratio of 15 dB is used in the simulations for consistency.
In the absence of noise, resonant peaks on the transmission spectra can be described by a Lorentzian peak function to the first-order approximation with a well-defined resonant wavelength. Considering the finite spectral width of light source used for the measurement, the measured spectra actually consist of discrete data points. Such a discretized measurement scheme poses a constraint on sensor performance improvement through Q enhancement, since the resolution can become limited by the finite spectral width of light source. The spacing between these data points will be henceforce denoted as δλs, the spectral width of light source. If a spectrophotometer is used for the measurement, δλs corresponds to the minimum resolvable wavelength often determined by the monochromator. If a tunable laser is employed, δλs is defined as the minimum step size when the laser is performing a wavelength-sweeping scan. Therefore, the transmission spectra generated by the coupling matrix method is discretized into points evenly spaced with a spacing of δλs.
In reality, it is technically challenging to fabricate resonators with an exact resonant peak wavelength; thus the position of the data points relative to that of the resonant peak is randomized for each iteration in the Monte-Carlo simulation to account for fabrication variations. Randomly generated Gaussian-type intensity and wavelength noises are then superimposed onto the spectral data points. As an example, Figure 9 shows the intensity noise amplitude as a function of transmitted signal intensity with a fixed SNR of 16.3 dB (open circles) in the whole transmitted intensity range. Finally a Lorentizian peak fitting of the data points (with noise) is performed to extract the “measured” resonant wavelength. The curve fitting is carried out in a range approximately corresponding to the FWHM of the resonant peak, ∆λFWHM. Therefore, N in Eq. (1) can be approximately expressed as follows in our simulations:
s FWHM
N ≅∆λ /δλ (10)
Figure 2 illustrates an example of fitted Lorentzian peak function. The minimum resolvable wavelength shift ∆λmin is then statistically defined as the ensemble average of deviations of the “measured” values from the actual resonant wavelength over 1,000 Monte-Carlo iterations. Relative numerical error arising from the random nature of the Monte-Monte-Carlo method was estimated to be ~ ± 3%.
For a given device configuration in practical applications, it may be necessary to use a peak function that best describes the resonator spectral response for optimized fitting results. A number of factors can lead to resonant peak shape deviation from the ideal Lorentzian function, for example coupling of counter-propagating waves results in peak broadening and even splitting [27], Fano resonance gives sharp, asymmetric resonance behavior [28], whereas cascaded high-order resonators [29] and periodically coupled resonators [30] exhibit flattened band-pass
spectral characteristics. Further, Lorentzian function only approximates to the first order the resonant line shape given by generalized coupling matrix approach, and the deviation becomes more pronounced when the cavity Q-factor is high.
In this paper all simulations are situated at a resonant wavelength λ0 = 1550 nm for simplicity and ease of comparison with experiments, although the conclusions can be easily generalized to sensor operating at other wavelengths (e.g. at water transparency window 1.06 µm for sensors operating in an aqueous environment).
Acknowledgment
Funding support is provided by the Department Of Energy under award number DE-SC52-06NA27341. The authors would like to thank Dr. Katheleen Richardson, Dr. Laeticia Petit and Mr. Nathen Carlie in Clemson University for supplying samples of bulk Ge-Sb-S glasses.
Disclaimer
This paper was prepared as an account of work supported by an agency of the US Government. Neither the US Government nor any agency thereof, nor any of their employees, makes any warranty or assumes any legal liability or responsibility for the accuracy, completeness or usefulness of any information, apparatus or process disclosed, or represents that its use would not infringe privately owned rights. Reference herein to any specific commercial product, process, or service by trade name, trademark, manufacturer, or otherwise does not necessarily constitute or imply its endorsement or favoring by the US Government. The opinions of authors expressed herein do not necessarily reflect those of the US Government or any agency thereof.
1. F. Vollmer, D. Braun, A. Libchaber, M. Khoshsima, I. Teraoka, and S. Arnold, “Protein detection by optical shift of a resonant microcavity,” Appl. Phys. Lett. 80, 4057-4059 (2002). 2. C. Chao and L. Guo, “Biochemical sensors based on polymer microrings with sharp
asymmetrical resonance,” Appl. Phys. Lett. 83, 1527-1529 (2003).
3. K. De Vos, I. Bartolozzi, E. Schacht, P. Bienstman, and R. Baets, “Silicon-on-Insulator microring resonator for sensitive and label-free biosensing,” Opt. Express 15, 7610-7615 (2007).
4. A. Yalcin, K. Popat, J. Aldridge, T. Desai, J. Hryniewicz, N. Chbouki, B. Little, V. King, V. Van, S. Chu, D. Gill, M. Anthes-Washburn, M. Unlu, B. Goldberg, “Optical Sensing of Biomolecules Using Microring Resonators,” IEEE J. Sel. Top. Quantum Electron. 12, 148-155 (2006).
5. S. Cho, N. Jokerst, “A Polymer Microdisk Photonic Sensor Integrated Onto Silicon,” IEEE Photonics Technol. Lett. 18, 2096-2098 (2006).
6. A. Armani, R. Kulkarni, S. Fraser, R. Flagan, K. Vahala, “Label-Free, Single-Molecule Detection with Optical Microcavities,” Science 317, 783-787 (2007).
7. I. White, H. Oveys, and X. Fan, “Liquid-core optical ring-resonator sensors,” Opt. Lett. 31, 1319-1321 (2006).
8. Y. Sun, S. Shopova, G. Frye-Mason, and X. Fan, “Rapid chemical-vapor sensing using optofluidic ring resonators,” Opt. Lett. 33, 788-790 (2008).
9. E. Chow, A. Grot, L. W. Mirkarimi, M. Sigalas, and G. Girolami, “Ultracompact
biochemical sensor built with two-dimensional photonic crystal microcavity,” Opt. Lett. 29, 1093-1095 (2004).
10. M. Lee and P. Fauchet, “Two-dimensional silicon photonic crystal based biosensing platform for protein detection,” Opt. Express 15, 4530-4535 (2007).
11. R. Boyd, and J. Heebner, “Sensitive Disk Resonator Photonic Biosensor,” Appl. Opt. 40, 5742-5747 (2001).
12. I. White and X. Fan, “On the performance quantification of resonant refractive index sensors,” Opt. Express 16, 1020-1028 (2008).
13. J. Homola, S. Yee, and G. Gauglitz, “Surface plasmon resonance sensors: review,” Sens. Actuators, B 54, 3-15 (1999).
14. C. Barrios, M. Bañuls, V. González-Pedro, K. Gylfason, B. Sánchez, A. Griol, A. Maquieira, H. Sohlström, M. Holgado, and R. Casquel, “Label-free optical biosensing with
slot-waveguides,” Opt. Lett. 33, 708-710 (2008).
15. B. Liedberg, C. Nylander, I. Lundstrom, “Biosensing with surface plasmon resonance -- how it all started,” Biosens. Bioelectron. 10, 1-9 (1995).
16. D. R. Linde, ed., The CRC Handbook of Chemistry and Physics (2005).
17. Y. Kokubun, M. Takizawa, and S. Taga, “Three-dimensional athermal waveguides for temperature independent lightwave devices,” Electron. Lett. 30, 1223-1224 (1994). 18. See for example: T. Clark, M. Currie, and P. Matthews, “Digitally Linearized Wide-Band
Photonic Link,” J. Lightwave Technol. 19, 172-179 (2001). In practical applications, it is necessary to specify the measurement bandwidth at which the SNR is attained to obtain S* value and an accurate description of the sensor system.
19. M. Gorodetsky, A. Savchenkov, and V. Ilchenko, “Ultimate Q of optical microsphere resonators,” Opt. Lett. 21, 453-455 (1996).
20. D. Armani, T. Kippenberg, S. Spillane and K. Vahala, “Ultra-high-Q toroid microcavity on a chip,” Nature 421, 925-929 (2003).
21. J. Hu, N. Carlie, N. Feng, L. Petit, A. Agarwal, K. Richardson, and L. Kimerling, “Planar waveguide-coupled, high-index-contrast, high-Q resonators in chalcogenide glass for sensing,” Opt. Lett. 33, 2500-2502 (2008).
22. H. Zhu, I. White, J. Suter, P. Dale and X. Fan, “Analysis of biomolecule detection with optofluidic ring resonator sensors,” Opt. Express 15, 9139-9146 (2007).
23. Understandably, sensors with small sensing area are advantageous in achieving a low molecular mass LOD. Nevertheless, small sensing area (e.g. < 10 µm2) often leads to
inefficient molecular capturing and large statistical variations of measurement results, design trade-offs that need to be taken into account.
24. J. Hu, V. Tarasov, N. Carlie, N. Feng, L. Petit, A. Agarwal, K. Richardson, and L. Kimerling, “Si-CMOS-compatible lift-off fabrication of low-loss planar chalcogenide waveguides,” Opt. Express 15, 11798-11807, (2007).
25. J. Hu, N. Carlie, L. Petit, A. Agarwal, K. Richardson, and L. Kimerling, “Demonstration of chalcogenide glass racetrack microresonators,” Opt. Lett. 33, 761-763 (2008).
26. A. Yariv, “Universal relations for coupling of optical power between microresonators and dielectric waveguides,” Electron. Lett 36, 321-322 (2000).
27. B. Little, J. Laine, and S. Chu, “Surface-roughness-induced contradirectional coupling in ring and disk resonators,” Opt. Lett. 22, 4-6 (1997).
28. U. Fano, “Effects of Configuration Interaction on Intensities and Phase Shifts,” Phys. Rev. 124, 1866-1878 (1961).
29. R. Orta, P. Savi, R. Tascone, and D. Trinchero, “Synthesis of multiple-ring-resonator filters for optical systems,” IEEE Photon. Technol. Lett. 7, 1447-1449 (1995).
30. B. Little, S. Chu, J. Hryniewicz, and P. Absil, “Filter synthesis for periodically coupled microring resonators,” Opt. Lett. 25, 344-346 (2000).
Table 1 Functional dependence of time-normalized sensitivity on resonator sensor device parameters derived from Monte-Carlo numerical simulations
Wavelength interrogation Angular interrogation
Intensity noise limited Wavelength noise limited Intensity noise limited Wavelength noise limited Cavity Q-factor S*∝Q → S*∝ Q
Resonance extinction ratio dependence Weak dependence Weak dependence Weak Light source spectral width
δλs → → S*∝1/ δλs
Equivalent measurement bandwidth (integration
time)
→ → →
1. → denotes no dependence of S* on the parameter;
2. Performance of angular-interrogated sensors typically are not limited by wavelength noise due to their large resonant peak width;
Figure Captions
Fig. 1. (Color online) Schematic illustration of an optical resonator sensor system discussed in this paper, comprised of a light source, a coupled optical resonator and read-out components; note that angular and wavelength interrogation schemes employ slightly different configurations; the top inset illustrates the operation principle of refractive index sensors (refractometry).
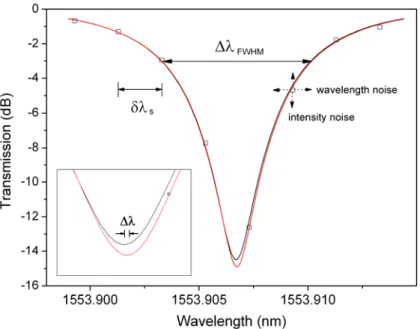
Fig. 2. (Color online) Exemplary transmission spectra of a resonator sensor: The black curve is the analytically calculated spectra obtained using the coupling matrix method. The open squares are the spectral data points obtained, after super-imposing Gaussian-type intensity and wavelength noises using a Monte-Carlo method in the analytical calculation. The open square data points are spaced by a finite spectral width δλs. Finally, the red curve is the Lorentzian peak fit based on the data points. The inset shows the analytical and the fitted spectra near their minima: the ensemble average of ∆λ was taken as the minimum resolvable wavelength (wavelength resolution) ∆λmin of a sensor.
Fig. 3. (Color online) Resonant wavelength resolution ∆λmin of optical resonator sensors at (a) intensity noise amplitude of 0.1 dB and (b) wavelength noise amplitude of 0.1 pm. The wavelength resolution values can be read out from the iso-resolution curves (unit: pm).
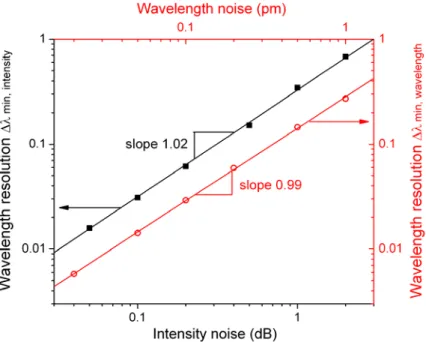
Fig. 4. (Color online) Simulated resonator sensor wavelength resolution ∆λmin at different noise levels, showing linear dependence on noise amplitude for both wavelength and intensity noise: the resonator has a cavity Q = 105, the light source spectral width δλs = 1 pm and both types of noises are of white Gaussian nature.
Fig. 5. (Color online) Simulated resonant wavelength resolution (∆λmin) in a Q = 10,000 resonator, which is proportional to the square root of light source spectral width δλs: the black dots correspond to ∆λmin, intensity at the intensity noise amplitude of 0.1 dB and the red dots correspond to ∆λmin, wavelength at the wavelength noise amplitude of 0.1 pm. Linear fittings are represented by the solid lines.
Fig. 6. (Color online) Simulated resonant wavelength resolution (∆λmin) of resonator sensors with different cavity Q-factors at a given (a) intensity noise amplitude of 0.1 dB and (b) wavelength noise amplitude of 0.1 pm. The dots are simulated ∆λmin results and the lines are corresponding fitted curves. ∆λmin is inversely proportional to the square root of resonator cavity Q-factor when the sensor performance is mainly limited by intensity noise; in contrast, ∆λmin becomes directly proportional to the square root of resonator cavity Q-factor when wavelength noise dominates.
Fig. 7. (Color online) Logarithm of time-normalized sensitivity S* plotted as a function of cavity Q-factor, assuming: a constant RI sensitivity independent of Q-factor, angular dispersion of dispersive element 0.002 rad/nm, distance between linear photodetector pixel array and the dispersive element 10 cm, pixel linear size 5 µm, device TO coefficient 10-6 K-1 and operating temperature fluctuation < 0.01 K. The typical Q-factor values of four different types of resonant structures are indicated by arrows. A moderately high Q-factor (~ 106) is sufficient to deliver the desirable wavelength-noise-limited operation (in analogy to background limited performance of infrared detectors).
Fig. 8. (Color online) Resonant wavelength resolution ∆λmin in resonators with different cavity Q-factors: the filled squares are experimentally measured values fitted using transmission spectra from single wavelength-sweeping scans, the open circles are measured values after 16-scan averaging, and the lines are simulation results using the Lorentzian fit algorithm taking into account the actual noise characteristics of the measurement instrumentation.
Fig. 9. (Color online) Two types of intensity noise spectra used in the simulations: the open circles represent noise with a fixed signal-to-noise ratio of 16.3 dB (corresponding to an average noise amplitude of 0.1 dB), and the filled squares are intensity-dependent single-scan noise spectra of a Newport AutoAlign workstation in combination with an optical vector analyzer (LUNA Technologies, Inc.).
Fig. 1. (Color online) Schematic illustration of an optical resonator sensor system discussed in this paper, comprised of a light source, a coupled optical resonator and read-out components; note that angular and wavelength interrogation schemes employ slightly different configurations;
Fig. 2. (Color online) Exemplary transmission spectra of a resonator sensor: The black curve is the analytically calculated spectra obtained using the coupling matrix method. The open squares
are the spectral data points obtained, after super-imposing Gaussian-type intensity and wavelength noises using a Monte-Carlo method in the analytical calculation. The open square data points are spaced by a finite spectral width δλs. Finally, the red curve is the Lorentzian peak
fit based on the data points. The inset shows the analytical and the fitted spectra near their minima: the ensemble average of ∆λ was taken as the minimum resolvable wavelength
(a) (b)
Fig. 3. (Color online) Resonant wavelength resolution ∆λmin of optical resonator sensors at (a) intensity noise amplitude of 0.1 dB and (b) wavelength noise amplitude of 0.1 pm. The wavelength resolution values can be read out from the iso-resolution curves (unit: pm).
Fig. 4. (Color online) Simulated resonator sensor wavelength resolution ∆λmin at different noise levels, showing linear dependence on noise amplitude for both wavelength and intensity noise: the resonator has a cavity Q = 105, the light source spectral width δλs = 1 pm and both types of
Fig. 5. (Color online) Simulated resonant wavelength resolution (∆λmin) in a Q = 10,000 resonator, which is proportional to the square root of light source spectral width δλs: the black
dots correspond to ∆λmin, intensity at the intensity noise amplitude of 0.1 dB and the red dots correspond to ∆λmin, wavelength at the wavelength noise amplitude of 0.1 pm. Linear fittings are
(a) (b)
Fig. 6. (Color online) Simulated resonant wavelength resolution (∆λmin) of resonator sensors with different cavity Q-factors at a given (a) intensity noise amplitude of 0.1 dB and (b) wavelength noise amplitude of 0.1 pm. The dots are simulated ∆λmin results and the lines are corresponding fitted curves. ∆λmin is inversely proportional to the square root of resonator cavity
Q-factor when the sensor performance is mainly limited by intensity noise; in contrast, ∆λmin becomes directly proportional to the square root of resonator cavity Q-factor when wavelength
Fig. 7. (Color online) Logarithm of time-normalized sensitivity S* plotted as a function of cavity Q-factor, assuming: a constant RI sensitivity independent of Q-factor, angular dispersion of
dispersive element 0.002 rad/nm, distance between linear photodetector pixel array and the dispersive element 10 cm, pixel linear size 5 µm, device TO coefficient 10-6 K-1 and operating temperature fluctuation < 0.01 K. The typical Q-factor values of four different types of resonant structures are indicated by arrows. A moderately high Q-factor (~ 106) is sufficient to deliver the desirable wavelength-noise-limited operation (in analogy to background limited performance of
Fig. 8. (Color online) Resonant wavelength resolution ∆λmin in resonators with different cavity Q-factors: the filled squares are experimentally measured values fitted using transmission spectra
from single wavelength-sweeping scans, the open circles are measured values after 16-scan averaging, and the lines are simulation results using the Lorentzian fit algorithm taking into
Fig. 9. (Color online) Two types of intensity noise spectra used in the simulations: the open circles represent noise with a fixed signal-to-noise ratio of 16.3 dB (corresponding to an average
noise amplitude of 0.1 dB), and the filled squares are intensity-dependent single-scan noise spectra of a Newport AutoAlign workstation in combination with an optical vector analyzer