HAL Id: hal-03003979
https://hal.umontpellier.fr/hal-03003979
Submitted on 1 Jun 2021
HAL is a multi-disciplinary open access
archive for the deposit and dissemination of
sci-entific research documents, whether they are
pub-lished or not. The documents may come from
teaching and research institutions in France or
abroad, or from public or private research centers.
L’archive ouverte pluridisciplinaire HAL, est
destinée au dépôt et à la diffusion de documents
scientifiques de niveau recherche, publiés ou non,
émanant des établissements d’enseignement et de
recherche français ou étrangers, des laboratoires
publics ou privés.
Copyright
Ca 2+ -activated cleavage of ezrin visualised dynamically
in living myeloid cells during cell surface area expansion
Rhiannon Roberts, Marianne Martin, Sabrina Marion, Geetha Elumalai,
Kimberly Lewis, Maurice Hallett
To cite this version:
Rhiannon Roberts, Marianne Martin, Sabrina Marion, Geetha Elumalai, Kimberly Lewis, et al..
Ca 2+ -activated cleavage of ezrin visualised dynamically in living myeloid cells during cell
sur-face area expansion. Journal of Cell Science, Company of Biologists, 2020, 133 (5), pp.jcs236968.
�10.1242/jcs.236968�. �hal-03003979�
RESEARCH ARTICLE SPECIAL ISSUE: CELL BIOLOGY OF THE IMMUNE SYSTEM
Ca
2+
-activated cleavage of ezrin visualised dynamically in living
myeloid cells during cell surface area expansion
Rhiannon E. Roberts1, Marianne Martin2, Sabrina Marion3, Geetha L. Elumalai1, Kimberly Lewis1and
Maurice B. Hallett1,*
ABSTRACT
The intracellular events underlying phagocytosis, a crucial event for innate immunity, are still unresolved. In order to test whether the reservoir of membrane required for the formation of the phagocytic pseudopodia is maintained by cortical ezrin, and that its cleavage is a key step in releasing this membrane, the cleavage of cortical ezrin was monitored within living phagocytes (the phagocytically competent cell line RAW264.7) through expressing two ezrin constructs with fluorescent protein tags located either inside the FERM or at the actin-binding domains. When ezrin is cleaved in the linker region by the Ca2+-activated protease calpain, separation of the two fluorophores would result. Experimentally induced Ca2+influx triggered cleavage of peripherally located ezrin, which was temporally associated with cell expansion. Ezrin cleavage was also observed in the phagocytic pseudopodia during phagocytosis. Thus, our data demonstrates that peripheral ezrin is cleaved during Ca2+ -influx-induced membrane expansion and locally within the extending pseudopodia during phagocytosis. This is consistent with a role for intact ezrin in maintaining folded membrane on the cell surface, which then becomes available for cell spreading and phagocytosis.
KEY WORDS: Ezrin, Phagocytosis, Cell spreading, Myeloid cell, Neutrophil, Ca2+signalling
INTRODUCTION
Two important cell biological events underpin the efficacy of the immune system, namely (1) spreading of circulating immune cells onto the endothelium prior to their emigration into the extravascular space and (2) phagocytosis of infecting micro-organisms. Both events involve dramatic and rapid changes in the cell shape and results in a large apparent increase in the cell surface area (Hallett and Dewitt, 2007; Dewitt and Hallett, 2007). It has been known for a number of years that increases in cytosolic free Ca2+, which accompanies these events, play a role in these processes (Kruskal et al., 1986; Kruskal and Maxfield, 1987; Dewitt and Hallett, 2002), as prevention of Ca2+ influx inhibits phagocytosis, and photolytic uncaging of cytosolic Ca2+or IP
3triggers cell spreading (Pettit and Hallett, 1998; Dewitt et al., 2013). There is increasing evidence that, in myeloid cells, the apparent membrane expansion that permits cell
spreading and phagocytosis is achieved by unfurling of cell surface wrinkles and microridges that act as the membrane reservoir that provides the additional available cell surface area for phagocytosis and cell spreading (Herant et al., 2005; Dewitt et al., 2013; Al-Jumaa et al., 2017). A fuller understanding of these important processes, therefore, requires the establishment of the molecular events that are involved in maintaining and releasing these cell surface structures.
Ezrin is an important cross-linking protein involved in the maintenance of the architecture of plasma membrane structures in a number of cell types (Bretscher, 1983; Gould et al., 1989). It is localised to microvilli (Bretscher, 1983; Yonemura et al., 1999), and knockout experiments show that ezrin is functionally required for the assembly and maintenance of these cell surface structures (Saotome et al., 2004). Ezrin has two functional domains, denoted N-ERMAD and C-ERMAD, which bind to the plasma membrane and cortical F-actin respectively (Algrain et al., 1993; Fehon et al., 2010), thus holding the phospholipid cell boundary to the underlying cortical actin network. In neutrophils, it has been proposed that ezrin plays a role in regulating dynamic cell surface structures, such as microridges or wrinkles, which are released when there is a requirement to produce additional cell surface area (Hallett and Dewitt, 2007; Dewitt and Hallett, 2007; Roberts and Hallett, 2019). Ezrin may thus maintain the neutrophil plasma membrane in its wrinkled topography. It has been proposed that proteolytic cleavage of ezrin is mediated by the Ca2+-activated protease µ-calpain (Shcherbina et al., 1999) causing disruption of the ezrin tethering and so releasing a membrane reservoir. This would allow neutrophils to rapidly alter their morphology during processes that require a large apparent expansion in plasma membrane area, such as cell spreading and phagocytosis (Hallett and Dewitt, 2007; Dewitt and Hallett, 2007; Roberts and Hallett, 2019). However, it has not been previously possible to visualise ezrin cleavage in living cells, and most of the evidence for the idea of its cleavage relies on western blotting of proteins extracted from cells (e.g. Shcherbina et al., 1999). While this approach has discovered important data, including that ezrin is a substrate of the µ-calpain in neutrophils (Shcherbina et al., 1999), it is, of course, not possible to provide temporal data from individual cells or to correlate biochemical changes within the living cell with its morphological changes.
In this paper, we report the use of fluorescently tagged ezrin constructs to monitor ezrin cleavage within living cells during membrane expansion and phagocytosis. Cleavage of ezrin was monitored by comparing the separation of the subcellular locations of fluorescent protein tags (GFP and mCherry) attached to ezrin either side of the calpain-cleavage site (see Fig 1A). The fluorescent protein tags were conjugated to ezrin either at the C-terminal ERMAD, or at an intra-domain position in the N-terminal ERMAD. In these positions, the fluorescent tags do not interfere with the binding to the plasma membrane (Dard et al., 2001; Coscoy et al., 2002; Marion et al., 2011), and have similar membrane affinity and
Received 24 July 2019; Accepted 26 December 2019
1Neutrophil Signalling Group, Cardiff University Medical School, Cardiff, CF14 4XN, UK.2University of Montpellier, Laboratory of Pathogen Host Interactions, CNRS, UMR 5235, 34059 Montpellier CEDEX 05, France.3University of Lille, CNRS UMR 8204, Institut Pasteur Lille, Centre for Infection and Immunity Lille, 59016 Lille CEDEX, France.
*Author for correspondence (hallettmb@cf.ac.uk)
R.E.R., 0000-0003-0978-2419; M.M., 8932-3129; S.M., 0000-0001-7824-955X; M.B.H., 0000-0001-8197-834X
© 2020. Published by The Company of Biologists Ltd|Journal of Cell Science (2020) 133, jcs236968. doi:10.1242/jcs.236968
Journal
of
Cell
diffusion ratesin vivo (Coscoy et al., 2002). The differential release of the fluorophores either side of the linker region would thus indicate ezrin cleavage (Fig. 1B). The dynamic changes in the re-distribution of the ezrin constructs were monitored during Ca2+influx and phagocytosis and showed, for the first time, that ezrin cleavage occurs within live cells and is correlated to cellular morphology changes.
RESULTS
Release of membrane-associated ezrin during Ca2+influx
The translocation of the YFP-tagged C2 domain of PKC-γ (YFP– C2-γ) to the plasma membrane was used as a real time marker of Ca2+influx (Oancea and Meyer, 1998; Teruel and Meyer, 2002) in RAW 264.7 macrophages. Using this output, an experimental strategy for inducing Ca2+influx in RAW 264.7 macrophages was established. Ca2+ influx was induced by the re-introduction of extracellular Ca2+ to cells pre-treated in Ca2+-free medium with ionomycin (to facilitate transmembrane Ca2+ flux and Ca2+store emptying) and thapsigargin (to inhibit SERCa pumps and induce store-operated Ca2+channel opening) (Thastrup et al., 1994). This procedure triggered a rapid translocation of YFP–C2-γ from the cytosol to the cell periphery (Fig. 2A) confirming that Ca2+influx had been evoked. When Ca2+influx was subsequently prevented by
the removal of extracellular Ca2+, the YFP–C2-γ domain was rapidly lost from the plasma membrane, as expected (Fig. 2B). Simultaneous monitoring of the cytosolic free Ca2+concentration showed that there was a lag between the prevention of Ca2+influx and the decrease in global free Ca2+(Fig. 2C), indicating that Ca2+ influx rather than simply cytosolic Ca2+ concentration was being monitored. This approach for elevating cytosolic Ca2+ influx was therefore used to investigate the effects of Ca2+ influx on ezrin subcellular location. Initially, fluorescently tagged ezrin was located at the cell periphery, but was released in an irreversible manner from the cell edge within 30 s of Ca2+influx (Fig. 2D). Although calpain has been shown to cleave ezrinin vitro (Shcherbina et al., 1999), the mechanism for the release of peripheral ezrin during Ca2+influx was previously unresolved and there was no direct evidence for ezrin cleavage. We therefore developed anin vivo strategy using two fluorescent protein tags to monitor ezrin cleavage in real-time.
Fig. 1. Ezrin constructs and their use to monitor proteolytic ezrin cleavage. (A) The location of two fluorescent tags, GFP and mCherry, on either side of the calpain cleavage locus within the linker region of ezrin, which connects the actin-binding domain and the membrane-associated FERM domain. (B) The expected effect in vivo. Initially both ezrin constructs locate at the cell edge. Upon Ca2+influx, calpain is activated and cleaves ezrin,
separating the two fluorescent tags, with the GFP-containing ezrin FERM fragment remaining at the cell periphery and the mCherry fragment freed to diffuse into the cytosol. (C) The logic underlying the in vitro experiment to demonstrate the utility of the‘two fluorophores’ approach. First, immobilised antibody against the FERM domain captures both ezrin constructs, which remain attached when neutrophil extract (as a source of proteases) is added. Finally, Ca2+is added to activate calpain and other Ca2+-dependent proteases
and causes the release of the mCherry-containing fragment of ezrin, but retention of the GFPi-containing ezrin fragment.
Fig. 2. Ca2+influx and loss of C-terminal fluorescent tags ezrin at cell
periphery. (A) A sequence of images of a RAW 264.7 cell expressing YFP–C2-γ pretreated with thapsigargin in the absence of extracellular Ca2+is
shown. Extracellular Ca2+was transiently introduced (Ca2+pulse) as indicated
at time zero. (B) The time course of the intensity (arbitrary units) of YFP–C2-γ within the cytoplasm (cyto) and the plasma membrane (PM) during the Ca2+
pulse induced by 25 µM thapsigargin, 10 µM ionomycin and 13 mM Ca2+.
(C) The time course of the change in distribution of YFP–C2-γ as the ratio of plasma membrane to cytoplasm (PM/Cy) intensities with the accompanying change in cytosolic free Ca2+monitored by Fura Red. (D) A sequence of
images of a RAW 264.7 cell expressing ezrin–Emerald, subjected to a Ca2+
influx pulse. The lower graphs show the time course of the intensity of ezrin-Emerald within the cytoplasm and the plasma membrane during the Ca2+
pulse (left); and the time course of the change in distribution of ezrin–Emerald as the ratio of plasma membrane to cytoplasm intensities (right). The complete data set for the images in D are shown in Movie 1. These examples are typical of at least five similar experiments, and the ezrin–Emerald data is similar to experiments using ezrin–mCherry and ezrin–GFP.
RESEARCH ARTICLE Journal of Cell Science (2020) 133, jcs236968. doi:10.1242/jcs.236968
Journal
of
Cell
Development of real-time monitoring of ezrin cleavage
The principle of the method using two using two fluorescent protein tags relies on monitoring the separation of fluorescent markers located on ezrin either side of the calpain cleavage site. Since ezrin, but not moesin, is a substrate for cleavage by calpain, the calpain cleavage site probably lies in the linker region, which comprises the major difference between these two members of the FERM family (Roberts, 2017). This linker region is located between the actin binding C terminus domain and the phospholipid-binding FERM domain at the N terminus. Our approach using two fluorescent protein tags used constructs fused with different fluorescent proteins that are located either side of the linker region, that is mCherry at the C-terminus (ezrin–mCherry) and GFP within the FERM domain (ezrin–GFPi; herein, GFPi indicates an intramolecular tag) at the N-terminus (Fig. 1C).
In order to establish whether the differential release of fluorophores from ezrin–GFPi and ezrin–mCherry can report proteolytic cleavage, an in vitro method was first used. Both constructs were captured onto a solid phase substrate by use of an immobilised antibody against the FERM domain of ezrin, and subjected to proteolytic cleavage in vitro by the addition of neutrophil cytosolic lysate. When Ca2+was added to activate Ca2+ -activated proteases, the C-terminal mCherry but not the GFPi in the N-terminal FERM domain was released into the aqueous phase, indicating that a separation of the fluorophore by proteolytic cleavage in the linker region had occurred (Fig. 2B). The addition of Ca2+ released 99.2±23% (mean±s.e.m.) of mCherry signal from antibody-captured C-terminal mCherry ezrin but only 12.8±7.7% of GFP from antibody-captured GFPi–ezrin (n=3; P<0.05). Presumably, the release of some GFP from GFPi–ezrin was the result of the non-specificity of cleavage by calpain or other proteases under these conditions. However, the resultant ratio of GFP:mCherry fluorescence signal of the antibody-retained protein was 65-fold higher after protease activation by Ca2+providing an in vitro demonstration of the utility of this approach for monitoring and visualising calpain-mediated ezrin cleavage within living cells.
Separation of ezrin C- and N-terminal fluorescent tagsin vivo during Ca2+influx
Our approach was extended to within living cells by co-transfecting RAW 264.7 cells with ezrin–GFPi and ezrin–mCherry. Cleavage of ezrin in the linker region would result in the spatial separation of the two fluorophores within the cell. This approach was therefore used to establish whether the loss of C-terminally tagged ezrin from the cell periphery during Ca2+influx (Fig. 1B) was the result of cleavage of membrane-associated ezrin. Both ezrin–GFPi and ezrin–mCherry initially locate to the plasma membrane (Fig. 3A). Upon Ca2+influx, there was an immediate release of mCherry signal from the cell periphery and a concomitant increase in the cytosolic mCherry signal (Fig. 3A,B), as was observed with other C-terminal ezrin fluorescent tags, including ezrin–Emerald (Fig. 1B) and ezrin–GFP (Roberts et al., 2018). However, there was no immediate accompanying release of ezrin–GFPi (Fig. 3A,C). Within the same cells, the separation of the C and N terminal fluorescent tags occurred over a period of 10–25 s before both fluorescent tags were released (Fig. 3D). During the initial phase, the ratio of GFP:mCherry at the cell periphery was significantly elevated (Fig. 3E) demonstrating ezrin cleavage in this first phase. There was no change in the GFP: mCherry ratio at the plasma membrane after this time, when both fluors were lost from the cell edge (Fig. 3A–D). It was, however, possible to further dissociate the two phases of ezrin release by reducing the inward Ca2+gradient after thapsigargin-induced Ca2+ channel opening (Fig. 4). At lower Ca2+influx rates, there was an
immediate release of mCherry signal from the cell periphery and a concomitant increase in cytosolic mCherry signal (Fig. 4A,B), but within the same cells, there was no accompanying release of GFP from peripheral ezrin–GFPi (Fig. 4A,C). This provided strong evidence for thein situ cleavage of ezrin located at the cell periphery at moderate Ca2+influx, which may result in an intra-wrinkle Ca2+ concentration of 10–20 µM (Brasen et al., 2010). When these cells were subsequently subjected to a higher Ca2+ influx rate, both fluorescent tags were again lost from the cell periphery to the cytosol (Fig. 4A–D). As the ratio of the two fluorophores at the membrane does not change during this second stage of release (Fig. 4E), it was concluded that no further separation of the fluorescent tags occurred. Since elevated Ca2+ can activate phospholipase C (PLC) (Rhee, 2001; Thore et al., 2005), the possibility existed that depletion of PLC substrate phosphatidylinositol 4,5-bisphosphate (PIP2) may account
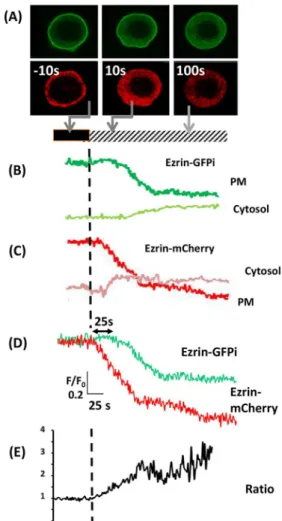
Fig. 3. Peripheral ezrin cleavage and release in response to Ca2+influx.
(A) A sequence of images of a RAW 264.7 cell expressing both ezrin–GFPi (upper sequence) and ezrin–mCherry (lower sequence) in response to a triggered Ca2+influx at time zero. (B) The time course of the intensity of ezrin–
mCherry within the cytoplasm (cytosol) and the plasma membrane (PM) during Ca2+influx as indicated by the bar (black, no Ca2+; hatched, 13 mM
Ca2+). (C) The time course of the intensity of ezrin–GFPi within the cytosol and
the plasma membrane in the same cell as B. (D) The time course of the intensities of ezrin–GFPi and ezrin–mCherry at the cell periphery normalised (F/F0) for easier comparison of the extent and timing difference. (E) The time
course of the change in the ratio of GFP:mCherry intensity at the cell edge. The horizontal and vertical axis marker shown as an insert in D also applies to B and C. The vertical axis in E shows the ratio of GFP:mCherry intensity at the cell edge with the same time axis as in B–D but, for clarity, is shown separately. This example data was typical of at least three similar experiments.
RESEARCH ARTICLE Journal of Cell Science (2020) 133, jcs236968. doi:10.1242/jcs.236968
Journal
of
Cell
for the release of ezrin. PIP2 is the binding partner of the FERM domain (Raucher et al., 2000; Barret et al., 2000; Hao et al., 2009). The PIP2binding site of ezrin–GFPi is functional because it has been shown that a PIP2-binding mutant of ezrin–GFPi (M.M., unpublished data) behaves in a similar manner to the ezrin-VSVG-PIP2 mutant described in Barret et al. (2000). The involvement of PLC in the Ca2+influx-triggered release of ezrin was therefore tested by pharmacological inhibition of PLC with U73122, which, while having no effect on the rapid Ca2+-influx triggered release of ezrin significantly delayed the full release by ∼100 s (Fig. S1). This suggests a role for PIP2 depletion in the slow-release mechanism, which would apply to both the ezrin ‘stump’ (containing GFPi) and the whole molecule. The demonstration of the initial separation of the two ezrin-linked
fluorescent tags, however, clearly demonstrates that ezrin cleavage in the linker region occurs at moderate levels of Ca2+influx.
The morphological effect of the experimentally induced Ca2+ influx was an abrupt increase cell area or ‘cell footprint’, which occurred concomitantly with the initiation of ezrin cleavage (Fig. 5A). Loosely attached cells also rounded up, their curvature quickly approximating that of a sphere (Fig. 5B). Even in grossly spherical cells, with no peripheral mCherry–ezrin remaining, ezrin– GFPi was still detectable at discrete loci at the cell periphery (Fig. 5C), suggesting that the FERM–GFPi stump of ezrin remained at the membrane. This gave a stark visual confirmation of the separation of the two fluorescent tags, and that cleavage of peripheral ezrin had occurred within cells subjected to Ca2+influx.
Release of ezrin during phagocytosis
In order to establish whether cleavage of plasma membrane ezrin also occurred during physiologically signalled cell shape change, RAW 264.7 cells transfected with C-terminally labelled ezrin, ezrin–GFP, were presented with mouse C3bi-opsonised zymosan particles using
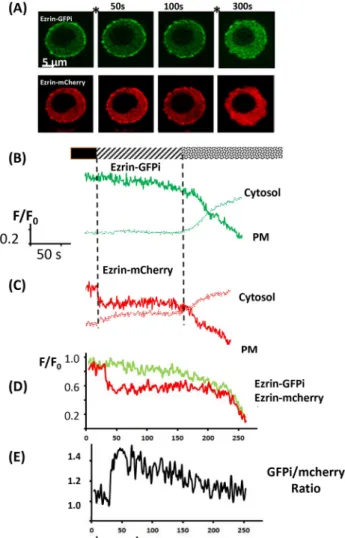
Fig. 4. Peripheral ezrin cleavage in response to Ca2+influx. (A) A sequence
of images of a RAW 264.7 cell expressing both ezrin–GFPi (upper sequence) and ezrin–mCherry (lower sequence) in response to two-step triggered Ca2+
influx (at time points between images, as indicated by the asterisks) after treatment with 25 µM thapsigargin and ionomycin 10 µM. The first step was driven by 2.6 mM extracellular Ca2+and the second by 13 mM extracellular
Ca2+. (B) The time course of the intensity of ezrin–mCherry within the cytoplasm
(cytosol) and the plasma membrane (PM) during Ca2+influx as indicated by the
bar (black, no Ca2+; hatched, 2.6 mM Ca2+; dotted, 13 mM Ca2+). (C) The time
course of the intensity of ezrin–GFPi within the cytoplasm and the plasma membrane in the same cell as in B. (D) The time course of the intensities of ezrin–GFPi and ezrin–mCherry at the cell periphery normalised (F/F0) for easier
comparison of the extent and timing difference. (E) The time course of the change in the ratio of GFP:mCherry at the cell edge as a measure of ezrin cleavage. These examples are typical of at least three similar experiments.
Fig. 5. Peripheral ezrin cleavage and cell swelling. (A) The time course of the cell footprint area (in µm2) and the ratio of GFP:mCherry intensity at the cell
periphery as a measure of ezrin cleavage in response to Ca2+influx. The
markers (i,ii,iii) indicate the time at which the images shown in B were taken. The images in B are the ratio of GFP:mCherry intensity at the cell periphery pseudo-coloured according to the scale shown on the right. (C) A typical example of data from the final stage of Ca2+influx-induced shape change (i.e. a
fully swollen spherical cell) where the first image is the phase-contrast view, the second image shows the cytosolic distribution of the mCherry-containing fragment of ezrin and the right-hand image shows the distribution of the ezrin– GFPi fragment with arrows highlighting some of the regions with obvious GFP but no mCherry, which may indicate ezrin‘stumps’ which are still attached to the membrane by the FERM domain.
RESEARCH ARTICLE Journal of Cell Science (2020) 133, jcs236968. doi:10.1242/jcs.236968
Journal
of
Cell
a micropipette technique (Dewitt and Hallett, 2002; Dewitt et al., 2003), to stimulate phagocytosis by the selected cell (Fig. 6A). Peripheral ezrin signal was lost at the zymosan contact site after initial pseudopodia had formed a phagocytic cup (Fig. 6B). The pseudopodia which grew around the remainder of the particle was also devoid of ezrin–GFP (Fig. 6B,C) as was the resultant phagosomal membrane (Fig. 6B). We also monitored the temporal relationship between the onset of Ca2+signalling using the cytosolic Ca2+indicator Fura Red. The loss of C-terminally labelled ezrin from the contact membrane or phagocytic cup was synchronous with particle contact-induced Ca2+ signalling (Fig. 6D). However, in conditions where the phagocytic cup does not progress to full internalisation of the particle, such as when calpain activity is inhibited, although Ca2+signalling may be triggered, the release of the C-terminus of ezrin fails to occur (Fig. S2).
Separation of the ezrin C and N termini during phagocytosis
The possibility existed, as demonstrated above for experimentally induced Ca2+ influx, that the Ca2+ influx triggered by particle contact prior to phagocytosis also activated calpain and was
responsible for the release of the C-terminally tagged ezrin (Fig. 5). In order to test this, as above, the ezrin–GFPi and ezrin–mCherry transfection strategy was employed. RAW264.7 cells, co-transfected with ezrin–GFPi and ezrin–mCherry, were challenged to undergo phagocytosis of C3bi-opsonised zymosan particles. The intensity of both fluorophores was reduced at the phagocytic cup as phagocytosis proceeded (Fig. 7A) with identical kinetics (Fig. 7B). The ratio of the two fluorophores remaining at the base of phagocytic cup was thus unchanged throughout the process of phagocytosis (Fig. 7C). This indicated that the release of ezrin from this location was not solely due to cleavage for ezrin in the linker region (generating two separately located fluorescent tag-containing fragments), but could be a result of PIP2 hydrolysis (release the FERM attachment and thus releasing both fluorescent tags). However, in the tips of the extending phagocytic pseudopodia, there were large separations of the N- and C-terminal fluorescent tags (Fig. 8A) resulting in localised large increases in the ratio of the N-terminal tag to the C-terminal tag (Fig. 8B). At 15 s after
Fig. 6. Localised loss of C-terminal GFP–ezrin during phagocytosis. (A) The experimental approach adopted for delivering an C3bi-opsonised zymosan particle to a RAW 264.7 cell using a micropipette (labelled‘mpip’) to the cell. This approach allows the precise moment of contact between the particle and the cell to be defined. (B) Three sequences of images of a RAW 264.7 cell expressing C-terminally tagged ezrin–GFP and loaded with the Ca2+indicator
Fura Red. The first sequence shows the phase-contrast images (PContrast); the second the ezrin distribution; and the third the Fura Red intensity, which decreases upon the elevation of cytosolic Ca2+. The time after contact with the
zymosan particle is shown. (C) An enlargement of the ezrin–GFP image at 30 s after contact showing the localised loss of intact ezrin and the phagocytic cup. (D) The time course of the intensity of ezrin–GFP at the phagocytic (Phag) cup and the cytosolic Ca2+level. The time of contact of the zymosan particle is
indicated. The complete data set is shown in Movie 2. These examples are typical of at least five similar experiments and with different fluorophores at the C-terminus, including ezrin–Emerald and ezrin–mCherry.
Fig. 7. Loss of ezrin fragments from the phagocytic cup. (A) A sequence of images of a RAW 264.7 cell expressing ezrin–GFPi and C-terminally tagged ezrin–mCherry from phagocytic cup formation (0 s) to pseudopodia extension (50 s) to completion of phagocytosis (80 s) and finally retraction and internalisation of the zymosan particle (140 s). The upper sequence of images shows ezrin–GFPi and the lower sequence shows ezrin–mCherry. The approximate location of the zymosan particle is shown in the first image (Z). (B) The time course of the intensity of ezrin–mCherry (lower pair) and ezrin– GFPi (upper pair) within the cytoplasm (cytosol) and the plasma membrane of the phagocytic cup. (C) The time course of the intensities of ezrin–GFPi and ezrin–mCherry at the phagocytic cup normalised (F/F0) for easier comparison
of the extent and similarity of kinetics. This example is typical of at least three similar experiments.
RESEARCH ARTICLE Journal of Cell Science (2020) 133, jcs236968. doi:10.1242/jcs.236968
Journal
of
Cell
phagocytic cup formation, the GFPi:mCherry ratio at the tips of the pseudopodia increased dramatically (Fig. 8C). The release of ezrin– mCherry but not ezrin–GFPi in these pseudopodia gave detectable increases in the GFPi:mCherry ratios in the pseudopodia from∼15– 45 s after initial particle contact (Fig. 8D). After this time, the intensity of both probes was too low for further reliable imaging calculations, as a result of the extreme thinning of the pseudopodia and possibly the loss of both fluorescent tags. However, the clear separation of the two fluorescent tags on ezrin, which was dynamically maintained throughout the pseudopod extension process (see Movie 2), indicates that cleavage of ezrin occurs at the tips of extending pseudopodia.
DISCUSSION
In this paper, we have presented evidence that ezrin cleavage occurs during non-restricted Ca2+ influx and locally in the phagocytic
pseudopodia. This evidence was drawn from the dynamic separation of two fluorescent tags on ezrin constructs, a red fluorophore, mCherry at the actin-binding C-terminus and a green fluorophore, GFP within the FERM domain at the N-terminus, which, in unstimulated cells, co-locate at the cell periphery but, during phagocytosis, or induced Ca2+ influx separate. As C-terminal mCherry is lost from the cell periphery while N-terminal GFP remains, this indicates that cleavage of ezrin had occurred between these two loci, such that the C-terminal fragment was free to diffuse away into the cytosol, while the N-terminal fragment remained attached to the plasma membrane. This is consistent with kinetics studies, which show that the affinity of the FERM domain at the N-terminus for the plasma membrane is high compared to the affinity of the actin-binding domain at the C-terminus for actin (Coscoy et al., 2002). This explains why constructs with a fluorescent tag attached at the extreme N terminus do not bind at the cell periphery. However, by placing the fluorophore away from the extreme N-terminus of FERM, such as in the ezrin–GFPi construct, the protein binds to the cell periphery, yet still provides proteins with the essential characteristic for our approach, namely different fluorophores located either side of the anticipated calpain cleavage site. An initially unexpected finding in this study was that ezrin–GFPi was also lost from the cell edge during Ca2+influx, suggesting either additional cleavage sites on ezrin apart from the linker region, or release of the intact ezrin molecules. Like a number of other proteases, calpain is a promiscuous enzyme and there is no clear recognition site that predicts where calpain would cleavage. The promiscuity is evident when experimentally calpain is given only one potential substrate in vitro. A prediction algorithm using a multiple kernel learning (DuVerle et al., 2011) suggests that there are several potential calpain cleavage sites within ezrin (Elumalai, 2012; Roberts, 2017; Roberts et al., 2018), which may explain the observedin vitro release of ezrin from the capture antibody when challenged with activated calpain. However, it should be reiterated that, in this assay, there was a clear preference for cleavage within the linkage region. The situationin vivo may also include an element of this promiscuity, especially with high Ca2+influx rates, when the amount of activated calpain may be high and the promiscuous effect becomes evident. In conditions when Ca2+influx was lessened, it was possible to demonstrate the more-specific and probably physiological cleavage of ezrin restricted to within the linker region, causing separation of the two fluorophores. During phagocytosis, there is an additional factor that probably explains the loss of both ezrin constructs, namely, changes in the localised phospholipid composition of the membrane during phagocytosis. PIP2 in the plasma membrane, the binding partner of the FERM domain of ezrin (Barret et al., 2000), is locally‘consumed’ during phagocytosis through conversion into inositol (3,4,5)-trisphosphate (IP3) duringβ2 integrin engagement of C3bi (Mueller et al., 2010; Lomakina and Waugh, 2010), and by the production of phosphatidylinositol (3,4,5)-trisphosphate (PIP3) (Stephens et al., 2002). PIP3 is initially generated at the phagocytic cup and progressively along the phagocytic pseudopodia (Dewitt et al., 2006). In RAW264.7 cells, the loss of PIP2in the phagocytic cup has been demonstrated (Botelho et al., 2000), which would cause the release of both intact ezrin and the calpain-cleaved FERM–GFPi ‘stub’ of ezrin. This would explain why cleavage was only detectable at the advancing tips of pseudopodia. Unfortunately, it is not possible to test this hypothesis pharmacologically, as inhibition of IP3 or PIP3 production prevents both phagocytosis and the Ca2+signal (Dewitt et al., 2006), the later probably as a result of the role of PIP3in PLC activation (Rameh et al. 1998; Pasquet et al., 2000). Similarly, the role of calpain cannot be tested
Fig. 8. Ezrin cleavage at the leading edge of phagocytic pseudopodia. (A) An enlarged view of a RAW 264.7 cell expressing ezrin–GFPi and ezrin– mCherry extending pseudopodia to engulf an C3bi-opsonised zymosan particle at 50 s after contact (as shown in Fig. 7A). There is a total loss of both fluorophores from the base of the phagocytic cup, but at the leading edge of the pseudopodia ezrin–mCherry is reduced to a greater extent than GFPi. (B) The image shows the ratio of GFP:mCherry intensity at the phagocytic site 30 s after particle contact, pseudo-coloured according to the scale shown on the right of D. (C) The profile of GFP:mCherry ratio (R) values from the cell edge adjacent to the phagocytic site and along the pseudopodium. The dotted line indicates the approximate boundary between the cell edge not involved with the
pseudopodium and thereafter there was a small rise in ezrin cleavage signal along the length of the pseudopodium until the final 1–2 µm where the ratio is significantly elevated. (D) The sequence of GFP:mCherry ratio images from contact and phagocytic cup formation until near closure at 75 s. The individual fluorescence signals from GFP and mCherry are shown in Fig. 7. The complete data set for the images in A and B is shown in Movie 3. Similar increases in the ezrin cleavage signal within the pseudopod were seen in four other experiments.
RESEARCH ARTICLE Journal of Cell Science (2020) 133, jcs236968. doi:10.1242/jcs.236968
Journal
of
Cell
pharmacologically as calpain inhibitors also inhibit phagocytosis (Dewitt and Hallett, 2002). The Ca2+ signal generated by phagocytosis may not be restricted to the region of the cell where phagocytosis is occurring (Dewitt et al., 2003), but the effect of Ca2+ influx is expected to be highest where the membrane folds to enclose the smallest cytosolic volume (such as the phagocytic pseudopodia). This is because the surface area for Ca2+influx:cytosolic volume ratio is highest at these areas (Brasen et al., 2010), and once the Ca2+ influx rate exceeds the Ca2+buffering diffusion rate, mathematical modelling has shown that the free Ca2+concentration can exceed 30 µM within these regions (Brasen et al., 2010), which is sufficient to activate calpain (Goll et al., 2003).
Our present work may help to explain the mechanism by which the membrane reservoir is maintained and then deployed during cell spreading and phagocytosis. In this study, ezrin cleavage and release accompanies cell shape changes. It is well known that, in other situations, ezrin is intimately involved in maintaining cell surface structures such as epithelial microvilli (Yonemura et al., 1999; Saotome et al., 2004), placental microvilli (Berryman et al., 1995) and other microvilli (Bretscher, 1983; Pakkanen and Vaheri, 1989; Andréoli et al., 1994). In phagocytic myeloid cells, the surface is characterised by micro-ridges and wrinkles (Bessis, 1973; Hallett et al., 2008; Al-Jumaa et al., 2017), which are enriched in ezrin (Figs 1,3–5; Roberts et al., 2018) and are probably maintained by ezrin linking to the underlying cortical actin network (Roberts and Hallett, 2019). It has been proposed that these cell surface structures are the membrane reservoir required for the expansion of membrane for phagocytosis and cell spreading (Dewitt and Hallett, 2007; Hallett and Dewitt, 2007; Roberts and Hallett, 2019) with both myeloid cell spreading and phagocytosis being accelerated by cytosolic Ca2+ signals (Kruskal et al., 1986; Pettit and Hallett, 1998; Dewitt and Hallett, 2002; Dewitt et al., 2013). The release of ezrin from the cell periphery demonstrated here may provide the link between these phenomena. Ca2+influx, amplified within folded cell surfaces, such as wrinkles and phagocytic pseudopodia, activate calpain which cleaves ezrin and so releases the folded membrane for the formation of phagocytic membrane of pseudopodia and the phagosome.
We therefore conclude from the results reported in this paper, that peripheral ezrin is cleaved during Ca2+-influx-induced cell spreading and locally within the extending pseudopodia during phagocytosis. This was consistent with the cleavage of ezrin being required for the release of folded membrane on the cell surface for the rapid increase in the available cell surface area required for cell spreading and phagocytosis.
MATERIALS AND METHODS
Plasmids
Plasmids with fluorescent C-termini tags coding for ezrin–mCherry and ezrin–mEmerald were Addgene plasmids #55043 and #54090 (deposited by Michael Davidson), and eGFP–ezrin (pHJ421) was Addgene plasmid #20680 (deposited by Stephen Shaw). The novel ezrin–GFPi plasmid was prepared as previously described (Marion et al., 2011) and was re-sequenced to verify the intra-domain location of the GFP insert within the N-terminal FERM domain. The plasmid encoding for C2-γ-YFP was a kind gift from Theodorus W. Gadella (Swammerdam Institute for Life Sciences, University of Amsterdam, The Netherlands) (Adjobo-Hermans et al., 2008)
Raw 264.7 cell transfection
RAW 264.7 cells were electroporated to introduce ezrin plasmids (3 µg plasmid DNA per 2×10⁶cells) using the Cell Line Nucleofector (Lonza) as described previously (Lewis, 2011). Cells were incubated at 37°C in 5% CO2for 3–4 h to enable expression of the newly introduced DNA, before imaging on a Leica SP5 confocal microscope. Fluorescent protein
expression in transfected RAW 264.7 cells was detected by ∼1 h post transfection, but expression was optimal at∼4 h post transfection.
Confocal microscopy and image analysis
Confocal imaging was achieved using a Leica SP5 confocal inverted microscope (Leica Microsystems, Heidelberg) equipped with rapid resonance laser scanning using 633 nm and 488 nm argon lasers (63× objective) with cells in a perfusion chamber held at 37°C. Simultaneous scanning by two lasers was achieved by sequentially scanning with each alternate laser line within the two images so there was no possibility of optical crossover (by inadvertent excitation of both fluorophores) and each image pair was acquired over the same time period. Image analysis and presentation was achieved using ImageJ software (https://imagej.nih.gov/ij/). Ratio images were calculated by using a dynamic mask and the Ratio Plus plugin (Ratio_Plus.java by Paulo J. Magalhães, University of Padua, Italy) and displayed using pre-set pseudo-colour look-up tables (LUTs) from within ImageJ. The dynamic mask allows the peripheral fluorophore intensity to be quantified accurately in cells (or regions of cells) that change shape. Changes in cell areas were quantified by use of binary thresholding in the fluorescent images to distinguish pixels within the cell from those outside the cell (allocated a zero pixel value) and quantifying the number of non-zero pixels in each frame.
In vitro proteolytic cleavage of ezrin constructs
The anti-ezrin antibody (EP924Y, Abcam, Cambridge, UK) to residues surrounding tyrosine 145 in the N-terminal domain of ezrin, was plated onto a Greiner flat-bottomed high and medium binding 96-well plate (Sigma) at a 1:10 dilution in 50 µl PBS (155 mM NaCl, 1 mM KH2PO4, 3 mM Na2HPO4, pH 7.4) and left overnight at 4°C to adhere. Non-adhered antibody was removed by aspiration and the plate was washed thoroughly in balanced salt solution (BSS). RAW 264.7 cell lysate containing ezrin– mCherry or ezrin–GFPi, prepared by lysis of ∼107cells with Triton X-100 [0.1% (v/v) in PBS containing 1 mM EGTA], was loaded onto the antibody capture wells (100 µl per well), in triplicate, and left overnight at 4°C. Unbound lysate was removed by aspiration and the plate was washed twice in BSS. Human neutrophil cytosol lysate ( prepared in EGTA-containing lysate buffer) was used as the source of µ-calpain and other proteases were added before Ca2+was added to initiate the proteolytic reaction. After 2 min, the supernatant was extracted from the wells and placed in a flat clear-bottomed microtiter plate and the fluorescence recorded using a BMG FLUOstar OPTIMA plate reader, excitation and emission settings were 485 nm and 520 nm set for ezrin–GFPi, and 494 nm and 554 nm for ezrin– mCherry, respectively. The logic of the assay with solid-phase capture of full-length ezrin and the release of the aqueous phase fragment following proteolytic cleavage is shown in Fig. 2B.
Phagocytosis
Zymosan particles were opsonised with mouse C3bi by incubation with whole-mouse serum. The opsonised particles were either allowed to sediment onto adherent RAW 264.7 cells, where phagocytosis occurred after random contact and binding of the particles to the cell under observation, or directed phagocytosis was achieved by‘holding’ a zymosan particle in the mouth of a micropipette with slight negative pressure and delivering it to the cell under observation, as described previously (Dewitt and Hallett, 2002; Dewitt et al., 2003). The latter procedure had the advantage that the time of contact between the cell and the particle was defined and early events, such as phagocytic cup formation, Ca2+signalling and ezrin cleavage could be observed accurately.
Potential inaccuracies in detection
There are at least three sources which could cause inaccuracies in interpretation of the changes in the ratio of the two fluorophores.
First, differential photobleaching of the two fluorophores was observed over longer exposure times. We found that the effect of photobleaching on the ratio was small (Fig. S3), rising approximately linearly from 1.0 to 1.15 over 3 mins of laser exposure. This magnitude is insufficient to account for the ratio changes observed during cell stimulation [i.e. ratio (R)max=3–10 in Figs 3E, 5B and 8C] or to account for non-linear changes in the ratio during Ca2+addition or phagocytosis.
RESEARCH ARTICLE Journal of Cell Science (2020) 133, jcs236968. doi:10.1242/jcs.236968
Journal
of
Cell
Second, differential partitioning into the membrane. Ezrin–GFPi is a constitutively active form of ezrin (Dard et al., 2001), and is in the active configuration without requiring phosphorylation. The membrane:cytosolic ratio for ezrin–GFPi is thus higher than that for ezrin–mCherry, where the proportion of free ezrin–mCherry is higher (Coscoy et al., 2002). This results in different membrane:cytosol ratios for ezrin–GFPi and ezrin–mCherry. However, our method depends on the ratio of the two membrane-bound ezrins and this will not adversely affect the measurement. There may be a bias against the release of mCherry as there is a larger cytosolic pool of ezrin–mCherry, which could replace ezrin–mCherry lost from the membrane. This would reduce the rate of the apparent loss of membrane ezrin–mCherry compared to ezrin–GFPi with very little cytosolic ezrin-GFPi for replacement. As stimulation caused the loss of ezrin–mCherry to be faster than the loss of ezrin–GFPi, the bias would be in the opposite direction. In fact, neither membrane ezrin–mCherry nor ezrin– GFPi was quickly replaced from the cytosol but was observed to be replaced only by lateral diffusion of membrane ezrin.
Finally, the ezrin–GFPi:ezrin–mCherry cannot accurately quantify ezrin cleavage in thin psuedopdia. In this study, we have taken ratios of the intensity of membrane ezrin–GFPi:ezrin–mCherry. As preferential loss of membrane ezrin–mCherry will increase the ezrin–GFPi:ezrin–mCherry ratio, this provides a positive correlation with ezrin cleavage. However, in thin extending pseudopodia, fluorescence from both fluorophores decreases as the amount of material within the detection zone decreases. Ideally, if there is no preferential loss of membrane ezrin–mCherry, the ratio will stay constant. However, once either ezrin–GFPi or ezrin–mCherry intensity approaches zero, the noise causes the ratio calculation to be erratic. Although the problem is easily solved by rejecting ratio values once a minimum intensity value has been reached or when the variability of the calculated ratio is extreme, this prevents measurement of ezrin cleavage at the extreme tips of the pseudopodia. We were able to measure ezrin cleavage in pseudopodia 5 µm from the cell body in the example shown in Fig. 8C, but in this case the psuedopodia were thick and thus amenable for ratio imaging.
Acknowledgements
We are grateful to past members of the Neutrophil Signalling Group, Cardiff University Medical School whose ideas, enthusiasm and hard work lead to the data reported here.
Competing interests
The authors declare no competing or financial interests. Author contributions
Conceptualization: R.E.R., M.M., S.M., K.L., M.B.H.; Methodology: R.E.R., M.M., S.M., G.L.E., K.L., M.B.H.; Validation: R.E.R.; Investigation: R.E.R., G.L.E., K.L.; Resources: M.M., S.M., M.B.H.; Data curation: R.E.R., G.L.E., K.L.; Writing - original draft: M.B.H.; Writing - review & editing: R.E.R., M.M., S.M., M.B.H.; Supervision: M.B.H.
Funding
This work was funded by grants from the Medical Research Council (UK) and the Institute of Molecular and Experimental Medicine, Cardiff University.
Supplementary information
Supplementary information available online at
http://jcs.biologists.org/lookup/doi/10.1242/jcs.236968.supplemental References
Adjobo-Hermans, M. J. W., Goehart, J. and Gadella, T. W. J. (2008). Regulation of PLCβ1a membrane anchoring by its substrate phosphatidylinositol (4,5)-bisphosphate. J. Cell Sci. 121, 3770-3777. doi:10.1242/jcs.029785 Algrain, M., Turunen, O., Vaheri, A., Louvard, D. and Arpin, M. (1993). Ezrin
contains cytoskeleton and membrane binding domains accounting for its proposed role as a membrane-cytoskeletal linker. J. Cell Biol. 120, 129-139. doi:10.1083/jcb.120.1.129
Al Jumaa, M. A., Dewitt, S. and Hallett, M. B. (2017). Topographical interrogation of the living cell surface reveals its role in rapid cell shape changes during phagocytosis and spreading. Sci. Rep. 77, 9790. doi:10.1038/s41598-017-09761-6
Andréoli, C., Martin, M., Le Borgne, R., Reggio, H. and Mangeat, P. (1994). Ezrin has properties to self-associate at the plasma membrane. J. Cell Sci. 107, 2509-2521.
Barret, C., Roy, C., Montcourrier, P., Mangeat, P. and Niggli, V. (2000). Mutagenesis of the phosphatidylinositol 4,5-bisphosphate (PIP2) binding site in the NH2-terminal domain of ezrin correlates with its altered cellular distribution. J. Cell Biol. 151, 1067-1080. doi:10.1083/jcb.151.5.1067
Berryman, M., Gary, R. and Bretscher, A. (1995). Ezrin oligomers are major cytoskeletal components of placental microvilli: a proposal for their involvement in cortical morphogenesis. J. Cell Biol. 131, 1231-1242. doi:10.1083/jcb.131.5.1231 Bessis, M. (1973). Living Blood Cells and Their Ultrastructure. Berlin, Germany:
Springer.
Botelho, R. J., Teruel, M., Dierckman, R., Anderson, R., Wells, A., York, J. D., Meyer, T. and Grinstein, S. (2000). Localized biphasic changes in phosphatidylinositol-4,5-bisphosphate at sites of phagocytosis. J. Cell Biol. 151, 1353-1368. doi:10.1083/jcb.151.7.1353
Brasen, J. C., Olsen, L. F. and Hallett, M. B. (2010). Cell surface topology creates high Ca2+
signalling microdomains. Cell Calcium 47, 339-349. doi:10.1016/j.ceca. 2010.01.005
Bretscher, A. (1983). Purification of an 80,000-dalton protein that is a component of the isolated microvillus cytoskeleton, and its localization in nonmuscle cells. J. Cell Biol. 97, 425-432. doi:10.1083/jcb.97.2.425
Coscoy, S., Waharte, F., Gautreau, A., Martin, M., Louvard, D., Mangeat, P., Arpin, M. and Amblard, F. (2002). Molecular analysis of microscopic ezrin dynamics by two-photon FRAP. Proc. Natl. Acad. Sci. USA 99, 12813-12818. doi:10.1073/pnas.192084599
Dard, N., Louvet, S., Santa-Maria, A., Aghion, J., Martin, M., Mangeat, P. and Maro, B. (2001). In vivo functional analysis of ezrin during mouse blastocyst formation. Dev. Biol. 233, 161-173. doi:10.1006/dbio.2001.0192
Dewitt, S. and Hallett, M. B. (2002). Cytosolic free Ca2+
changes and calpain activation are required for β integrin-accelerated phagocytosis by human neutrophils. J. Cell Biol. 159, 181-189. doi:10.1083/jcb.200206089
Dewitt, S. and Hallett, M. (2007). Leukocyte membrane“expansion”: a central mechanism for leukocyte extravasation. J. Leukoc. Biol. 81, 1160-1164. doi:10. 1189/jlb.1106710
Dewitt, S., Laffafian, I. and Hallett, M. B. (2003). Phagosomal oxidative activity during beta 2 integrin (CR3)-mediated phagocytosis by neutrophils is triggered by a non-restricted Ca2+signal: Ca2+controls time not space. J. Cell Sci. 116, 2857-2865. doi:10.1242/jcs.00499
Dewitt, S., Tian, W. and Hallett, M. B. (2006). Localised PtdIns(3,4,5)P3 or PtdIns(3,4)P2 at the phagocytic cup is required for both phagosome closure and Ca2+ signalling in HL60 neutrophils. J. Cell Sci. 119, 443-451. doi:10.1242/jcs.02756 Dewitt, S., Francis, R. J. and Hallett, M. B. (2013). Ca2+
and calpain control membrane expansion during the rapid cell spreading of neutrophils. J. Cell Sci. 126, 4627-4635. doi:10.1242/jcs.124917
duVerle, D. A., Ono, Y., Sorimachi, H. and Mamitsuka, H. (2011). Calpain cleavage prediction using multiple kernel learning. PLoS ONE 6, e19035. doi:10. 1371/journal.pone.0019035
Elumalai, G. L. (2012). Cytosolic signalling and behaviour of oral neutrophils: Search for biochemical memory. Ph.D. Thesis, Cardiff University, Cardiff, UK. http://orca.cf.ac.uk/id/eprint/43089.
Fehon, R. G., McClatchey, A. I. and Bretscher, A. (2010). Organizing the cell cortex: the role of ERM proteins. Nat. Rev. Mol. Cell Biol. 11, 675-675. doi:10. 1038/nrm2986
Goll, D. E., Thompson, V. F., Li, H., Wei, W. and Cong, J. (2003). The calpain system. Physiol. Rev. 83, 731-801. doi:10.1152/physrev.00029.2002
Gould, K. L., Bretscher, A., Esch, F. S. and Hunter, T. (1989). cDNA cloning and sequencing of the protein-kinase tyrosine substrate,ezrin, reveals homology to band-4.1. EMBO J. 8, 4133-4142. doi:10.1002/j.1460-2075.1989.tb08598.x Hallett, M. B. and Dewitt, S. (2007). Ironing out the wrinkles of neutrophil
phagocytosis. Trends Cell Biol. 17, 209-214. doi:10.1016/j.tcb.2007.03.002 Hallett, M. B., von Ruhland, C. J. and Dewitt, S. (2008). Chemotaxis and the cell
surface-area problem. Nat. Rev. Mol. Cell Biol. 9, 662. doi:10.1038/nrm2419-c1 Hao, J.-J., Liu,Y., Kruhlak, M., Debell, K. E., Rellahan, B. L. and Shaw, S. (2009).
Phospholipase C-mediated hydrolysis of PIP2 releases ERM proteins from lymphocyte membrane. J. Cell Biol. 184, 451-462. doi:10.1083/jcb.200807047 Herant, M., Heinrich, V. and Dembo, M. (2005). Mechanics of neutrophil
phagocytosis: behavior of the cortical tension. J. Cell Sci. 118, 1789-1797. doi:10.1242/jcs.02275
Kruskal, B. A. and Maxfield, F. R. (1987). Cytosolic free calcium increases before and oscillates during frustrated phagocytosis in macrophages. J. Cell Biol. 105, 2685-2693. doi:10.1083/jcb.105.6.2685
Kruskal, B. A., Shak, S. and Maxfield, F. R. (1986). Spreading of human neutrophils is immediately preceded by a large increase in cytoplasmic free calcium. Proc. Natl. Acad. Sci. USA 83, 2919-2923. doi:10.1073/pnas.83.9.2919 Lewis, K. J. (2011). Control of neutrophil infiltration into inflamed tissue. the role of μ-calpain in neutrophil shape change. PhD Thesis, Cardiff University, Cardiff, Uk http://orca.cf.ac.uk/id/eprint/54485.
Lomakina, E. and Waugh, R. E. (2010). Signaling and dynamics of activation of LFA-1 and Mac-1 by immobilized IL-8. Cell. Mol. Bioeng. 3, 106-116. doi:10.1007/ s12195-009-0099-x
Marion, S., Hoffmann, E., Holzer, D., Le Clainche, C., Martin, M., Sachse, M., Ganeva, I., Mangeat, P. and Griffiths, G. (2011). Ezrin promotes actin assembly
RESEARCH ARTICLE Journal of Cell Science (2020) 133, jcs236968. doi:10.1242/jcs.236968
Journal
of
Cell
at the phagosome membrane and regulates phago-lysosomal fusion. Traffic 12, 421-437. doi:10.1111/j.1600-0854.2011.01158.x
Mueller, H., Stadtmann, A., Van Aken, H., Hirsch, E., Wang, D., Ley, K. and Zarbock, A. (2010). Tyrosine kinase Btk regulates E-selectin-mediated integrin activation and neutrophil recruitment by controlling phospholipase C (PLC) gamma 2 and PI3K gamma pathways. Blood 115, 3118-3127. doi:10.1182/blood-2009-11-254185 Oancea, E. and Meyer, T. (1998). Protein kinase C as a molecular machine for
decoding calcium and diacylglycerol signals. Cell 95, 307-318. doi:10.1016/ S0092-8674(00)81763-8
Pakkanen, R., and Vaheri, A. (1989). Cytovillin and other microvillar proteins of human choriocarcinoma cells. J. Cell. Biochem. 41, 1-12. doi:10.1002/jcb. 240410102
Pasquet, J.-M., Quek, L., Stevens, C., Bobe, R., Huber, M., Duronio, V., Krystal, G. and Watson, S. P. (2000). Phosphatidylinositol 3,4,5-trisphosphate regulates Ca2+ entry via Btk in platelets and megakaryocytes without increasing phospholipase C activity. EMBO J. 19, 2793-2802. doi:10.1093/emboj/19.12.2793
Pettit, E. J. and Hallett, M. B. (1998). Release of‘caged’ cytosolic Ca2+ triggers rapid spreading of human neutrophils adherent via integrin engagement. J. Cell Sci. 111, 2209-2215.
Rameh, L. E., Rhee, S. G., Spokes, K., Kazlauskas, A., Cantley, L. C. and Cantley, L. G. (1998). Phosphoinositide 3-kinase regulates phospholipase C gamma-mediated calcium signalling. J. Biol. Chem. 273, 23750-23757. doi:10. 1074/jbc.273.37.23750
Raucher, D., Stauffer, T., Chen, W., Shen, K., Guo, S. L., York, J. D., Sheetz, M. P. and Meyer, T. (2000). Phosphatidylinositol 4,5-bisphoshate functions as a second messenger that regulates cytoskeleton-plasma membrane adhesion. Cell 100, 221-228. doi:10.1016/S0092-8674(00)81560-3
Rhee, S. G. (2001). Regulation of phosphoinositide-specific phospholipase. Annu. Rev. Biochem. 70, 281-312. doi:10.1146/annurev.biochem.70.1.281
Roberts, R. E. (2017). Theμ-Calpain-Ezrin Axis: A Potential Target for Therapy in Inflammatory Disease. Ph.D. Thesis, Cardiff University, Cardiff, UK. http://orca.cf. ac.uk/id/eprint/108477.
Roberts, R. E. and Hallett, M. B. (2019). Neutrophil cell shape change: mechanism and signalling during cell spreading and phagocytosis. Intl. J. Mol. Sci. 20, 1383. doi:10.3390/ijms20061383
Roberts, R. E., Elumalai, G. L. and Hallett, M. B. (2018). Phagocytosis and motility in human neutrophils is competent but compromised by pharmacological inhibition of ezrin phosphorylation. Curr. Mol. Pharmacol. 11, 305-315. doi:10. 2174/1874467211666180516100613
Saotome, I., Curto, M. and McClatchey, A. I. (2004). Ezrin is essential for epithelial organization and villus morphogenesis in the developing intestine. Dev. Cell 6, 855-864. doi:10.1016/j.devcel.2004.05.007
Shcherbina, A., Bretscher, A., Kenney, D. M. and Remold-O’Donnell, E. (1999). Moesin, the major ERM protein of lymphocytes and platelets, differs from ezrin in its insensitivity to calpain. FEBS Lett. 443, 31-36. doi:10.1016/S0014-5793(98)01674-3
Stephens, L., Ellson, C. and Hawkins, P. (2002). Roles of PI3Ks in leukocyte chemotaxis and phagocytosis. Curr. Opin. Cell Biol. 14, 203-213. doi:10.1016/ S0955-0674(02)00311-3
Teruel, M. N. and Meyer, T. (2002). Parallel single-cell monitoring of receptor-triggered membrane translocation of a calcium-sensing protein module. Science 295, 1910-1912. doi:10.1126/science.1065028
Thastrup, O., Dawson, A. P., Scharff, O., Foder, B., Cullen, P. J., Drobak, B. K., Bjerum, P. J., Christensen, S. B. and Hanley, M. R. (1994). Thapsigargin, a novel molecular probe for studying intracellular calcium release and storage. Agents Actions 43, 187-193. doi:10.1007/BF01986687
Thore, S., Dyachok, O., Gylfe, E. and Tengholm, A. (2005). Feedback activation of phospholipase C via intracellular mobilization and store-operated influx of Ca2+in insulin-secretingβ-cells. J. Cell Sci. 118, 4463-4471. doi:10.1242/jcs. 02577
Yonemura, S., Tsukita, S. and Tsukita, S. (1999). Direct involvement of ezrin/ radixin/moesin (ERM)-binding membrane proteins in the organization of microvilli in collaboration with activated ERM proteins. J. Cell Biol. 145, 1497-1509. doi:10. 1083/jcb.145.7.1497
RESEARCH ARTICLE Journal of Cell Science (2020) 133, jcs236968. doi:10.1242/jcs.236968