HAL Id: hal-00303043
https://hal.archives-ouvertes.fr/hal-00303043
Submitted on 9 Aug 2007HAL is a multi-disciplinary open access
archive for the deposit and dissemination of sci-entific research documents, whether they are pub-lished or not. The documents may come from teaching and research institutions in France or abroad, or from public or private research centers.
L’archive ouverte pluridisciplinaire HAL, est destinée au dépôt et à la diffusion de documents scientifiques de niveau recherche, publiés ou non, émanant des établissements d’enseignement et de recherche français ou étrangers, des laboratoires publics ou privés.
The impact of mixing across the polar vortex edge on
Match ozone loss estimates
J.-U. Grooß, R. Müller, P. Konopka, H.-M. Steinhorst, A. Engel, T. Möbius,
C. M. Volk
To cite this version:
J.-U. Grooß, R. Müller, P. Konopka, H.-M. Steinhorst, A. Engel, et al.. The impact of mixing across the polar vortex edge on Match ozone loss estimates. Atmospheric Chemistry and Physics Discussions, European Geosciences Union, 2007, 7 (4), pp.11725-11759. �hal-00303043�
ACPD
7, 11725–11759, 2007Impact of across vortex edge mixing on Match ozone loss
estimates
J.-U. Grooß et al.
Title Page Abstract Introduction Conclusions References Tables Figures ◭ ◮ ◭ ◮ Back Close
Full Screen / Esc
Printer-friendly Version
Interactive Discussion Atmos. Chem. Phys. Discuss., 7, 11725–11759, 2007
www.atmos-chem-phys-discuss.net/7/11725/2007/ © Author(s) 2007. This work is licensed
under a Creative Commons License.
Atmospheric Chemistry and Physics Discussions
The impact of mixing across the polar
vortex edge on Match ozone loss
estimates
J.-U. Grooß1, R. M ¨uller1, P. Konopka1, H.-M. Steinhorst1, A. Engel2, T. M ¨obius2, and C. M. Volk2
1
Forschungszentrum J ¨ulich, Institut f ¨ur Chemie und Dynamik der Geosph ¨are, ICG-1: Stratosph ¨are, Germany
2
Johann Wolfgang Goethe-Universit ¨at, Frankfurt, Institut f ¨ur Atmosph ¨are und Umwelt, Germany
Received: 4 July 2007 – Accepted: 8 August 2007 – Published: 9 August 2007 Correspondence to: J.-U. Grooß ([email protected])
ACPD
7, 11725–11759, 2007Impact of across vortex edge mixing on Match ozone loss
estimates
J.-U. Grooß et al.
Title Page Abstract Introduction Conclusions References Tables Figures ◭ ◮ ◭ ◮ Back Close
Full Screen / Esc
Printer-friendly Version
Interactive Discussion
Abstract
The Match method for quantification of polar chemical ozone loss is investigated mainly with respect to the impact of mixing across the vortex edge onto this estimate. We show for the winter 2002/03 that significant mixing across the vortex edge occurred and was accurately modeled by the Chemical Lagrangian Model of the Stratosphere. Obser-5
vations of inert tracers and ozone in-situ from HAGAR on the Geophysica aircraft and sondes and also remote from MIPAS on ENVISAT were reproduced well. The model even reproduced a small vortex remnant that was isolated until June 2003 and was observed in-situ by a balloon-borne whole air sampler. We use this CLaMS simulation to quantify the impact of cross vortex edge mixing on the results of the Match method. 10
It is shown that a time integration of the determined vortex average ozone loss rates as performed in Match results in larger ozone loss than the polar vortex average ozone loss in CLaMS. Also, the determination of the Match ozone loss rates can be influ-enced by mixing. This is especially important below 430 K, where ozone outside the vortex is lower than inside and the vortex boundary is not a strong transport barrier. 15
This effect and further sampling effects cause an offset between vortex average ozone loss rates derived from Match and deduced from CLaMS with an even sampling for the entire vortex. Both, the time-integration of ozone loss and the determination of ozone loss rates for Match are evaluated using the winter 2002/03 CLaMS simulation. These impacts can explain the differences between CLaMS and Match column ozone loss. 20
While the investigated effects somewhat reduce the apparent discrepancy in January ozone loss rates, a discrepancy between simulations and Match remains. However, its contribution to the accumulated ozone loss over the winter is not large.
1 Introduction
The quantification of chemical ozone loss in the polar vortex over the whole winter is not 25
trivial since advection and mixing likewise influence ozone in the stratosphere. Different 11726
ACPD
7, 11725–11759, 2007Impact of across vortex edge mixing on Match ozone loss
estimates
J.-U. Grooß et al.
Title Page Abstract Introduction Conclusions References Tables Figures ◭ ◮ ◭ ◮ Back Close
Full Screen / Esc
Printer-friendly Version
Interactive Discussion methods to diagnose chemical ozone loss have been developed over the last decades
(Match, Vortex Average method, tracer-tracer correlation method, comparison of ob-servations with CTM passive ozone, see for exampleHarris et al. (2002) and WMO
(2007) for details). Also, various model simulations have been carried out in order to reproduce chemical ozone depletion. With the development of the models, consistency 5
between ozone loss obtained from simulations and observations improved. For
exam-ple,Becker et al.(2000) showed that in early cold Januaries the Match-derived estimate
of ozone loss rate is significantly under-estimated by the models, in particular at alti-tudes greater than 475 K. In recent publications it was shown that this discrepancy may be explained at least partly using assumptions like complete chlorine activation and a 10
rather large amount of bromine loading (Frieler et al.,2006), but this problem does not seem to be solved completely (e.g.Vogel et al.,2006). Also, recent updated versions of stratospheric Chemistry Transport Models (CTMs) seem to be able to reproduce the estimated total chemical ozone loss and its sensitivity to temperature (Chipperfield
et al.,2005;Douglass et al.,2006). 15
For a comparison of ozone loss estimates from the different methods and models it is essential to consider comparable conditions, that is the same vortex edge definition, same vertical range for column integration, and the same time range (Harris et al.,
2002). Published ozone loss estimates are therefore often not directly comparable. One of the quantities that is often derived is the ozone column change accumulated 20
over the winter and averaged over the area of the polar vortex. In some cases, this quantity significantly differs for different methods. Table1shows a comparison of pub-lished column ozone loss estimates for the winter 2002/2003 with a simulation of the Chemical Lagrangian Model of the Stratosphere (CLaMS) byGrooß et al.(2005) that is also presented here. Different times, vertical ranges and definitions of the vortex 25
edge are considered. It is evident, that there are large differences between the simu-lation and most other ozone loss estimates as generally the simulated ozone column losses are lower than the estimates from observations. The largest relative difference is found for the Match method (Streibel et al.,2006). Therefore, we investigate here
ACPD
7, 11725–11759, 2007Impact of across vortex edge mixing on Match ozone loss
estimates
J.-U. Grooß et al.
Title Page Abstract Introduction Conclusions References Tables Figures ◭ ◮ ◭ ◮ Back Close
Full Screen / Esc
Printer-friendly Version
Interactive Discussion the difference between the simulation and the Match ozone loss estimates. Briefly, in
the Match method the ozone loss is derived from multiple pairs of ozone sonde ob-servations that represent the same air mass since they are connected by a calculated trajectory (so-called “matches”).
Mixing of air masses across the vortex edge should have an influence on the deter-5
mined chemical ozone loss. Grooß and M ¨uller (2003) already investigated the impact of a large-scale vortex intrusion for the 1992 Arctic winter on the estimate of ozone loss rates from the Match method. They concluded that for this example on the 475 K poten-tial temperature level the filtering methods used by the Match technique are sufficient to sort out Match events that are influenced by these intrusions. However, apart from 10
filtering out these Match events, the Match method does not consider mixing across the vortex edge. Here, we revisit this issue and investigate in more detail how mixing through the vortex edge and other assumptions may influence the Match ozone loss estimates for the Arctic winter 2002/2003. We show that the assumption of a com-plete isolation of the polar vortex from mid-latitude air is not justified, especially for 15
the strongly disturbed stratospheric Arctic winter 2002/03, for which many intrusions of mid-latitude air into the vortex could be identified (G ¨unther et al., 20071).
Section 2 of this study describes the CLaMS model simulations for the winter 2002/03 that are presented in this study and Sect. 3 describes its validation with in-situ tracer observations. In Sect. 4, the permeability of the polar vortex and the mixing 20
through the vortex edge is investigated. In Sect. 5, the implications of across vortex edge mixing on ozone loss estimates are discussed.
1
G ¨unther, G., M ¨uller, R., Stroh, F., Konopka, P., and Volk, C.: Quantification of Mixing and Transport across the Boundary of the Lower Vortex during the Arctic Winter 2002/03, Atmos. Chem. Phys. Discuss., in preparation, 2007.
ACPD
7, 11725–11759, 2007Impact of across vortex edge mixing on Match ozone loss
estimates
J.-U. Grooß et al.
Title Page Abstract Introduction Conclusions References Tables Figures ◭ ◮ ◭ ◮ Back Close
Full Screen / Esc
Printer-friendly Version
Interactive Discussion
2 CLaMS simulations
The Chemical Lagrangian Model of the Stratosphere (CLaMS) is a Lagrangian 3-dimensional chemical transport model that is described elsewhere (McKenna et al.,
2002a,b; Konopka et al., 2004; Grooß et al., 2005). Here we present results of a
simulation for the Arctic winter 2002/03 that have already been published previously 5
(Grooß et al.,2005) with a horizontal resolution of about 100 km (hereafter referred to
as “chemistry simulation”). This simulation has been verified, especially with respect to correctly reproducing vortex ozone observations at the end of the Arctic winter (Grooß
et al.,2005).
In addition, a CLaMS simulation with tracer transport and without chemistry with a 10
higher resolution of 80 km and a higher vertical range (350 K to 1400 K) was performed (hereafter referred to as “tracer simulation”). The tracers CH4and N2O were initialized identically in both simulations (compareGrooß et al.,2005). The tracer simulation also considers the tracer CFC-11 that was initialized by using the following three CH4 /CFC-11 correlations (see Fig.1): the vortex correlation derived from MkIV balloon flight on 15
16 December (black), mid-latitude correlation based on all BONBON observations in mid-latitudes (gray) and, southward of 30◦N equivalent latitude, the tropical correlation
(yellow). The tropical correlation is derived from the CFC-12/CFC-11 observations with the LACE instrument (see Fig. 3 inRay et al., 2002) and by converting CFC-12 into CH4using the CFC-12/N2O correlation (see Fig. 4 inM ¨uller et al.,2001) and the 20
CH4/N2O correlation described above. To avoid crossing of the correlation lines, the vortex and the mid-latitude correlations were linearly extrapolated for CH4>1.5 ppmv
to the maximal value of the tropical correlation. Thus, southward of 30◦N equivalent
latitude, the tropical correlation is used to initialize the model and, northward of 30◦N equivalent latitude, the initial values of CFC-11 are calculated from the vortex and mid-25
latitude correlations with relative contributions given by the percentage of the vortex tracer quantifying the dilution of the vortex starting from 17 November.
The upper boundary at 1400 K for CH4is determined using ENVISAT-MIPAS
ACPD
7, 11725–11759, 2007Impact of across vortex edge mixing on Match ozone loss
estimates
J.-U. Grooß et al.
Title Page Abstract Introduction Conclusions References Tables Figures ◭ ◮ ◭ ◮ Back Close
Full Screen / Esc
Printer-friendly Version
Interactive Discussion vations averaged over equivalent latitude bins within a time window of 2 weeks and
stored every half month as a lookup table. The lower boundary at 350 K for CH4 are determined similarly by using the HALOE climatology (Grooß and Russell,2005). The boundary conditions for the remaining species are redefined with the same relations as for the initial conditions.
5
To quantify the dilution of the vortex air due to intrusions of the mid-latitude air into the vortex, an artificial vortex tracer was defined and transported in CLaMS that marks at the start of the simulation the air parcels inside and outside the vortex as 100% and 0%, respectively with the vortex edge definition according to the maximum PV gradient
Nash et al.(1996). Thus, the vortex tracer describes the percentage of pure vortex air
10
in each air parcel over the course of the model run.
3 Validation of the CLaMS simulation
The transport of CLaMS tracer simulation was validated by comparing with in-situ ob-servations. Figure 1 shows tracer observations by HAGAR (Stefanutti et al., 2004) on-board the Geophysica aircraft for 19 January in comparison with CLaMS simula-15
tions. The upper left panel depicts the time series of N2O observed by HAGAR in-strument (black crosses) and simulated with CLaMS tracer simulation (filled circles) along the Geophysica flight track with colors denoting the percentage of the vortex tracer (CLaMS) in the sampled air masses. The lower left panel shows the potential temperature θ (black), equivalent latitude (red) and the equivalent latitude of the vortex 20
edge calculated with the definition ofNash et al.(1996) for each potential temperature value along the flight track. Thus, the deviation of the red from the green line indi-cates how deep the Geophysica flight penetrated into the Arctic vortex. The right panel illustrates the observed (black crosses) and simulated (colored circles) CH4/CFC-11 correlations in comparison to the correlations used to initialize the model (black, gray 25
and yellow solid lines for tropic, mid-latitude and polar initialization, respectively). The filled gray circles denote CH4/CFC-11 CLaMS correlation calculated approximately
ACPD
7, 11725–11759, 2007Impact of across vortex edge mixing on Match ozone loss
estimates
J.-U. Grooß et al.
Title Page Abstract Introduction Conclusions References Tables Figures ◭ ◮ ◭ ◮ Back Close
Full Screen / Esc
Printer-friendly Version
Interactive Discussion ery 2 s along the flight track, the open circles correspond to the observation times and
are colored, in the same way as the time series, with the vortex tracer. Both, the time series and the correlations show that CLaMS reproduces well the observed features of tracer distributions. In particular, low N2O mixing ratios within the vortex caused by diabatic descent of the vortex air masses during the winter are well reproduced, even 5
if slightly underestimating the diabatic descent above 500 K in January by about 10 K. Furthermore, the model reproduces the profiles of N2O measured during the descents, ascends and dives of the Geophysica, N2O gradients across the vortex edge, fine scale structures as filaments (gray dashed areas) and curvature of the CH4/N2O correlations. Similar comparisons were found for the later Geophysica flights until mid-March (not 10
shown). The ongoing dilution of the vortex air due to intrusions of the mid-latitude air manifests in a gradual decrease of the vortex tracer values within the air masses sam-pled in the vortex and by a flattening of the curvature of the CH4/N2O correlation if compared with the initial vortex correlation (black line), however, the uncertainty in the initial tracer-tracer correlation seems to be too large to draw strong conclusions about 15
the simulated and observed difference to this initial correlation.
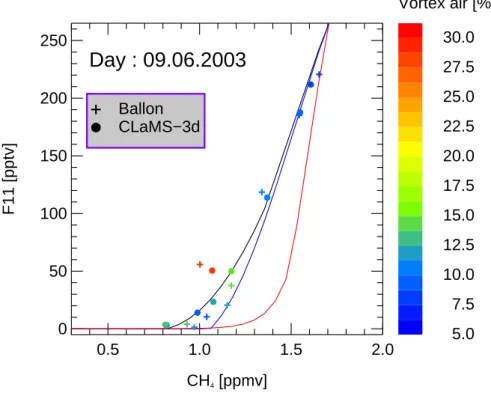
Further, remnants of the polar vortex did persist until mid-June in the potential tem-perature region between 500 and 600 K relatively isolated from the surrounding area. This was observed by balloon-borne whole air sampler measurements from Kiruna (Sweden) on 9 June 2003 (Schmidt et al., 1987; M ¨obius,2006) which are shown in 20
Fig.2. These observations confirm the existence of moderately mixed but clearly dis-tinguishable vortex air masses in this altitude region. Between 500 and 600 K, the ob-servations indicate a significant deviation from the mid-latitude correlation. For these air masses, CLaMS indicates still about 30% contribution of vortex air and also a sig-nificant deviation from the mid-latitude correlation comparable with the observed devia-25
tion. The good comparison of different tracers and the tracking of vortex remnants even until June, about two months after the final warming, also confirms very well the ability of CLaMS to correctly simulate tracer advection and mixing. This gives confidence that the artificial tracer Opass3 , that cannot be validated directly by observations, is a reliable
ACPD
7, 11725–11759, 2007Impact of across vortex edge mixing on Match ozone loss
estimates
J.-U. Grooß et al.
Title Page Abstract Introduction Conclusions References Tables Figures ◭ ◮ ◭ ◮ Back Close
Full Screen / Esc
Printer-friendly Version
Interactive Discussion quantity.
It was also shown byGrooß et al.(2005) that the chemistry simulation correctly re-produces the ozone observations. A direct comparison between CLaMS simulations and MIPAS observations of springtime ozone mixing ratio in the vortex yielded a very small difference (CLaMS-MIPAS), namely −0.06±0.24 ppmv (1σ). Similarly a compar-5
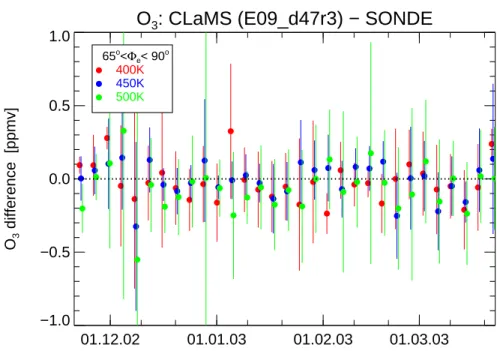
ison with in-situ ozone data by the FOX instrument on board the Geophysica yielded a difference of 0.06±0.19 ppmv (Grooß et al., 2005). Further, in Fig. 3 we show a time series of the average difference (±1σ) between ozone sonde observations and CLaMS evaluated at the observations location and time for 3 different potential temper-ature levels. The difference between CLaMS and ozone sonde data is typically within 10
±0.2 ppmv. Also, no obvious trend in this difference is seen.
4 Permeability of the polar vortex
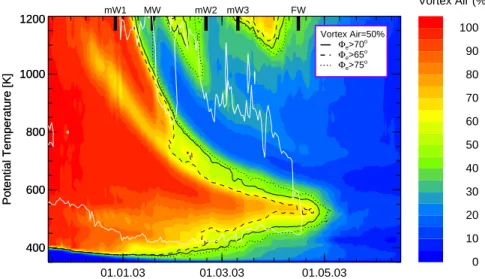
To quantify mixing into the vortex, we calculate the mean dilution of the vortex by averaging every day the vortex tracer over all air parcels poleward of 70◦N equivalent
latitude similar as it was done for the winter 1999/2000 (Steinhorst et al.,2005). This is 15
shown in Fig.4for the tracer simulation. From December to the final warming (FW) in late April (Naujokat and Grunow,2003), the vortex shrunk changing its edge from about 60◦to about 75◦N equivalent latitude. The 50% contour line (black line) approximately
confines the well-isolated part of the vortex. The dashed and dotted lines are the 50% contours resulting from the averaging over air parcels with equivalent latitude poleward 20
of 70◦ and 75◦N, respectively. The 65◦N line indicates an earlier onset of the mean
vortex dilution due to a stronger contribution of the extra-vortex air in the vicinity of the vortex edge. The white line is a measure of the permeability of the vortex edge and is defined as the maximum of the gradient of modified potential vorticity (Lait,1994) at the vortex edge determined according to the definition ofNash et al. (1996). The isoline 25
of 1.5 modified PV units per degree equivalent latitude (PVU deg−1) was determined empirically bySteinhorst et al. (2005), i.e. air masses within (without) this region are
ACPD
7, 11725–11759, 2007Impact of across vortex edge mixing on Match ozone loss
estimates
J.-U. Grooß et al.
Title Page Abstract Introduction Conclusions References Tables Figures ◭ ◮ ◭ ◮ Back Close
Full Screen / Esc
Printer-friendly Version
Interactive Discussion well isolated (permeable) with respect to the transport across the vortex edge.
The pattern of the mean dilution in Fig.4that is partially correlated with the increase of the vortex permeability indicates the top-down vortex decay until the vortex breakup. In particular, a strong vortex dilution around 800 K is triggered by the major warming (MW) at the end of January and a slow dilution of the vortex bottom can be seen, 5
slightly accelerated after 1 February and after 1 March. In the potential temperature region between 500 and 600 K, the vortex persisted until the final warming in April 2003. Lower down, more air was mixed onto the vortex. On 16 March, the vortex tracer averaged poleward of 65◦N equivalent latitude is about 50% and 40% for the
potential temperature levels 400 K and 450 K, respectively. But since the vortex edge 10
afterNash et al.(1996) is around 75◦N equivalent latitude, at 400 K about 50% of the
air within the vortex is of vortex origin. (Christensen et al.,2005) also estimated the amount of in-mixing into the vortex on the 475 K level using back-trajectories for day intervals. They obtain especially large in-mixing of 22% and 16% during the 10-day intervals of the Major Warming (MW) and the minor warming (mW2), respectively. 15
The corresponding in-mixing rate determined from the CLaMS vortex tracer averaged poleward of 65◦N show similar peaks at MW and mW2, but the it is lower by a factor
of 3 and 2.5, respectively. G ¨unther et al. (2007)1 provide a more detailed analysis of mixing and advection across the vortex edge for this winter.
5 Implications on ozone loss estimates 20
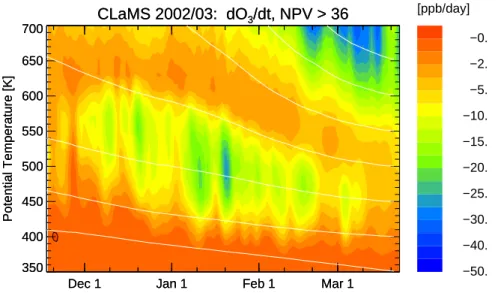
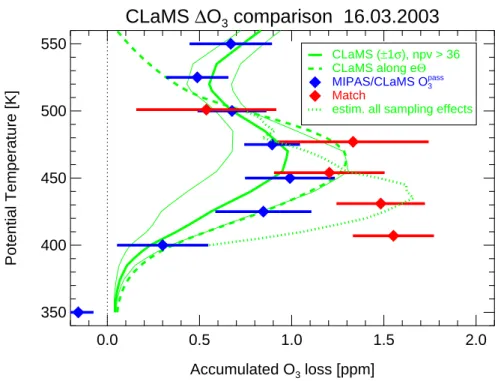
As mentioned above, the Match method and CLaMS simulations report significantly different ozone loss estimates for the winter 2002/03. In Fig.5, the simulated vortex average ozone loss rates are shown as a function of potential temperature and time. Figure6shows the corresponding accumulated ozone loss until 16 March from differ-ent methods. The thick solid green line shows the vortex average accumulated ozone 25
loss of the CLaMS simulation derived from the difference between simulated ozone and the passive ozone tracer Opass3 . The thin green lines mark the variability within the polar
ACPD
7, 11725–11759, 2007Impact of across vortex edge mixing on Match ozone loss
estimates
J.-U. Grooß et al.
Title Page Abstract Introduction Conclusions References Tables Figures ◭ ◮ ◭ ◮ Back Close
Full Screen / Esc
Printer-friendly Version
Interactive Discussion vortex (±1σ). The blue symbols correspond to the ozone loss derived from the
differ-ence between MIPAS ozone data and Opass3 . These results are comparable with those from the chemistry simulation. The Match results (Streibel et al.,2006) are shown as red symbols. It is evident, that the ozone loss estimate by Match is significantly larger than the result of the simulations. The derived average vortex column ozone losses be-5
tween 400 and 500 K potential temperature in the CLaMS simulation calculated from O3-Opass3 (average±1σ variability) is 31±11 Dobson Units (DU) and 33 DU from MIPAS O3-Opass3 . In contrast, the Match column ozone loss is reported as 56±4 DU (Streibel
et al., 2006). Tilmes et al. (2003) and M ¨uller et al. (2007)2 also determine the ac-cumulated ozone loss by the tracer correlation technique using HALOE and ILAS-II 10
data. For 15-25 February between 400 K and 500 K potential temperature 43±6 DU and 24±6 DU ozone loss is derived from HALOE data for vortex core and outer vor-tex, respectively. For 20-22 March the vortex average column ozone loss from ILAS-II was estimated to be 26±9 DU. However, in the March case an under-estimation of this value is likely in the case of significant mixing (M ¨uller et al.,2005). The Match results 15
are about comparable to the ozone loss determined by the vortex average approach
(Christensen et al., 2005). A different vortex edge definition is used and this study
shows only somewhat lower estimated ozone loss between 400 and 450 K compared with the Match results but within the error limits. The vortex average ozone loss esti-mate is also about 1 ppmv at 400 K. In the following, we investigate possible causes of 20
this discrepancy between CLaMS and Match in detail. 5.1 Method of integrating ozone loss rates
In the Match method, the accumulated ozone loss is determined by a time integra-tion of the vortex-average ozone loss rates. The result of this integraintegra-tion includes the
2
M ¨uller, R., Tilmes, S., Grooß J.-U., Engel, A., Oelhaf, H., Wetzel, G., Huret, N., Pirre, M., Catoire, V., Toon, G., and Nakajima, H.: Impact of mesospheric intrusions on ozone-tracer relations in the stratospheric polar vortex, J. Geophys. Res., submitted, 2007.
ACPD
7, 11725–11759, 2007Impact of across vortex edge mixing on Match ozone loss
estimates
J.-U. Grooß et al.
Title Page Abstract Introduction Conclusions References Tables Figures ◭ ◮ ◭ ◮ Back Close
Full Screen / Esc
Printer-friendly Version
Interactive Discussion ozone-depleted air masses that have left the vortex due to mixing or advection. Air
masses mixed into the vortex result in lower vortex average ozone loss that is also not considered by Match. To determine the difference between this estimate and the vortex-average accumulated ozone loss, we use the CLaMS chemistry simulation. Fol-lowingRex et al.(2004), we calculate the “springtime equivalent vortex potential tem-5
perature” (eΘ) by summing up the daily average vortex descent determined by the
radiation scheme in the CLaMS simulation (Morcrette,1991) for a corresponding vor-tex definition that is nPV>36 as used byStreibel et al. (2006) for the late winter. The over-plotted white lines in Fig.5mark these average descent lines (constant eΘ) within this region. The thick green dashed line in Fig.6depicts the accumulated ozone loss 10
derived by integrating the simulated ozone loss rates along the eΘ surfaces while ig-noring the mixing across the vortex edge. A vertical integration between 400 and 500 K of this result yields an accumulated column ozone loss of 43 DU which is 39% more than the simulated column ozone depletion within the polar vortex.
The reason for this difference is mixing and advection across the vortex edge that 15
brings not ozone-depleted air masses into the vortex. The CLaMS accumulated ozone loss determined from the difference to the passive ozone tracer Opass3 is therefore a mixture ozone depletion from air masses that originated from inside and outside the vortex. The Match estimate includes the air masses that left the vortex and does not include the air that with outside vortex origin. In the case of a significant chlorine-20
catalyzed ozone loss inside the vortex and almost no ozone loss outside the vortex, mixing through the vortex edge results in an apparent reduction of accumulated ozone loss. However, above 500 K the opposite is true, as at these altitudes the air masses undergo NOx-catalyzed ozone depletion that is weaker in the vortex core and stronger towards lower latitudes and outside the vortex. This is also visible in Fig. 6 for the 25
CLaMS simulation. For these altitudes no Match results are published.
At 450 K and above, the agreement between the CLaMS results integrated along eΘ and the Match results is very good. However, below that level, the simulation shows much lower ozone loss than the Match method. At 407 K, the discrepancy between
ACPD
7, 11725–11759, 2007Impact of across vortex edge mixing on Match ozone loss
estimates
J.-U. Grooß et al.
Title Page Abstract Introduction Conclusions References Tables Figures ◭ ◮ ◭ ◮ Back Close
Full Screen / Esc
Printer-friendly Version
Interactive Discussion the simulated ozone depletion and the Match result in mid-March is still as large as
1 ppmv. For determining the column ozone loss, especially the estimate at the low altitudes is important, since they contribute more to the column due to their higher air density. However, the validation of the CLaMS simulations demonstrates that an under-estimation of ozone depletion by the order of 1 ppmv due to model deficiencies is very 5
unlikely. Possible reasons for this discrepancy will be discussed below. 5.2 Impact of mixing across the vortex edge on ozone loss rates
In the previous section, the integration of the Match ozone loss rates was discussed. In the following sections, we discuss possible discrepancies of the Match-derived ozone loss rate itself. One possible explanation for the discrepancy below 430 K is that also 10
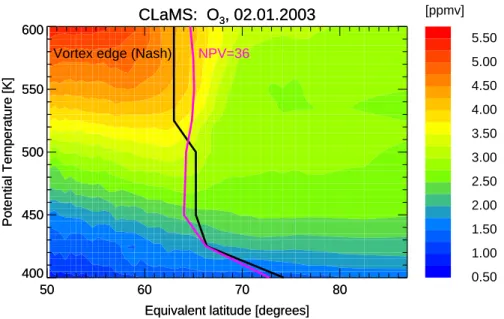
the ozone loss rates underlying the Match and vortex average estimates have been affected by mixing. Figure 7 shows the simulated ozone mixing ratio on 2 January averaged over equivalent latitude and potential temperature intervals. It is evident that below about 475 K, the ozone mixing ratios outside the vortex are lower than inside the vortex on a constant isentrope. For large-scale intrusions into the vortex it was already 15
shown that Match events affected by mixing were sorted out by the Match selection criteria (Grooß and M ¨uller,2003). But a continuous small-scale in-mixing of ozone-poor air into the vortex may cause an over-estimation of the Match-determined ozone loss rate. This would of course also similarly affect the results of the Vortex Average approach. The impact of mixing across the vortex edge and other effects on the ozone 20
loss rate estimate is quantitatively discussed below. 5.3 Sampling of ozone sondes
In this section, we investigate, whether the chosen pairs of ozone sonde observations are suitable for determining vortex average ozone loss rates. This has two aspects: Firstly, it may be that the chosen pairs of ozone sonde observations do not correspond 25
to comparable air masses and secondly, it is not clear, whether the ensemble of Match 11736
ACPD
7, 11725–11759, 2007Impact of across vortex edge mixing on Match ozone loss
estimates
J.-U. Grooß et al.
Title Page Abstract Introduction Conclusions References Tables Figures ◭ ◮ ◭ ◮ Back Close
Full Screen / Esc
Printer-friendly Version
Interactive Discussion events are representative for the whole polar vortex.
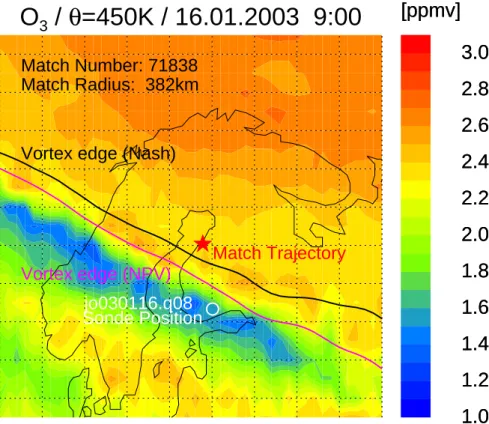
Large ozone gradients between the Match trajectory location and the corresponding ozone sonde location may have the consequence that the corresponding air masses are not comparable. An example of this is shown in Fig.8. Here the distance between the Match trajectory and the observation is 382 km within the allowed Match radius of 5
500 km, but the observation is even outside the vortex. The observed ozone mixing ratio is indicated by the color of the white bordered circle. It is located in a filament of mid-latitude air with low ozone and is simulated well by CLaMS.
The fact that only the second ozone sonde can be outside the vortex may cause a systematic effect. For this reason we repeated the Match analysis with a reduced data 10
set in which both the first and second sonde observation is within the vortex after the (stronger) criterion ofNash et al.(1996). With this, about 15% of the matches in winter 2002/2003 are sorted out. The results of this “reduced match” evaluation are explained below.
Further it is not clear, whether the ensemble of Match events are representative 15
for the whole polar vortex average. The distribution of pairs of ozone observation is shown to be about equal over the vortex with respect to PV (e.g.Streibel et al.,2006). The assumption that these matches are representative for the polar vortex cannot be evaluated quantitatively by the Match method.
5.4 Correlation of ozone loss with sunlight hours 20
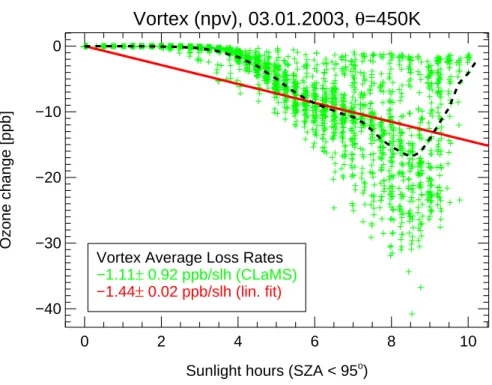
Further, we investigated the assumption of the Match method that ozone loss along a specific trajectory is linearly correlated with the time that the corresponding air parcels spent in sunlight. Air parcels in the relevant altitude range are in direct sunlight when the solar zenith angle is less that about 95◦. Especially in January, polar air parcels
spend a significant amount of time at this low sun altitude. We investigated this aspect 25
by evaluating the CLaMS ozone loss rate for one day (3–4 January). Figure9shows the simulated ozone loss for all air parcels inside the polar vortex at θ=450±10 K as a function of sunlight hours. It is evident that the simulation does not show a linear
ACPD
7, 11725–11759, 2007Impact of across vortex edge mixing on Match ozone loss
estimates
J.-U. Grooß et al.
Title Page Abstract Introduction Conclusions References Tables Figures ◭ ◮ ◭ ◮ Back Close
Full Screen / Esc
Printer-friendly Version
Interactive Discussion pendence. One reason for this is the non-uniform chlorine activation within the vortex
in the CLaMS simulation. Furthermore, air parcels with sunlight hours below about 3 h on that day typically have solar zenith angles larger than 92◦and show almost no sim-ulated ozone depletion. A linear fit between sunlight hours and ozone change yields an ozone loss rate of 1.44 ppbv per sunlight hour which is 29% above the CLaMS 5
vortex average at this level (1.11 ppbv per sunlight hour). Assuming that CLaMS sim-ulates ozone loss correctly at low sun elevation, the Match method would therefore over-estimate the ozone loss rates especially for the dark periods in early polar winter. However, this effect is not suited to explain the so-called January ozone loss problem
(Becker et al.,1998), since the reported discrepancies are much larger and with longer
10
trajectories this discrepancy becomes smaller. 5.5 Evaluation of possible ozone loss rate offsets
The possible offsets of the Match ozone loss rates discussed in the previous sections 5.2 to 5.4 are not evaluated individually. The best way to evaluate all potential effects associated with (a) cross vortex edge mixing, (b) vortex sampling and (c) correlation 15
of ozone loss with sunlight hours, is to sample CLaMS exactly at Match sonde loca-tions and times and perform then an identical Match analysis using simulated ozone. With this method, the single effects cannot be distinguished but the total impact of all mentioned effects can be investigated. Figure10shows a composition of CLaMS and Match ozone loss rates at 4 potential temperature levels. The “reduced Match” 20
results in which ozone sondes outside the Nash vortex edge are omitted are plotted as red circles and the original Match data are plotted as small pink circles. In gen-eral the results look very similar, however, in mid January at the 500 K level two points have significantly lower ozone loss rates. These have been reported to be the largest discrepancies between simulations and Match (Vogel et al.,2006).
25
The Match analysis of the CLaMS-sampled ozone sondes (for the reduced Match) is shown as blue circles. Also shown for comparison is the simulated vortex average ozone loss rate as green line including also the standard deviation (±1σ, green shaded
ACPD
7, 11725–11759, 2007Impact of across vortex edge mixing on Match ozone loss
estimates
J.-U. Grooß et al.
Title Page Abstract Introduction Conclusions References Tables Figures ◭ ◮ ◭ ◮ Back Close
Full Screen / Esc
Printer-friendly Version
Interactive Discussion area). For an ideal Match sampling, the Match-sampled simulation of the ozone loss
rates (blue circles) should agree with the vortex average ozone loss rate (green line) as both are evaluated within the same simulation. The deviation of the CLaMS sampled Match (blue circles) from the CLaMS vortex average (green line) denotes the quantita-tive impact of all effects discussed above.
5
On the 450 K level in late December and January, the Match-sampled CLaMS ozone loss rates are significantly larger than the vortex average CLaMS ozone loss rate, indi-cating that Match may over-estimate the ozone loss rate here. On the 475 K level, the Match sampling seems ideal as here Match-sampled CLaMS ozone loss rates nearly agree with the vortex average CLaMS ozone loss rate. Contrary, on the 500 K level 10
the Match-sampled CLaMS ozone loss rates rather under-estimate the vortex average CLaMS ozone loss rate in January and February.
The impact of the sampling on integrated column ozone loss was estimated in the following way: Between 425 K and 500 K the ozone loss rate offset between CLaMS-sampled Match and CLaMS vortex average (see Fig.10) was evaluated. Below and 15
above these levels, the offset was not considered here. These ozone loss rate offsets were then integrated along eΘ lines as above. For 16 March this results in an apparent ozone loss increase of about 0.5 ppm at 425 K and a small decrease of apparent ozone depletion above 450 K. The dotted green line in Fig.6 shows the offset added to the estimate above (dashed green line, 43 DU). If evaluated as vertical column, it would be 20
16 DU additional apparent ozone loss between 400 K and 450 K and 2 DU less ozone loss between 450 K and 500 K, that is a total of 14 DU for the original Match evaluation. The CLaMS accumulated column ozone loss corrected for all effects mentioned above would be 57 DU. This is well within the published Match range (56±4 DU). For the reduced Match evaluation in which only sonde observations within the vortex edge 25
after Nash et al. (1996) were used, the 400 K to 500 K column offset would only be 10 DU.
There is still a discrepancy between Match ozone loss rates (red circles) and CLaMS sampled Match (blue symbols) which is most pronounced in early January on the 450 K
ACPD
7, 11725–11759, 2007Impact of across vortex edge mixing on Match ozone loss
estimates
J.-U. Grooß et al.
Title Page Abstract Introduction Conclusions References Tables Figures ◭ ◮ ◭ ◮ Back Close
Full Screen / Esc
Printer-friendly Version
Interactive Discussion level and still significant on the 475 K level. It may have a number of reasons, most
likely inaccuracies of the simulation, which may be attributed to ozone initialization, mixing parameterization, transport, chemistry, or model resolution. In principle it could also be due to measurement errors, but it seems unlikely to achieve a systematically lower ozone mixing ratio in the second ozone sonde of a match. This means that 5
the so-called “January ozone loss problem” (Becker et al., 2000;Rex et al., 2003) is still present here. However, these discrepancies do not contribute significantly to the estimated accumulated column ozone loss at the end of the vortex life time as explained above.
In a similar approach, Tripathi et al.(2007) also compared Match ozone loss rates 10
with high resolution CTM simulations for this Arctic winter, but only for the potential tem-perature levels 475 and 500 K. Their model ozone loss rates agree somewhat better with Match than the CLaMS simulation discussed here. This may be due to a correc-tion procedure in which the difference of model Opass3 for the Match sonde locations was subtracted. It is not completely clear, how this correction that was designed to cor-15
rect for model diffusivity would influence the different offsets that are discussed above. However, the largest Match-CLaMS differences is on the 450 K level, whereTripathi
et al. (2007) do not show a comparison. 5.6 Sensitivity to photochemical parameters
The deviations between ozone loss rates derived by Match and simulations were par-20
ticularly pronounced in cold Januaries (Becker et al., 1998, 2000; Rex et al., 2003). The reason for this was partly searched for in uncertain photochemical parameters. For exampleFrieler et al.(2006) suggested that a change in kinetics (Cl2O2 photoly-sis) and larger amounts of halogen source gases (20 pptv BrOx, 3.7 ppbv ClOx) may explain the ozone loss rates in cold Januaries. However, some of these assumptions 25
are on the extreme side of the range of parameter values that are currently believed to be realistic. The assumed BrOx is comparable to the CLaMS model that has a maxi-mum Bry of 21 pptv at 500 K. Because due to the low concentration of NOx, very few
ACPD
7, 11725–11759, 2007Impact of across vortex edge mixing on Match ozone loss
estimates
J.-U. Grooß et al.
Title Page Abstract Introduction Conclusions References Tables Figures ◭ ◮ ◭ ◮ Back Close
Full Screen / Esc
Printer-friendly Version
Interactive Discussion BrONO2 is formed and most BrOx is in the form of BrO during daytime. But the
as-sumed amount of active chlorine is about 50% above that in the CLaMS model and even above Cly. CLaMS Clyis initialized according to observed tracer/Cly correlations and is about 2.5 ppbv (3.0 ppbv) at the 450 K (500 K) level inside the vortex in early January. The used cross absorption sections for Cl2O2 are larger than currently rec-5
ommended values (Sander et al., 2006). Recent laboratory measurements of Pope
et al. (2007) who recommend even significantly lower absorption cross sections than recommended. However, these low absorption cross sections seem not to be consis-tent with ClO/ClOOCl observations and rate theory calculations (von Hobe et al.,2007) and this issue requires further research.
10
Figure11(top panel) shows results of sensitivity studies for the 450 K level in which some parameters were changed with respect to the reference simulation. The blue circles correspond to the reference simulation that is also plotted in Fig.10. A simula-tion in which the recommended Cl2O2absorption cross sections (Sander et al.,2006) were replaced with the larger ones byBurkholder et al.(1990) is shown as open violet 15
circles. To reach larger chlorine activation, one sensitivity simulation was performed in which a complete activation of the inorganic chlorine reservoirs artificially was gener-ated on 20 December. The results are shown as cyan symbols. For all these sensitivity studies, the average ozone difference with ozone sonde observations does not sig-nificantly differ from zero (see Fig.11, bottom panel). However, the 3.7 ppbv of ClOx 20
suggested byFrieler et al. (2006) can only be reached if the available chlorine Cly is increased by 50%. The results of this simulation are shown by the orange symbols, but in this case it is clear from the comparison of the simulated CLaMS ozone mixing ratios with sondes that the simulated ozone loss is over-estimated. Therefore the large Match ozone loss rates found on 2 January on the 450 K level cannot be explained by 25
any of the above listed causes. Only part of the discrepancy can be explained by this study. However, the amount of ozone that is chemically depleted during this dark pe-riod is not dominating the overall ozone loss. Thus, this remaining discrepancy causes no significant underestimation of accumulated ozone loss. Otherwise it must be visible
ACPD
7, 11725–11759, 2007Impact of across vortex edge mixing on Match ozone loss
estimates
J.-U. Grooß et al.
Title Page Abstract Introduction Conclusions References Tables Figures ◭ ◮ ◭ ◮ Back Close
Full Screen / Esc
Printer-friendly Version
Interactive Discussion in the comparison with the ozone observations.
6 Conclusions
A significant amount of mixing across the vortex edge occurred in Arctic winter 2002/03. This is evident both in observed tracer correlations and in the CLaMS simulations. The CLaMS simulation is able to reproduce the dynamics (mixing and advection) very well. 5
Even observed vortex remnants in June were correctly simulated. Also the magni-tude and geographical distribution of observed ozone mixing ratios can be correctly reproduced within ±0.2 ppmv by CLaMS with no obvious trend giving confidence in the simulated ozone loss. Therefore the CLaMS simulation is well suited to investigate the methods for determining ozone loss estimates. CLaMS generally shows smaller 10
ozone column loss than estimates from observations. We identified a number of poten-tial causes because of which Match may over-estimate ozone loss, mainly the mixing though the vortex edge and non-linear dependence between ozone loss and sunlight hours for high solar zenith angles. When deriving estimates of long-time ozone loss from ozone loss rates by an integration on constant eΘ surfaces, the derived accu-15
mulated column ozone loss includes also the air masses that have left the polar vortex and does not include the air masses transported into the vortex. For the winter 2002/03 the such determined column ozone loss between 400 and 500 K is 12 DU (39%) larger than the vortex average column ozone loss deduced from CLaMS.
Below 450 K springtime potential temperature where ozone outside the vortex is 20
lower than inside, a number of effects were identified that cause Match to derive larger ozone loss rates than the CLaMS vortex average. The sum these effects evaluated as column ozone loss is estimated to be 14 DU that is 44% of the CLaMS column ozone loss. Both offsets taken together, the time-integration of ozone loss and the determi-nation of ozone loss rates for Match can explain the difference between CLaMS and 25
Match springtime accumulated ozone loss.
However, some unexplained differences remain, most pronounced at 450 K in early 11742
ACPD
7, 11725–11759, 2007Impact of across vortex edge mixing on Match ozone loss
estimates
J.-U. Grooß et al.
Title Page Abstract Introduction Conclusions References Tables Figures ◭ ◮ ◭ ◮ Back Close
Full Screen / Esc
Printer-friendly Version
Interactive Discussion January 2003 (the so-called “January ozone loss problem”). The January ozone loss
does not significantly contribute to the accumulated ozone loss. These differences can be reduced, but not removed entirely by the kinetic assumptions ofFrieler et al.(2006). But the assumed active chlorine amount would yield too much accumulated ozone loss in the CLaMS simulation. We finally conclude that the effect of mixing across the 5
polar vortex edge is important and should not be neglected in the ozone loss estimates. Although there was likely more mixing in Arctic winter 2002/2003 than in a typical Arctic winter, the problems with the Match analysis described here will in principle be present in all Arctic winters. It is also possible that a similar reported difference between CLaMS and Match for the winter 2004/05 (Grooß and M ¨uller,2007;Rex et al.,2006) is due to 10
very similar reasons.
Acknowledgements. This work was initiated by the EU project QUOBI. The authors thank
M. Rex and M. Streibel for providing the Match data and for fruitful discussions. We thank all personnel responsible for the ozone sonde data at the different stations. We also thank all staff that made MIPAS-ENVISAT, HAGAR-Geophysica, and TRIPLE-Balloon observations possible.
15
Thanks are due to the CLaMS-team at FZJ for technical support and scientific discussions. We acknowledge the European Centre for Medium-Range Weather Forecasts (ECMWF) for pro-viding meteorological analyses. The simulations were performed on the J ¨ulich Multi Processor (JUMP) supported by the John von Neumann-Institut for Computing (NIC).
References 20
Becker, G., M ¨uller, R., McKenna, D. S., Rex, M., and Carslaw, K. S.: Ozone loss rates in the Arctic stratosphere in the winter 1991/92: Model calculations compared with Match results, Geophys. Res. Lett., 25, 4325–4328, 1998. 11738,11740
Becker, G., M ¨uller, R., McKenna, D. S., Rex, M., Carslaw, K. S., and Oelhaf, H.: Ozone loss rates in the Arctic stratosphere in the winter 1994/1995: Model simulations underestimate
25
results of the Match analysis, J. Geophys. Res., 105, 15 175–15 184, 2000.11727,11740
Burkholder, J. B., Orlando, J. J., and Howard, C. J.: Ultraviolet Absorption Cross Section of Cl2O2between 210 and 410 nm, J. Phys. Chem., 94, 687–695, 1990. 11741
ACPD
7, 11725–11759, 2007Impact of across vortex edge mixing on Match ozone loss
estimates
J.-U. Grooß et al.
Title Page Abstract Introduction Conclusions References Tables Figures ◭ ◮ ◭ ◮ Back Close
Full Screen / Esc
Printer-friendly Version
Interactive Discussion Chipperfield, M. P., Feng, W., and Rex, M.: Arctic ozone loss and climate sensitivity:
Updated three-dimensional model study, Geophys. Res. Lett., 32, L11813, doi:10.1029/ 2005GL022674, 2005.11727
Christensen, T., Knudsen, B. M., Streibel, M., Anderson, S. B., Benesova, A., Braathen, G., Davies, J., De Backer, H., Dier, H., Dorokhov, V., Gerding, M., Gil, M., Henchoz, B., Kelder,
5
H., Kivi, R., Kyr ¨o, E., Litynska, Moore, D., Peters, G., Skrivankova, P., St ¨ubi, R., Turunen, T., Vaughan, G., Viatte, P., Vik, A. F., von der Gathen, P., and Zaitcev, I.: Vortex-averaged Arctic ozone depletion in the winter 2002/2003, Atmos. Chem. Phys., 5, 131–138, 2005,
http://www.atmos-chem-phys.net/5/131/2005/. 11733,11734
Douglass, A. R., Stolarski, R. S., Strahan, S. E., and Polansky, B. C.: Sensitivity of Arctic ozone
10
loss to polar stratospheric cloud volume and chlorine and bromine loading in a chemistry and transport model, Geophys. Res. Lett., 33, L17809, doi:10.1029/2006GL026492, 2006.
11727
Frieler, K., Rex, M., Salawitch, R. J., Canty, T., Streibel, M., Stimpfle, R. M., Pfeilsticker, K., Dorf, M., Weisenstein, D. K., and Godin-Beekmann, S.: Toward a better quantitative
15
understanding of polar stratospheric ozone loss, Geophys. Res. Lett., 33, L10812, doi: 10.1029/2005GL025466, 2006. 11727,11740,11741,11743
Goutail, F., Pommereau, J.-P., Lef `evre, F., Roozendael, M. V., Andersen, S. B., K ˚astad-Høiskar, B.-A., Dorokhov, V., Kyr ¨o, E., Chipperfield, M. P., and Feng, W.: Early unusual ozone loss during the Arctic winter 2002/2003 compared to other winters, Atmos. Chem. Phys., 5, 665–
20
677, 2005,
http://www.atmos-chem-phys.net/5/665/2005/. 11748
Grooß, J.-U. and M ¨uller, R.: The impact of mid-latitude intrusions into the polar vortex on ozone loss estimates, Atmos. Chem. Phys., 3, 395–402, 2003,
http://www.atmos-chem-phys.net/3/395/2003/. 11728,11736
25
Grooß, J.-U. and M ¨uller, R.: Simulation of ozone loss in Arctic winter 2004/2005, Geophys. Res. Lett., 34, L05804, doi:10.1029/2006GL028901, 2007. 11743
Grooß, J.-U. and Russell, J. M.: Technical note: A stratospheric climatology for O3, H2O, CH4,
NOx, HCl and HF derived from HALOE measurements, Atmos. Chem. Phys., 5, 2797–2807,
2005,
30
http://www.atmos-chem-phys.net/5/2797/2005/. 11730
Grooß, J.-U., G ¨unther, G., M ¨uller, R., Konopka, P., Bausch, S., Schlager, H., Voigt, C., Volk, C. M., and Toon, G. C.: Simulation of denitrification and ozone loss for the Arctic winter
ACPD
7, 11725–11759, 2007Impact of across vortex edge mixing on Match ozone loss
estimates
J.-U. Grooß et al.
Title Page Abstract Introduction Conclusions References Tables Figures ◭ ◮ ◭ ◮ Back Close
Full Screen / Esc
Printer-friendly Version
Interactive Discussion 2002/2003, Atmos. Chem. Phys., 5, 1437–1448, 2005,
http://www.atmos-chem-phys.net/5/1437/2005/. 11727,11729,11732
Harris, N. R. P., Rex, M., Goutail, F., Knudsen, B. M., Manney, G. L., M ¨uller, R., and von der Ga-then, P.: Comparison of empirically derived ozone loss rates in the Arctic vortex, J. Geophys. Res., 107, 8264, doi:10.1029/2001JD000482, 2002. 11727
5
Konopka, P., Steinhorst, H.-M., Grooß, J.-U., G ¨unther, G., M ¨uller, R., Elkins, J. W., Jost, H.-J., Richard, E., Schmidt, U., Toon, G., and McKenna, D. S.: Mixing and Ozone Loss in the 1999-2000 Arctic Vortex: Simulations with the 3-dimensional Chemical Lagrangian Model of the Stratosphere (CLaMS), J. Geophys. Res., 109, D02315, doi:10.1029/2003JD003792, 2004.
11729
10
Lait, L. R.: An alternative form for potential vorticity, J. Atmos. Sci., 51, 1754–1759, 1994.
11732
McKenna, D. S., Konopka, P., Grooß, J.-U., G ¨unther, G., M ¨uller, R., Spang, R., Offermann, D., and Orsolini, Y.: A new Chemical Lagrangian Model of the Stratosphere (CLaMS): 1. Formu-lation of advection and mixing, J. Geophys. Res., 107, 4309, doi:10.1029/2000JD000114,
15
2002a.11729
McKenna, D. S., Grooß, J.-U., G ¨unther, G., Konopka, P., M ¨uller, R., Carver, G., and Sasano, Y.: A new Chemical Lagrangian Model of the Stratosphere (CLaMS): 2. Formulation of chemistry scheme and initialization, J. Geophys. Res., 107, 4256, doi:10.1029/2000JD000113, 2002b.
11729
20
M ¨obius, T.: Untersuchungen zu Unterschieden in Tracer-Tracer Korrelationen innerhalb und außerhalb des arktischen Polarwirbels, Diploma Thesis, University of Frankfurt, 2006.11731
Morcrette, J.-J.: Radiation and Cloud Radiative Properties in the European Centre for Medium-Range Weather Forecasts Forecasting System, J. Geophys. Res., 96, 9121–9132, 1991.
11735
25
M ¨uller, R., Schmidt, U., Engel, A., McKenna, D. S., and Proffitt, M. H.: The O3/N2O relationship
from balloon-borne observations as a measure of Arctic ozone loss in 1991–1992, Q. J. Roy. Meteor. Soc., 127, 1389–1412, 2001. 11729
M ¨uller, R., Tilmes, S., Konopka, P., Grooß, J.-U., and Jost, H.-J.: Impact of mixing and chemical change on ozone-tracer relations in the polar vortex, Atmos. Chem. Phys., 5, 3139–3151,
30
2005,
http://www.atmos-chem-phys.net/5/3139/2005/. 11734
Nash, E. R., Newman, P. A., Rosenfield, J. E., and Schoeberl, M. R.: An objective determination 11745
ACPD
7, 11725–11759, 2007Impact of across vortex edge mixing on Match ozone loss
estimates
J.-U. Grooß et al.
Title Page Abstract Introduction Conclusions References Tables Figures ◭ ◮ ◭ ◮ Back Close
Full Screen / Esc
Printer-friendly Version
Interactive Discussion of the polar vortex using Ertel’s potential vorticity, J. Geophys. Res., 101, 9471–9478, 1996.
11730,11732,11733,11737,11739,11755
Naujokat, B. and Grunow, K.: The stratospheric arctic winter 2002/03: Balloon flight planning by trajectory calculation., in: Proceedings of the 16th ESA Symposium on European Rocket and Balloon Programmes and Related Research, ESA SP-530, pp.421–425, St. Gallen,
5
2003. 11732
Pope, F. D., Hansen, J. C., Bayes, K. D., Friedl, R. R., and Sander, S. P.: Ultraviolet Absorption Spectrum of Chlorine Peroxide, ClOOCl, J. Phys. Chem. A, 20, 4322–4332, doi:10.1021/ jp067660w, 2007. 11741
Ray, E. A., Moore, F. L., Elkins, J. W., Hurst, D. F., Romashkin, P. A., Dutton, G. S., and Fahey,
10
D. W.: Descent and mixing in the 1999–2000 northern polar vortex inferred from in situ tracer measurements, J. Geophys. Res., 107, 8285, doi:10.1029/2001JD000961, 2002. 11729
Rex, M., Salawitch, R. J., Santee, M. L., Waters, J. W., Hoppel, K., and Bevilacqua, R.: On the unexplained stratospheric ozone losses during cold Arctic Januaries, Geophys. Res. Lett., 30, 1010, doi:10.1029/2002GL016008, 2003.11740
15
Rex, M., Salawitch, R. J., von der Gathen, P., Harris, N. R. P., Chipperfield, M. P., and Naujokat, B.: Arctic ozone loss and climate change, Geophys. Res. Lett., 31, L04116, doi:10.1029/ 2003GL018844, 2004.11735
Rex, M., Salawitch, R. J., Deckelmann, H., von der Gathen, P., Harris, N. R. P., Chipperfield, M. P., Naujokat, B., Reimer, E., Allaart, M., Andersen, S. B., Bevilacqua, R., Braathen, G.
20
O., Claude, H., Davies, J., De Backer, H., Dier, H., Dorokov, V., Fast, H., Gerding, M., Godin-Beekmann, S., Hoppel, K., Johnson, B., Kyr ¨o, E., Litynska, Z., Moore, D., Nakane, H., Parrondo, M. C., Risley Jr., A. D., Skrivankova, P., St ¨ubi, R., Viatte, P., Yushkov, V., and Zerefos, C.: Arctic winter 2005: Implications for stratospheric ozone loss and climate change, Geophys. Res. Lett., 33, L23808, doi:10.1029/2006GL026731, 2006.11743
25
Sander, S. P., Friedl, R. R., Golden, D. M., Kurylo, M. J., Moortgat, G. K., Keller-Rudek, H., Wine, P. H., Ravishankara, A. R., Kolb, C. E., Molina, M. J., Finlayson-Pitts, B. J., Huie, R. E., and Orkin, V. L.: Chemical kinetics and photochemical data for use in atmospheric studies, JPL Publication 06-2, 2006. 11741
Schmidt, U., Kulessa, G., Klein, E., R ¨oth, E.-P., Fabian, P., and Borchers, R.: Intercomparison
30
of balloon-borne cryogenic whole air samplers during the MAP/GLOBUS 1983 campaign, Planet. Space Sci., 35, 647–656, 1987. 11731
Stefanutti, L., McKenzie, A. R., Santacesaria, V., Adriani, A., Balestri, S., Borrmann, S., Khat-11746
ACPD
7, 11725–11759, 2007Impact of across vortex edge mixing on Match ozone loss
estimates
J.-U. Grooß et al.
Title Page Abstract Introduction Conclusions References Tables Figures ◭ ◮ ◭ ◮ Back Close
Full Screen / Esc
Printer-friendly Version
Interactive Discussion tatov, V., Mazzinghi, P., Mitev, V., Rudakov, V., Schiller, C., Toci, G., Volk, C. M., Yushkov,
V., Flentje, H., Kiemle, C., Redaelli, G., Carslaw, K. S., Noone, K., and Peter, T.: The APE-THESEO Tropical Campaign: An Overview, J. Atmos. Chem., 48, 1–33, 2004. 11730
Steinhorst, H.-M., Konopka, P., G ¨unther, G., and M ¨uller, R.: How permeable is the edge of the Arctic vortex – Model studies of the winter 1999–2000, J. Geophys. Res., 110, D06105,
5
doi:10.1029/2004JD005268, 2005.11732
Streibel, M., Rex, M., von der Gathen, P., Lehmann, R., Harris, N. R. P., Braathen, G. O., Reimer, E., Deckelmann, H., Chipperfield, M., Millard, G., Allaart, M., Andersen, S. B., Claude, H., Davies, J., De Backer, H., Dier, H., Dorokov, V., Fast, H., Gerding, M., Kyr ¨o, E., Litynska, Z., Moore, D., Moran, E., Nagai, T., Nakane, H., Parrondo, C., Skrivankova, P.,
10
St ¨ubi, R., Vaughan, G., Viatte, P., and Yushkov, V.: Chemical ozone loss in the Arctic winter 2002/2003 determined with Match, Atmos. Chem. Phys., 6, 2783–2792, 2006,
http://www.atmos-chem-phys.net/6/2783/2006/. 11727,11734,11735,11737,11753
Tilmes, S., M ¨uller, R., Grooß, J.-U., H ¨opfner, M., Toon, G. C., and Russell, J. M.: Very early chlorine activation and ozone loss in the Arctic winter 2002–2003, Geophys. Res. Lett., 30,
15
2201, doi:10.1029/2003GL018079, 2003.11734
Tripathi, O. P., Godin-Beekmann, S., Lev `evre, F., Pazmino, A., Hauchecorne, A., Chipperfield, M., Feng, W., Millard, G., Rex, M., Streibel, M., and von der Gathen, P.: Comparison of polar ozone loss rates simulated by 1-D and 3-D models with Match observations in recent Antarctic and Arctic winters, J. Geophys. Res., 112, D12308, doi:10.1029/2006JD008370,
20
2007. 11740
Vogel, B., Feng, W., Streibel, M., and M ¨uller, R.: The potential impact of ClOxradical complexes
on polar stratospheric ozone loss processes, Atmos. Chem. Phys., 6, 3099–3114, 2006,
http://www.atmos-chem-phys.net/6/3099/2006/. 11727,11738
von Hobe, M., Salawitch, R. J., Canty, T., Keller-Rudek, H., Moortgat, G. K., Grooß, J.-U.,
25
M ¨uller, R., and Stroh, F.: Understanding the kinetics of the ClO dimer cycle, Atmos. Chem. Phys., 7, 3055–3069, 2007,
http://www.atmos-chem-phys.net/7/3055/2007/. 11741
WMO: Scientific assessment of ozone depletion: 2006, Global Ozone Research and Monitoring Project-Report No. 50, Geneva, Switzerland, 2007.11727
30
ACPD
7, 11725–11759, 2007Impact of across vortex edge mixing on Match ozone loss
estimates
J.-U. Grooß et al.
Title Page Abstract Introduction Conclusions References Tables Figures ◭ ◮ ◭ ◮ Back Close
Full Screen / Esc
Printer-friendly Version
Interactive Discussion
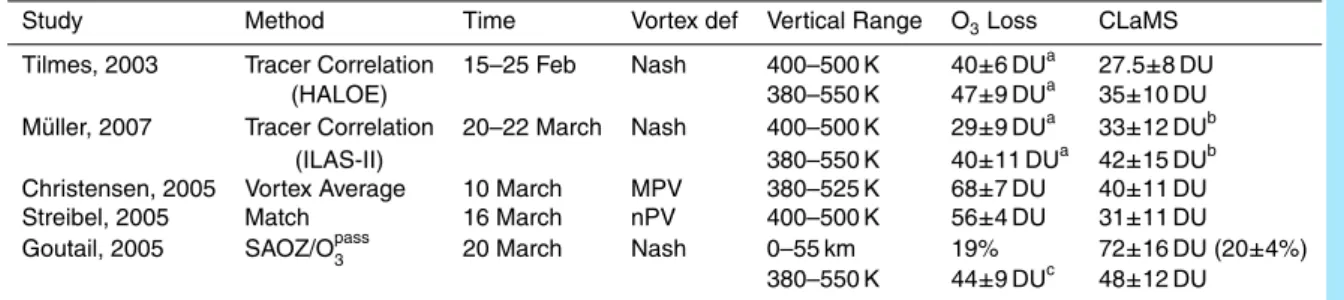
Table 1. Comparison of other published column ozone loss estimates for the Arctic winter
2002/2003 with the presented CLaMS simulation. For details we refer to the individual studies. The CLaMS results are the average ozone loss for the corresponding time, vortex definition and vertical range ±1σ variability within this range.
Study Method Time Vortex def Vertical Range O3Loss CLaMS
Tilmes, 2003 Tracer Correlation 15–25 Feb Nash 400–500 K 40±6 DUa 27.5±8 DU
(HALOE) 380–550 K 47±9 DUa 35±10 DU
M ¨uller, 2007 Tracer Correlation 20–22 March Nash 400–500 K 29±9 DUa 33±12 DUb
(ILAS-II) 380–550 K 40±11 DUa 42±15 DUb
Christensen, 2005 Vortex Average 10 March MPV 380–525 K 68±7 DU 40±11 DU
Streibel, 2005 Match 16 March nPV 400–500 K 56±4 DU 31±11 DU
Goutail, 2005 SAOZ/Opass3 20 March Nash 0–55 km 19% 72±16 DU (20±4%)
380–550 K 44±9 DUc 48±12 DU
a
Estimated for outer vortex and vortex core are combined using relative areas (i.e. 17% and 83% on 15–25 Feb ).
b
Average for 20–22 March. Due to rapid changing vortex edge this is 15% lower than the single value for 20 March.
c
Estimated from the statement that 23 DU loss for the partial column 380–550 K correspond to a loss of 10% in column ozone, see Sect. 4 ofGoutail et al.(2005).
ACPD
7, 11725–11759, 2007Impact of across vortex edge mixing on Match ozone loss
estimates
J.-U. Grooß et al.
Title Page Abstract Introduction Conclusions References Tables Figures ◭ ◮ ◭ ◮ Back Close
Full Screen / Esc
Printer-friendly Version Interactive Discussion 0 50 100 150 200 250 300 N2 O [ppbv] HAGAR CLaMS 14:00 15:00 16:00 17:00 time [UTC] 300 350 400 450 500 Pot. Temperature [K] 40 50 60 70 80 90
Eq. Lat. [deg N]
Pot. Temp Eq. Lat. Edge (Nash) 0.6 0.8 1.0 1.2 1.4 1.6 1.8 CH4 [ppmv] 0 50 100 150 200 250 CFC−11 [pptv] Day : 19.01.2003 0 10 20 30 40 50 60 70 80 90 100 Vortex air [%] HAGAR CLaMS
Fig. 1. N2O time series (left top) and CH4/CFC-11 correlations (right) calculated with CLaMS
versus HAGAR observations for 19 January 2003. The color indicates the simulated vortex fraction. Furthermore, the potential temperature, equivalent latitude and the equivalent latitude of the vortex edge are plotted along the flight track (left bottom).
ACPD
7, 11725–11759, 2007Impact of across vortex edge mixing on Match ozone loss
estimates
J.-U. Grooß et al.
Title Page Abstract Introduction Conclusions References Tables Figures ◭ ◮ ◭ ◮ Back Close
Full Screen / Esc
Printer-friendly Version Interactive Discussion 0.5 1.0 1.5 2.0 CH4 [ppmv] 0 50 100 150 200 250 F11 [pptv]
Day : 09.06.2003
5.0 7.5 10.0 12.5 15.0 17.5 20.0 22.5 25.0 27.5 30.0 Vortex air [%] Ballon CLaMS−3dFig. 2.CH4/CFC-11 correlation colored with the CLaMS vortex tracer observed on 9 June 2003
(crosses) and the corresponding simulation (filled circles). A clear signature of air masses with about 30% vortex air indicates vortex remnants in the range between 500 and 600 K.
ACPD
7, 11725–11759, 2007Impact of across vortex edge mixing on Match ozone loss
estimates
J.-U. Grooß et al.
Title Page Abstract Introduction Conclusions References Tables Figures ◭ ◮ ◭ ◮ Back Close
Full Screen / Esc
Printer-friendly Version
Interactive Discussion
O
3: CLaMS (E09_d47r3) − SONDE
01.12.02 01.01.03 01.02.03 01.03.03 −1.0 −0.5 0.0 0.5 1.0 O3 difference [ppmv] 65o<Φ e< 90 o 400K 450K 500K
Fig. 3. Average ozone difference between ozone sonde observations and co-lcated CLaMS
simulation inside the vortex (Φe >65◦). The comparison is based on 294 ozone sonde obser-vations. The error bars correspond to the standard deviation within a 4-day period.
ACPD
7, 11725–11759, 2007Impact of across vortex edge mixing on Match ozone loss
estimates
J.-U. Grooß et al.
Title Page Abstract Introduction Conclusions References Tables Figures ◭ ◮ ◭ ◮ Back Close
Full Screen / Esc
Printer-friendly Version Interactive Discussion 400 600 800 1000 1200 Potential Temperature [K] 400 600 800 1000 1200 Potential Temperature [K] 01.01.03 01.03.03 01.05.03 0 10 20 30 40 50 60 70 80 90 100 Vortex Air (%) mW1 MW mW2 mW3 FW Vortex Air=50% Φe>70 o Φe>65 o Φe>75 o
Fig. 4. Mean vortex dilution in winter 2002/03 derived from the CLaMS vortex tracer averaged
every day over all air parcels with equivalent latitude>70◦N. The black contours (solid, dashed
and dotted) are the 50% isolines of the mean vortex tracer calculated for air parcels with equiv-alent latitude>70, 65 and 75◦N, respectively. Thus, the black line separates approximately the
well-isolated vortex from the mid-latitude air. Dates of the minor (mW) major (MW) and final (FW) warmings are marked by thick black bars on the top of the figure.
ACPD
7, 11725–11759, 2007Impact of across vortex edge mixing on Match ozone loss
estimates
J.-U. Grooß et al.
Title Page Abstract Introduction Conclusions References Tables Figures ◭ ◮ ◭ ◮ Back Close
Full Screen / Esc
Printer-friendly Version Interactive Discussion 350 400 450 500 550 600 650 700 Potential Temperature [K] CLaMS 2002/03: dO3/dt, NPV > 36 CLaMS 2002/03: dO3/dt, NPV > 36 350 400 450 500 550 600 650 700 Potential Temperature [K]
Dec 1 Jan 1 Feb 1 Mar 1 −50.
−40. −30. −25. −20. −15. −10. −5. −2. −0. [ppb/day]
Dec 1 Jan 1 Feb 1 Mar 1
Fig. 5. Simulated vortex average ozone loss rates, time versus theta; The white lines
corre-spond to the average vortex descent (constant eΘ) Shown are vortex averages (poleward of the contour nPV=36, compareStreibel et al.,2006).
ACPD
7, 11725–11759, 2007Impact of across vortex edge mixing on Match ozone loss
estimates
J.-U. Grooß et al.
Title Page Abstract Introduction Conclusions References Tables Figures ◭ ◮ ◭ ◮ Back Close
Full Screen / Esc
Printer-friendly Version Interactive Discussion
CLaMS
∆
O
3comparison 16.03.2003
0.0 0.5 1.0 1.5 2.0 Accumulated O3 loss [ppm] 350 400 450 500 550 Potential Temperature [K] CLaMS (±1σ), npv > 36 CLaMS along eΘ MIPAS/CLaMS O3 pass Matchestim. all sampling effects
Fig. 6. Vortex average accumulated ozone loss on 16 March versus potential temperature
for different methods, solid lines correspond to CLaMS results, dashed to ozone loss rates integrated along eΘ surfaces. Also other ozone loss estimates are included: from the Match campaign as red symbols from MIPAS data and CLaMS passive ozone as blue symbols. The dotted line is an estimate that includes the sampling effects as discussed in the text.
ACPD
7, 11725–11759, 2007Impact of across vortex edge mixing on Match ozone loss
estimates
J.-U. Grooß et al.
Title Page Abstract Introduction Conclusions References Tables Figures ◭ ◮ ◭ ◮ Back Close
Full Screen / Esc
Printer-friendly Version
Interactive Discussion
50 60 70 80
Equivalent latitude [degrees] 400 450 500 550 600 Potential Temperature [K] CLaMS: O3, 02.01.2003 CLaMS: O3, 02.01.2003 50 60 70 80
Equivalent latitude [degrees] 400 450 500 550 600 Potential Temperature [K] 0.50 1.00 1.50 2.00 2.50 3.00 3.50 4.00 4.50 5.00 5.50 [ppmv] Vortex edge (Nash) NPV=36
Fig. 7. Simulated ozone mixing ratio on 2 January averaged over equivalent latitude and
po-tential temperature bins. The black line corresponds to the vortex edge afterNash et al.(1996) and the pink line corresponds to nPV=36.
ACPD
7, 11725–11759, 2007Impact of across vortex edge mixing on Match ozone loss
estimates
J.-U. Grooß et al.
Title Page Abstract Introduction Conclusions References Tables Figures ◭ ◮ ◭ ◮ Back Close
Full Screen / Esc
Printer-friendly Version Interactive Discussion
O
3/
θ
=450K / 16.01.2003 9:00
1.0
1.2
1.4
1.6
1.8
2.0
2.2
2.4
2.6
2.8
3.0
[ppmv]
1.0
1.2
1.4
1.6
1.8
2.0
2.2
2.4
2.6
2.8
3.0
[ppmv]
Match Trajectory jo030116.q08 Sonde Position Vortex edge (Nash)Vortex edge (NPV)
Match Number: 71838 Match Radius: 382km
Fig. 8. Example Match for which the second sonde observations is outside the vortex. The
color indicates the simulated ozone mixing ratio at θ=450 K for the section over Scandinavia. The red star corresponds to the location of the Match trajectory. The circle color indicates the observed ozone mixing ratio at this level.
ACPD
7, 11725–11759, 2007Impact of across vortex edge mixing on Match ozone loss
estimates
J.-U. Grooß et al.
Title Page Abstract Introduction Conclusions References Tables Figures ◭ ◮ ◭ ◮ Back Close
Full Screen / Esc
Printer-friendly Version
Interactive Discussion
Vortex (npv), 03.01.2003,
θ
=450K
0 2 4 6 8 10
Sunlight hours (SZA < 95o)
−40 −30 −20 −10 0 Ozone change [ppb]
Vortex Average Loss Rates
−1.11± 0.92 ppb/slh (CLaMS)
−1.44± 0.02 ppb/slh (lin. fit)
Fig. 9. Ozone change vs. sunlight hours for 3455 equally distributed vortex CLaMS air parcels
at θ=450±10 K for 1 day (3–4 January). The red line shows the linear fit to the CLaMS results. The black dashed line shows the average ozone change for each sunlight hour interval. The corresponding vortex average ozone loss rates are indicated in the legend.