www.clim-past.net/13/1/2017/ doi:10.5194/cp-13-1-2017
© Author(s) 2017. CC Attribution 3.0 License.
Spring temperature variability over Turkey since 1800 CE
reconstructed from a broad network of tree-ring data
Nesibe Köse1, H. Tuncay Güner1, Grant L. Harley2, and Joel Guiot31Faculty of Forestry, Forest Botany Department, Istanbul University, 34473 Bahçeköy-Istanbul, Turkey
2Department of Geography and Geology, University of Southern Mississippi, Hattiesburg, Mississippi 39406, USA 3Aix-Marseille Université, CNRS, IRD, CEREGE UM34, ECCOREV, 13545 Aix-en-Provence, France
Correspondence to:Nesibe Köse ([email protected])
Received: 25 December 2015 – Published in Clim. Past Discuss.: 11 April 2016
Revised: 12 December 2016 – Accepted: 12 December 2016 – Published: 4 January 2017
Abstract. The meteorological observational period in Turkey, which starts ca. 1930 CE, is too short for understand-ing long-term climatic variability. Tree runderstand-ings have been used intensively as proxy records to understand summer precip-itation history of the region, primarily because they have a dominant precipitation signal. Yet, the historical context of temperature variability is unclear. Here, we used higher-order principle components of a network of 23 tree-ring chronolo-gies to provide a high-resolution spring (March–April) tem-perature reconstruction over Turkey during the period 1800– 2002. The reconstruction model accounted for 67 % (Adj. R2=0.64, p < 0.0001) of the instrumental temperature vari-ance over the full calibration period (1930–2002). The re-construction is punctuated by a temperature increase during the 20th century; yet extreme cold and warm events dur-ing the 19th century seem to eclipse conditions durdur-ing the 20th century. We found significant correlations between our March–April spring temperature reconstruction and existing gridded spring temperature reconstructions for Europe over Turkey and southeastern Europe. Moreover, the precipitation signal obtained from the tree-ring network (first principle component) showed highly significant correlations with grid-ded summer drought index reconstruction over Turkey and Mediterranean countries. Our results showed that, beside the dominant precipitation signal, a temperature signal can be extracted from tree-ring series and they can be useful proxies in reconstructing past temperature variability.
1 Introduction
Long-term meteorological observations in the Mediterranean region allow access to 100 years of instrumental recordings of temperature, precipitation and pressure in most of the re-gion. Moreover, natural archives as well as documentary in-formation provide resources with which to make sensitive climate reconstructions (Luterbacher et al., 2012). An exten-sive body of literature details climate changes in the Mediter-ranean region over the last two millennia (Luterbacher et al., 2012). Paleolimnological studies provide evidence that the Medieval Climatic Anomaly (MCA; 900–1300 CE) charac-terized warm and dry conditions over the Iberian Peninsula, while the Little Ice Age (LIA; 1300–1850 CE) brought op-posite climate conditions, forced by interactions between the East Atlantic and North Atlantic Oscillation (NAO; Sanchez-Lopez et al., 2016). In addition, Roberts et al. (2012) high-lighted an intriguing spatial dipole NAO pattern between the western and eastern Mediterranean region, which brought an-tiphased warm (cool) and wet (dry) conditions during the MCA and LIA. The hydro-climate patterns revealed by pre-vious investigations appear to have been forced not only by NAO but other climate modes with nonstationary teleconnec-tions across the region (Roberts et al., 2012).
The climate of Turkey is mainly characterized by a Mediterranean macroclimate (Türke¸s, 1996a). Contrary to most countries in the Mediterranean region, Turkey has rela-tively short meteorological records, which start in the 1930s, for understanding long-term climatic variability. On the other hand, proxy records such as speleothems (Fleitmann et al., 2009; Jex et al., 2010; Göktürk et al., 2010), lake sediments
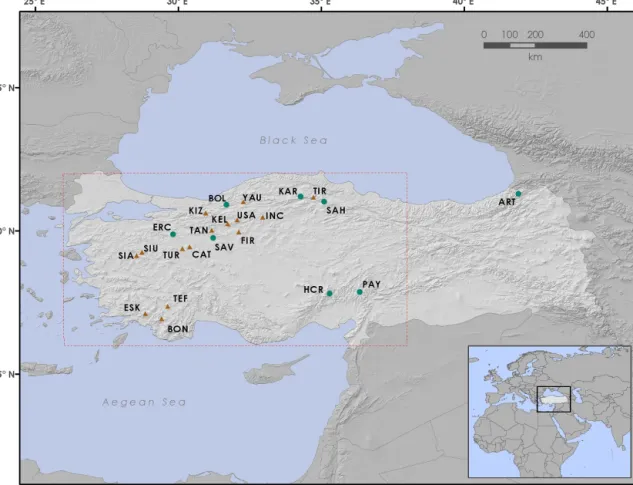
Figure 1.Tree-ring chronology sites in Turkey used to reconstruct temperature. Circles represent the new sampling efforts from this study and the triangles represent previously published chronologies (YAU, SIA and SIU in Mutlu et al., 2011. TIR in Akkemik et al., 2008. TAN in Köse et al., 2013. KIZ, ESK, TEF, BON, KEL, USA, FIR and TUR in Köse et al., 2011. CAT and INC in Köse et al., 2005). The box (dashed line) represents the area for which the temperature reconstruction was performed.
(Wick et al., 2003; Jones et al., 2006; Roberts et al., 2008, 2012; Kuzucuo˘glu et al., 2011; Woodbridge and Roberts, 2011; Ülgen et al., 2012; Dean et al., 2013) and tree rings, have been used to reconstruct long-term hydroclimate condi-tions over Turkey. Tree rings in particular have shown to pro-vide useful information about the past climate of Turkey and were used intensively during the last decade to reconstruct precipitation in the Aegean (Griggs et al., 2007), Black Sea (Akkemik et al., 2005, 2008; Martin-Benitto et al., 2016), Mediterranean regions (Touchan et al., 2005a), as well as the Sivas (D’Arrigo and Cullen, 2001), southwestern (Touchan et al., 2003, 2007; Köse et al., 2013), south-central (Akkemik and Aras, 2005) and western Anatolian (Köse et al., 2011) regions of Turkey. These studies used tree rings to recon-struct precipitation because available moisture is often found to be the most important limiting factor that influences ra-dial growth of many tree species in Turkey. These stud-ies revealed past spring–summer precipitation, and described past dry and wet events and their duration. Recently, Cook et al. (2015) presented Old World Drought Atlas (OWDA), which is a set of year-by-year maps of reconstructed Palmer
Drought Severity Index from tree-ring chronologies over the Europe and Mediterranean Basin.
Besides detailed information on precipitation history rep-resented by these paleoscientific studies, we still have very limited knowledge on past temperature variability of Turkey. For example, significant decreases in spring diurnal temper-ature ranges (DTRs) occurred throughout Turkey from 1929 to 1999 (Turkes and Sumer, 2004). This decrease in spring DTRs was characterized by daytime temperatures that re-mained relatively constant while a significant increase in nighttime temperatures were recorded over western Turkey and were concentrated around urbanized and rapidly urban-izing cities. The historical context of this gradual warming trend in spring temperatures is unclear. Heinrich et al. (2013) provided a winter-to-spring temperature proxy for Turkey from carbon isotopes within the growth rings of Juniperus excelsaM. Bieb. since 1125 CE. Low-frequency temperature trends corresponding to the end of the MCA and the LIA were identified in the record, but the proxy failed to iden-tify the recent warming trend during the 20th century. In this study, we present a tree-ring-based spring temperature
recon-struction from Turkey and compare our results to previous reconstructions of temperature and precipitation to provide a more comprehensive understanding of climate conditions during the 19th and 20th centuries.
2 Data and methods 2.1 Climate of the study area
The study area, which spans 36–42◦N and 26–38◦E, was based on the distribution of available tree-ring chronologies. This vast area covers much of western Anatolia and includes the western Black Sea, Marmara and western Mediterranean regions. Much of this area is characterized by a Mediter-ranean climate that is primarily controlled by polar and trop-ical air masses (Türke¸s, 1996a; Deniz et al., 2011). In win-ter, polar fronts from the Balkan Peninsula bring cold air that is centered in the Mediterranean. Conversely, the dry, warm conditions in summer are dominated by weak frontal systems and maritime effects. Moreover, the Azores high-pressure system in summer and anticyclonic activity from the Siberian high-pressure system often cause below normal precipitation and dry subhumid conditions over the region (Türke¸s, 1999; Deniz et al., 2011). In this Mediterranean cli-mate, annual mean temperature and precipitation range from 3.6 to 20.1◦C and from 295 to 2220 mm, respectively, both of which are strongly controlled by elevation (Deniz et al., 2011).
2.2 Development of tree-ring chronologies
To investigate past temperature conditions, we used a network of 23 tree-ring site chronologies (Fig. 1). Fif-teen chronologies were produced by previous investigations (Mutlu et al., 2011; Akkemik et al., 2008; Köse et al., 2005, 2011, 2013) that focused on reconstructing precipitation in the study area. In addition, we sampled eight new study sites and developed tree-ring time series for these areas (Table 1). Increment cores were taken from living Pinus nigra Arnold and Pinus sylvestris L. trees and cross-sections were taken from Abies nordmanniana (Steven) Spach and Picea orien-talis(L.) Link trunks.
Samples were processed using standard dendrochrono-logical techniques (Stokes and Smiley, 1968; Orvis and Grissino-Mayer, 2002; Speer, 2010). Tree-ring widths were measured, then visually cross-dated using the list method (Yamaguchi, 1991). We used the computer program COFECHA, which uses segmented time-series correlation techniques, to statistically confirm our visual cross-dating (Holmes, 1983; Grissino-Mayer, 2001). Cross-dated tree-ring time series were then standardized by fitting a 67 % cu-bic smoothing spline with a 50 % cutoff frequency to remove non-climatic trends related to the age, size and the effects of stand dynamics using the ARSTAN program (Cook, 1985; Cook et al., 1990a). These detrended series were then
pre-whitened with low-order autoregressive models to produce time series with a strong common signal and without biolog-ical persistence. These series may be more suitable to under-stand the effect of climate on tree growth, even if any per-sistence due to climate might be removed by pre-whitening. For each chronology, the individual series were averaged to a single chronology by computing the biweight robust means to reduce the influences of outliers (Cook et al., 1990b). In this research we used residual chronologies obtained from ARSTAN to reconstruct temperature.
The mean sensitivity, which is a metric representing the year-to-year variation in ring width (Fritts, 1976), was cal-culated for each chronology and compared. The minimum sample depth for each chronology was determined accord-ing to expressed population signal (EPS), which we used as a guide for assessing the likely loss of reconstruction accu-racy. Although arbitrary, we required the commonly consid-ered threshold of EPS > 0.85 (Wigley et al., 1984; Briffa and Jones, 1990).
2.3 Identifying relationships between tree-ring width and climate
We extracted high-resolution monthly temperature and pre-cipitation records from the climate dataset CRU TS 3.23 gridded at 0.5◦ intervals (Jones and Harris, 2008) from KNMI Climate Explorer (http://climexp.knmi.nl) for 36– 42◦N, 26–38◦E. The period 1930–2002 CE was chosen for the analysis because it maximized the number of station records within the study area.
First, the climate–growth relationships were investigated with response function analysis (RFA; Fritts, 1976) for bio-logical year from the previous October to current October us-ing the DENDROCLIM2002 program (Biondi and Waikul, 2004). This analysis is done to determine the months dur-ing which the tree growth is the most responsive to tem-perature. RFA results showed that precipitation from May to August and temperature in March and April have domi-nant control on tree-ring formation in the area. Second, we produced correlation maps showing correlation coefficients between tree-ring chronologies and the climate factors most important for tree growth, which are May–August precipita-tion and March–April temperature, to find the spatial struc-ture of radial growth–climate relationship (St. George, 2014; St. George and Ault, 2014; Hellmann et al., 2016). For each site we used the closest gridded temperature and precipita-tion values.
2.4 Temperature reconstruction
The climate reconstruction is performed by regression based on the principal components (PCs) of the 23 chronologies within the study area. Principle component analysis (PCA) was done over the entire period in common with the tree-ring chronologies. The significant PCs were selected by
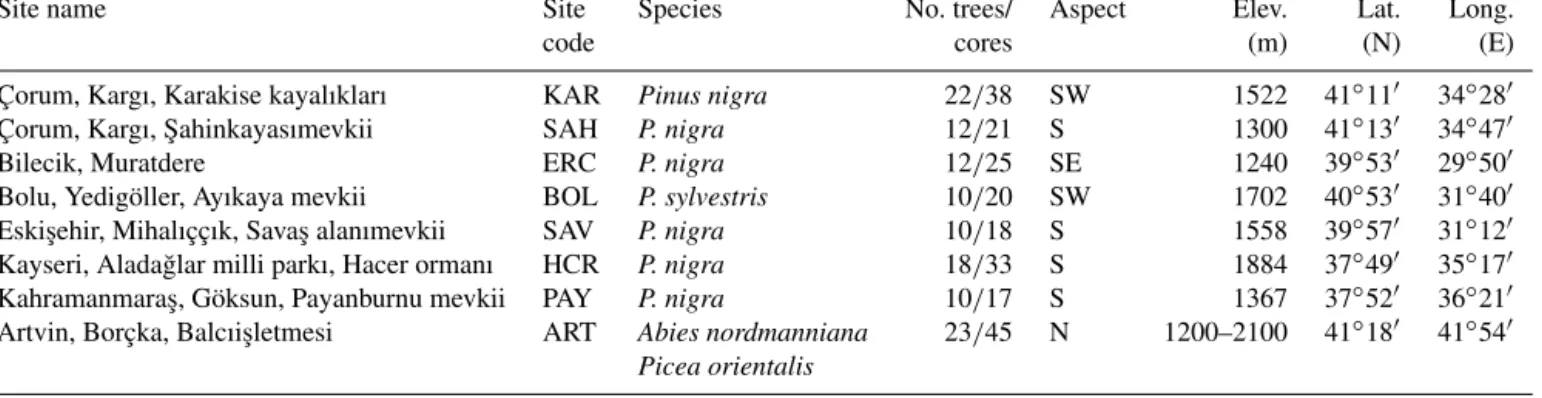
step-Table 1.Site information for the new chronologies developed by this study in Turkey.
Site name Site Species No. trees/ Aspect Elev. Lat. Long.
code cores (m) (N) (E)
Çorum, Kargı, Karakise kayalıkları KAR Pinus nigra 22/38 SW 1522 41◦110 34◦280
Çorum, Kargı, ¸Sahinkayasımevkii SAH P. nigra 12/21 S 1300 41◦130 34◦470
Bilecik, Muratdere ERC P. nigra 12/25 SE 1240 39◦530 29◦500
Bolu, Yedigöller, Ayıkaya mevkii BOL P. sylvestris 10/20 SW 1702 40◦530 31◦400
Eski¸sehir, Mihalıççık, Sava¸s alanımevkii SAV P. nigra 10/18 S 1558 39◦570 31◦120 Kayseri, Alada˘glar milli parkı, Hacer ormanı HCR P. nigra 18/33 S 1884 37◦490 35◦170
Kahramanmara¸s, Göksun, Payanburnu mevkii PAY P. nigra 10/17 S 1367 37◦520 36◦210
Artvin, Borçka, Balcıi¸sletmesi ART Abies nordmanniana 23/45 N 1200–2100 41◦180 41◦540 Picea orientalis
Table 2.Summary statistics for the new chronologies developed by this study in Turkey.
Total chronology Common interval
Site Time span First year Mean Time span Mean correlations: Variance
code (∗EPS > sensitivity among radii/ explained by
0.85) between radii and mean PC1(%)
KAR 1307–2003 1620 0.22 1740–1994 0.38/0.63 41 SAH 1663–2003 1738 0.25 1799–2000 0.42/0.67 45 ERC 1721–2008 1721 0.23 1837–2008 0.45/0.69 48 BOL 1752–2009 1801 0.18 1839–1994 0.32/0.60 36 SAV 1630–2005 1700 0.17 1775–2000 0.33/0.60 38 HCR 1532–2010 1704 0.18 1730–2010 0.38/0.63 40 PAY 1537–2010 1790 0.18 1880–2010 0.28/0.56 32 ART 1498–2007 1624 0.12 1739–1996 0.37/0.60 41
∗EPS is the expressed population signal (Wigley et al., 1984).
wise regression. We combined forward selection with back-ward elimination setting p < 0.05 as entrance tolerance and p< 0.10 as exit tolerance. The final model obtained when the regression reaches a local minimum of the root-mean-squared error (RMSE). The order of entry of the PCs into the model was PC3, PC21, PC4, PC15, PC5, PC17, PC7, PC9,
PC10. The regression equation is calibrated on the common
period (1930–2002) between robust temperature time series and the selected tree-ring series. Third, the final reconstruc-tion is based on bootstrap regression (Till and Guiot, 1990), a method designed to calculate appropriate confidence inter-vals for reconstructed values and explained variance even in cases of short time series. It consists in randomly resampling the calibration datasets to produce 1000 calibration equations based on a number of slightly different datasets.
The quality of the reconstruction is assessed by a number of standard statistics. The overall quality of fit of reconstruc-tion is evaluated based on the determinareconstruc-tion coefficient (R2), which expresses the percentage of variance explained by the model and RMSE, which expresses the calibration error. This does not ensure the quality of the extrapolation which needs additional statistics based on independent observations, i.e., observations not used by the calibration (verification data).
They are provided by the observations not resampled by the bootstrap process. The prediction RMSE (called RMSEP), the reduction of error (RE) and the coefficient of efficiency (CE) are calculated on the verification data and enable test-ing the predictive quality of the calibrated equations (Cook et al., 1994). Traditionally, a positive RE or CE value means a statistically significant reconstruction model, but bootstrap has the advantage of producing confidence intervals for such statistics without theoretical probability distribution; finally, we accept the RE and CE for which the lower confidence margin at 95 % are positive. This is more constraining than just accepting all positive REs and CEs. For additional ver-ification, we also present traditional split-sample procedure results that divided the full period into two subsets of equal length (Meko and Graybill, 1995).
To identify the extreme March–April cold and warm events in the reconstruction, standard deviation (SD) values were used. Years 1 and 2 SD above and below the mean were identified as warm, very warm, cold and very cold years, respectively. As a way to assess the spatial representation of our temperature reconstruction, we conducted a spatial field correlation analysis between reconstructed values and the gridded CRU TS3.23 temperature field (Jones and Harris,
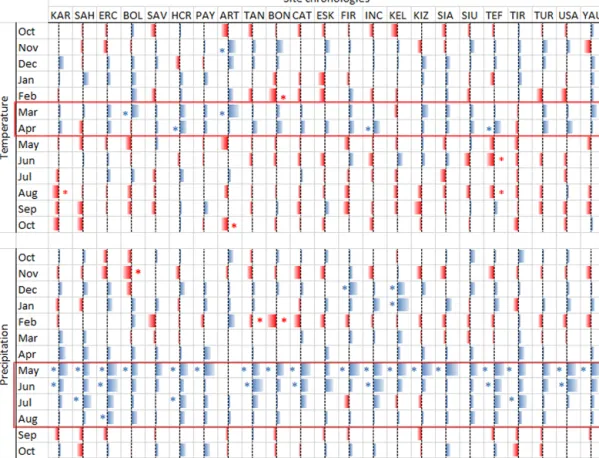
Figure 2.Summary of response function results of 23 chronologies. Red color represents negative effects of climate variability on tree ring width; blue color represents positive effects of climate variability on tree ring width;∗indicates statistically significant response function coefficient (p < 0.05). Each response function includes 13 weights for average monthly temperatures and 13 monthly precipitations from October of the prior year to October of the current year.
Figure 3.The comparison of May–August total precipitation (black) and the first principal component of 23 tree-ring chronologies (gray). Correlation coefficient between two time series is 0.65 (p < 0.001).
2008) for a broad region of the Mediterranean over the entire instrumental period (ca. 1930–2002). Finally, we compared our temperature reconstruction and also precipitation signal (PC1) against existing gridded temperature and hydroclimate
reconstructions for Europe over the period 1800–2002. We
performed spatial correlation analysis between (1) our tem-perature reconstruction and gridded temtem-perature reconstruc-tions for Europe (Xoplaki et al., 2005; Luterbacher et al., 2016) and OWDA (Cook et al., 2015); and (2) PC1and
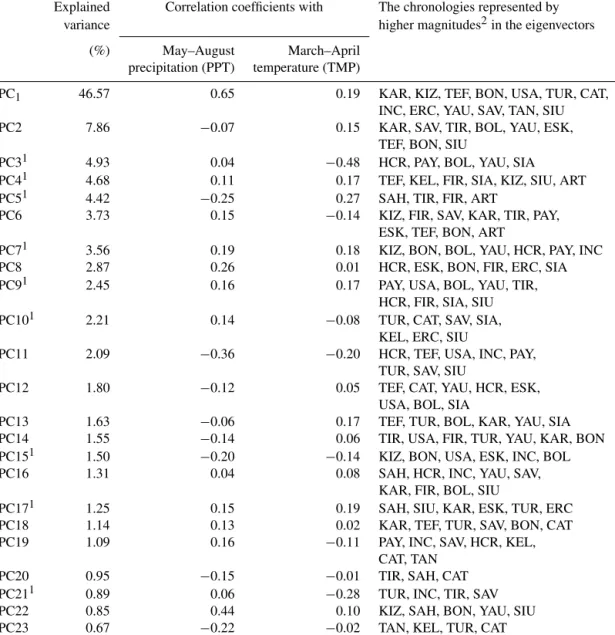
Table 3.Principal components analysis statistics for the Turkey temperature reconstruction model.
Explained Correlation coefficients with The chronologies represented by
variance higher magnitudes2in the eigenvectors
(%) May–August March–April
precipitation (PPT) temperature (TMP)
PC1 46.57 0.65 0.19 KAR, KIZ, TEF, BON, USA, TUR, CAT,
INC, ERC, YAU, SAV, TAN, SIU
PC2 7.86 −0.07 0.15 KAR, SAV, TIR, BOL, YAU, ESK,
TEF, BON, SIU
PC31 4.93 0.04 −0.48 HCR, PAY, BOL, YAU, SIA
PC41 4.68 0.11 0.17 TEF, KEL, FIR, SIA, KIZ, SIU, ART
PC51 4.42 −0.25 0.27 SAH, TIR, FIR, ART
PC6 3.73 0.15 −0.14 KIZ, FIR, SAV, KAR, TIR, PAY,
ESK, TEF, BON, ART
PC71 3.56 0.19 0.18 KIZ, BON, BOL, YAU, HCR, PAY, INC
PC8 2.87 0.26 0.01 HCR, ESK, BON, FIR, ERC, SIA
PC91 2.45 0.16 0.17 PAY, USA, BOL, YAU, TIR,
HCR, FIR, SIA, SIU
PC101 2.21 0.14 −0.08 TUR, CAT, SAV, SIA,
KEL, ERC, SIU
PC11 2.09 −0.36 −0.20 HCR, TEF, USA, INC, PAY,
TUR, SAV, SIU
PC12 1.80 −0.12 0.05 TEF, CAT, YAU, HCR, ESK,
USA, BOL, SIA
PC13 1.63 −0.06 0.17 TEF, TUR, BOL, KAR, YAU, SIA
PC14 1.55 −0.14 0.06 TIR, USA, FIR, TUR, YAU, KAR, BON
PC151 1.50 −0.20 −0.14 KIZ, BON, USA, ESK, INC, BOL
PC16 1.31 0.04 0.08 SAH, HCR, INC, YAU, SAV,
KAR, FIR, BOL, SIU
PC171 1.25 0.15 0.19 SAH, SIU, KAR, ESK, TUR, ERC
PC18 1.14 0.13 0.02 KAR, TEF, TUR, SAV, BON, CAT
PC19 1.09 0.16 −0.11 PAY, INC, SAV, HCR, KEL,
CAT, TAN
PC20 0.95 −0.15 −0.01 TIR, SAH, CAT
PC211 0.89 0.06 −0.28 TUR, INC, TIR, SAV
PC22 0.85 0.44 0.10 KIZ, SAH, BON, YAU, SIU
PC23 0.67 −0.22 −0.02 TAN, KEL, TUR, CAT
1Indicates the PCs that were used in the reconstruction as predictors.2Which exceed a value of ±0.2.
OWDA (Cook et al., 2015). To assess the significance of the correlation between our reconstruction (y) and gridded reconstructions (xj , j = 1. . .N ), we have calculated signifi-cance thresholds based on a Monte Carlo technique. For each grid point j , we have calculated the correlation between xj and y, but with a random permutation of the values of our re-construction. This is repeated 1000 times with a different per-mutation. The 1000 correlation coefficients thus obtained are expected to be zero as the correlation is established on non-corresponding years. The 95th quantile of these 1000 coeffi-cients is assumed to be passed in less than 5 % of the cases. Then a correlation coefficient with a higher value is consid-ered as positive with a 95 % confidence. These thresholds are obtained with a common permutation for all xj so that the
spatial structure is conserved in the tests. The + sign is as-signed to the xj with a correlation higher than an expected value under the noncorrelation hypothesis.
3 Results and discussion 3.1 Tree-ring chronologies
In addition to 15 chronologies developed by previous stud-ies, we produced 6 P. nigra, 1 P. sylvestris and 1 A. nord-manniana/P. orientalischronologies for this study (Table 2). The Çorum district produced two P. nigra chronologies: one being the longest (KAR; 627 years long) and the other the most sensitive to climate (SAH; mean sensitivity value of 0.25). Previous investigations of climate–tree growth
rela-Table 4. Calibration and verification statistics of the bootstrap method (1000 iterations applied) showing the mean values based on the 95 % confidence interval (CI).
Mean (95 % CI) Calibration RMSE 0.65 (0.52; 0.77) R2 0.73 (0.60; 0.83) Verification RE 0.54 (0.15; 0.74) CE 0.51 (0.04; 0.72) RMSEP 0.88 (0.67; 1.09)
Note that RMSE: root mean squared error, R2coefficient of determination, RE: reduction of error, CE: coefficient of efficiency, RMSEP: root-mean-squared error prediction.
Table 5.Calibration and cross-validation statistics for the Turkey temperature reconstruction model.
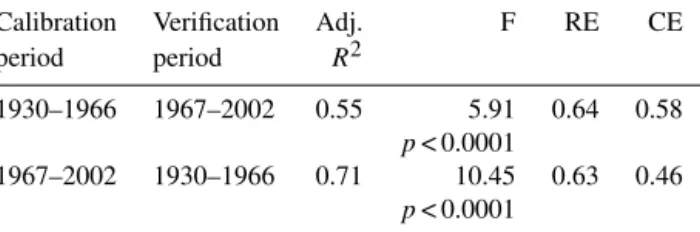
Calibration Verification Adj. F RE CE
period period R2
1930–1966 1967–2002 0.55 5.91 0.64 0.58
p< 0.0001
1967–2002 1930–1966 0.71 10.45 0.63 0.46 p< 0.0001
tionships reported a mean sensitivity range of 0.13–0.25 for P. nigrain Turkey (Köse et al., 2011; Akkemik et al., 2008). The KAR, SAH and ERC chronologies (with mean sensitiv-ity values from 0.22 to 0.25) were classified as very tive, and the SAV, HCR and PAY chronologies (mean sensi-tivity values range 0.17–0.18) contained values characteris-tic of being sensitive to climate. The lowest mean sensitivity value was obtained for the ART A. nordmanniana/P. orien-talischronology. Nonetheless, this chronology retained a sta-tistically significant temperature signal (p < 0.05).
3.2 Tree-ring growth–climate relationship
RFA coefficients of May to August precipitation are posi-tively correlated with most of the tree-ring series (Fig. 2) and among them May and June coefficients are generally sig-nificant. The first principal component of the 23 chronolo-gies, which explains 47 % of the tree-growth variance, is highly correlated with May–August total precipitation, sta-tistically (r = 0.65, p < 0.001) and visually (Fig. 3). The high correlation was expected given that numerous studies also found similar results in Turkey (Akkemik, 2000a, b, 2003, Akkemik et al., 2005, 2008; Akkemik and Aras, 2005; Hughes et al., 2001; D’Arrigo and Cullen, 2001; Touchan et al., 2003, 2005a, b, 2007; Köse et al., 2011, 2012, 2013; Martin-Benitto et al., 2016). The influence of temperature was not as strong as May–August precipitation on radial growth, although generally positive in early spring (March and April; Fig. 2). Conversely, the ART chronology from
northeastern Turkey contained a strong temperature signal, which was significantly positive in March.
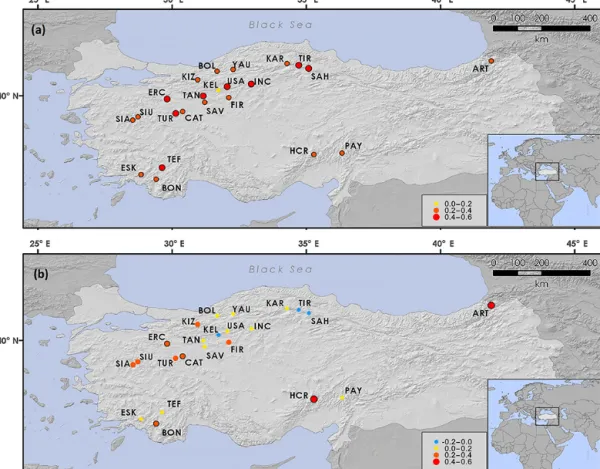
Correlation maps representing influence of May–August precipitation (Fig. 4a) and March–April temperature (Fig. 4b) also showed that strength of the summer precipi-tation signal is higher and significant almost all over Turkey. Higher precipitation in summer has a positive effect on tree growth, because of long-lasting dry and warm conditions over Turkey (Türke¸s, 1996b; Köse et al., 2012). Spring pre-cipitation signals are generally positive and significant only for four tree-ring sites. The sites located at the upper distri-butions of the species generally showed higher correlations. The highest correlations obtained for Picea/Abies ogy (ART) from the Caucasus, and for Pinus nigra chronol-ogy (HCR) from the upper (about 1900 m) and southeastern distribution of the species. This black pine forest was still partly covered by snow from the previous year during the field work in fall. Higher temperatures in spring maybe cause snowmelt earlier and lead to produce larger annual rings. In addition to these chronologies, we also used the chronologies that revealed the influence of precipitation as well as temper-ature to reconstruct March–April tempertemper-ature.
3.3 March–April temperature reconstruction
The higher-order PCs of the 23 chronologies are significantly correlated with the March–April temperature and, by nature, are independent of the precipitation signal (Table 3). The best selection for fit temperatures are obtained with the PC3, PC4,
PC5, PC7, PC9, PC10, PC15, PC17, PC21, which explains
to-gether 25 % of the tree-ring chronologies. So, the tempera-ture signal remains important in the tree-ring chronologies and can be reconstructed. The advantage to separate both signals through orthogonal PCs enable removal of unwanted noise for our temperature reconstruction. Thus, PC1was not
used as a potential predictor of temperature because it is largely dominated by precipitation (Table 3, Fig. 3). The last two PCs contain a too-small part of the total variance to be used in the regressions. However, even if Jolliffe (1982) and Hadi and Ling (1998) claimed that certain PCs with small eigenvalues (even the last one), which are commonly ignored by principal components regression methodology, may be re-lated to the independent variable, we must be cautious with that because they may be much more dominated by noise than the first ones. So, the contribution of each PC to the regression sum of squares is also important for selection of PCs (Hadi and Ling, 1998). The findings of Jolliffe (1982) and Hadi and Ling (1998) provide a justification for using non-primary PCs, (e.g., of second and higher order) in our regression, given that correlations with temperature may be overpowered by affects from precipitation in our study area (E. R. Cook, personal communication, 2011).
Using this method, the calibration and verification statis-tics indicated a statistically significant reconstruction (Ta-ble 4, Fig. 5). For additional verification, we also present
Figure 4. Maps showing Pearson’s correlation coefficients between the sites chronologies and (a) May–August total precipitation and (b) March–April mean temperature for the period 1930–2012. For each site, the closest gridded (0.5◦×0.5◦) climate data obtained from CRU dataset were used. Graduated circle size and color correspond to correlation coefficient versus the climate variable. Black lines around circles represent significant correlation coefficients (p < 0.05).
split-sample procedure results. Similarly, the bootstrap re-sults, derived calibration and verification tests using this method indicated statistically significant RE and CE values (Table 5).
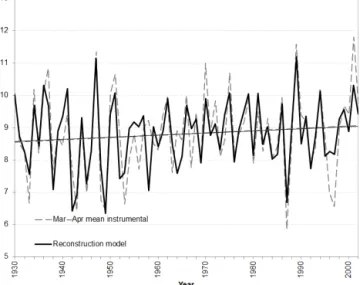
The regression model accounted for 67 % (Adj. R2=0.64, p< 0.0001) of the actual temperature variance over the cal-ibration period (1930–2002). Also, actual and reconstructed March–April temperature values had nearly identical trends during the period 1930–2002 (Fig. 5). Moreover, the tree-ring chronologies successfully simulated both high fre-quency and warming trends in the temperature data during this period. The reconstruction was more powerful at clas-sifying warm events rather than cold events. Over the last 73 years, 8 of 10 warm events in the instrumental data were also observed in the reconstruction, while 5 of 9 cold events were captured. Similarly, previous tree-ring-based precipita-tion reconstrucprecipita-tions for Turkey (Köse et al., 2011; Akkemik et al., 2008) were generally more successful in capturing dry years rather than wet years.
Our temperature reconstruction on the 1800–2002 period is obtained by bootstrap regression using 1000 iterations (Fig. 6). The confidence intervals are obtained from the range
between the 2.5th and the 97.5th percentiles of the 1000 sim-ulations. Low-frequency variability of our spring tempera-ture reconstruction showed larger variability in the 19th cen-tury than the 20th cencen-tury. For the pre-instrumental period (1800–1929), a total of 23 cold (1813, 1818, 1821, 1824, 1837, 1848, 1854, 1858, 1860, 1869, 1877–1878, 1880– 1881, 1883, 1897–1898, 1905–1907, 1911–1912, 1923) and 13 warm (1801–1802, 1807, 1845, 1853, 1866, 1872–1873, 1879, 1885, 1890, 1901, 1926) events were determined. After comparing our results with event years obtained from May to June precipitation reconstructions from western Anatolia (Köse et al., 2011), the cold years 1818, 1848 and 1897 ap-peared to coincide with wet years and 1881 was a very wet year for the entire region. Furthermore, these years can be described as cold (in March–April) and wet (in May–June) for western Anatolia.
Among the warm periods in our reconstruction, conditions during the year 1879 were dry, 1895 wet, and 1901 very wet across the broad region of western Anatolia (Köse et al., 2011). Hence, we defined 1879 as a warm (in March– April) and dry year (in May–June), and 1895 and 1901 were warm and wet years. In the years 1895 and 1901 the
com-Figure 5. Actual (instrumental) and reconstructed March–April temperature (◦C). Dashed gray lines represent actual values and solid black lines represent reconstructed values shown with trend lines. The tendency to warm up at the reconstructed temperature is in good agreement with the trend in instrumental data.
Figure 6.March–April temperature reconstruction for Turkey for the period 1800–2002 CE. The horizontal, central white line shows the reconstructed long-term mean and does not include instrumen-tal data; black background denotes Monte Carlo (n = 1000) boot-strapped 95 % confidence limits; and the red line shows 13-year low-pass filter values.
bination of a warm early spring and a wet, late spring– summer caused enhanced radial growth in Turkey, inter-preted as longer growing seasons without drought stress.
Of these event years, 1897 and 1898 were exceptionally cold and 1845, 1872 and 1873 were exceptionally warm. During the last 200 years, our reconstruction suggests that the coldest year was 1898 and the warmest year was 1873. The reconstructed extreme events also coincided with ac-counts from historical records. Server (2008) recounted the
Figure 7.Spatial correlation map for the March–April temperature reconstruction. Spatial field correlation map showing statistical re-lationship between the temperature reconstruction and the gridded temperature field at 0.5◦intervals (CRU TS3.23; Jones and Harris, 2008) during the period 1930–2002 over the Mediterranean region. For each grid, calculated correlation coefficient from 0.20 to 0.60 is significant (p < 0.05).
winter of 1898 as characterized by anomalously cold tem-peratures that persisted late into the spring season. A family that brought their livestock herds up into the plateau region in Kır¸sehir seeking food and water were suddenly covered in snow on 11 March 1898. This account of a late spring freeze supports the reconstruction record of spring tempera-tures across Turkey and offers corroboration to the quality of the reconstructed values.
Seyf (1985) reported that extreme summer temperature during the year 1873 resulted in widespread crop failure and famine. Historical documents recorded an infamous drought-derived famine that occurred in Anatolia from 1873 to 1874 (Quataert, 1996; Kuniholm, 1990), which claimed the lives of 250 000 people and a large number of cattle and sheep (Faroqhi, 2009). This drought caused widespread mortal-ity of livestock and depopulation of rural areas through hu-man mortality, and migration of people from rural to ur-ban areas. Further, the German traveler Naumann (1893) reported a very dry and hot summer in Turkey during the year 1873 (Heinrich et al., 2013). Conditions worsened when the international stock exchanges crashed in 1873 (Zürcher, 2004). Our temperature record suggests that dry conditions during the early 1870s were possibly exacerbated by warm spring temperatures that likely carried into summer. A simi-lar pattern of intensified drought by warm temperatures was demonstrated recently by Griffin and Anchukaitis (2014) for the current drought in California, USA.
Extreme cold and warm events were usually 1 year long, and the longest extreme cold and warm events were 2 and 3 years long, respectively. These results were similar with durations of extreme wet and dry events in Turkey (Touchan
Figure 8.Spatial correlation maps for the March–April temperature reconstruction and precipitation signal (PC1) obtained from the tree-ring dataset during the period 1800–2002 over Europe. Maps demonstrate spatial field correlations between our temperature reconstruction and (a) gridded spring temperature reconstruction for Europe (Xoplaki et al., 2005), (b) gridded summer temperature reconstruction for Europe (Luterbacher et al., 2016), (c) Old World Drought Atlas (OWDA; Cook et al., 2015). Panels (d) and (e) show spatial correlations between PC1and OWDA (Cook et al., 2015) and gridded European summer precipitation reconstruction (Pauling et al., 2006), respectively. The + sign represents significant correlation coefficients (p < 0.05).
Figure 9.Comparison of March–April temperature reconstruction (gray) with the mean of corresponding grid points from European spring (March to May) temperature reconstruction (Xoplaki et al., 2005; black) over the study area (36–42◦N, 26–38◦E). The indicated correlation coefficients are calculated for instrumental period (also calibration period for this study; 1930–2002; r = 0.76, p < 0.001); for the pre-instrumental period of Turkey, while pre-instrumental data has sufficient quality for most parts of Europe (1901–1929; r = 0.35, p < 0.10); and for pre-instrumental period (1800–1900; r = 0.13, p < 0.10).
et al., 2003, 2005a, b, 2007; Akkemik and Aras, 2005; Akkemik et al., 2005, 2008, Köse et al., 2011; Güner et al., 2016). Moreover, seemingly innocuous short-term warm events, such as the 1807 event, were recorded across the Mediterranean and in high elevations of the European re-gions. Casty et al. (2005) reported the year 1807 as being one of the warmest alpine summers in the European Alps over the last 500 years. As such, a drought record from Nicault et al. (2008) echoes this finding, as a broad region of the Mediterranean Basin experienced drought conditions.
Heinrich et al. (2013) analyzed winter-to-spring (January– May) air temperature variability in Turkey since 1125 CE as revealed from a robust tree-ring carbon isotope record from Juniperus excelsa. Although they offered a long-term perspective of temperature over Turkey, the reconstruction model, which covered the period 1949–2006, explained 27 % of the variance in temperature since the year 1949. In this study, we provided a short-term perspective of tempera-ture fluctuation based on a robust model (calibrated and verified 1930–2002; Adj. R2=0.64; p < 0.0001). Yet, the Heinrich et al. (2013) temperature record did not capture the 20th century warming trend as found elsewhere (Wahl et al., 2010). However, their temperature trend does agree with trend analyses conducted on meteorological data from Turkey and other areas in the eastern Mediterranean region. The warming trend seen during our reconstruction calibra-tion period (1930–2002) was similar to the data shown by Wahl et al. (2010) across the region and hemisphere. Further, the warming trends seen in our record agrees with data pre-sented by Turkes and Sumer (2004), of which they attributed to increased urbanization in Turkey. Considering long-term changes in spring temperatures, the 19th century was charac-terized by more high-frequency fluctuations compared to the 20th century, which was defined by more gradual changes and includes the beginning of decreased DTRs in the region (Turkes and Sumer, 2004).
3.4 Comparison of instrumental gridded data and spatial reconstructions
Spatial correlation analysis revealed that our network-based temperature reconstruction was representative of conditions across Turkey as well as the broader Mediterranean re-gion (Fig. 7). During the period 1930–2002, estimated tem-perature values were highly significant (r range 0.5–0.6, p< 0.01) with instrumental conditions recorded from south-ern Ukraine to the west across Romania, and from northsouth-ern areas of Libya and Egypt to the east across Iraq. The strength of the reconstruction model is evident in the broad spatial im-plications demonstrated by the temperature record. Thus, we interpret warm and cold periods and extreme events within the record with high confidence.
We compared our tree-ring-based temperature reconstruc-tion with existing gridded temperature reconstrucreconstruc-tions for Europe (Xoplaki et al., 2005, Fig. 8a; Luterbacher et al., 2016, Fig. 8b) and the OWDA (Cook et al., 2015, Fig. 8c) for further validation of the reconstruction. Spatial correla-tions over the past 200 years were lower with reconstructed European summer temperature (May to July; Fig. 8b). Yet, we expected this result because of the paucity of Turkey derived proxies in the other reconstructions, as well as the differing seasons involved across the reconstructions. Simi-larly, our reconstruction showed weak correlations with sum-mer drought index over Turkey. Besides comparing differ-ent seasons, perhaps this is because less precipitation begets drought conditions rather than high temperature in the re-gion. The highest and significant (p < 0.05) correlations were found with European spring (March to May) temperature re-construction over southeastern Europe, which are stronger over Turkey (Fig. 8a). We used the mean of corresponding grid points from European spring temperature reconstruction over the study area (36–42◦N, 26–38◦E) to show how the correlation changed over time (Fig. 9). The correlation
co-efficient was highly significant (r = 0.76, p < 0.001) during our calibration period (1930–2002). We found lower but still significant correlation (r = 0.35, p < 0.10) for the period of 1901–1929, which climatic records are very few over the region while available data has sufficient quality for most parts of Europe. These results give additional verification for our reconstruction. Moreover, our reconstruction has a weak, insignificant relationship (r = 0.13, p > 0.10) during the 19th century. This may be related to poor reconstruc-tive skill of European spring temperature reconstruction over Turkey, which contains few proxies from the country (Xo-plaki et al., 2005; Luterbacher et al., 2004). Nonetheless, these results demonstrate that tree-ring chronologies from Turkey can serve as useful temperature proxies for further spatial temperature reconstructions to fill the gaps in the area. We also compared the precipitation signal (PC1) obtained
from our tree-ring network with OWDA (Cook et al., 2015) and gridded European summer precipitation reconstruction (Pauling et al., 2006) to test the strength of the signal spatially (Fig. 8d and e, respectively). We calculated highly signifi-cant positive correlations with summer drought index over Turkey and neighboring European countries such as Greece, Bulgaria, Romania and Italy while significant correlations are lower for the northern Mediterranean countries (Fig. 8d). These results showed that summer precipitation signal repre-sented by PC1 is very strong not only on instrumental
pe-riod but also on pre-instrumental pepe-riod and represents a large spatial coverage. We found low and insignificant cor-relations over Turkey and Mediterranean countries with Eu-ropean summer precipitation reconstruction (Fig. 8e). Paul-ing et al. (2006) stated that poor reconstructive skills deter-mined over Turkey because of few instrumental record before the1930s.
4 Conclusions
In this study, we used a broad network of tree-ring chronolo-gies to provide the first tree-ring-based temperature recon-struction for Turkey and identified extreme cold and warm events during the period 1800–1929 CE. Similar to the pre-cipitation reconstructions against which we compare our air temperature record, extreme cold and warm years were gen-erally short in duration (1 year) and rarely exceeded 2– 3 years in duration. The coldest and warmest years over west-ern Anatolia were experienced during the 19th century and the 20th century is marked by a temperature increase.
Reconstructed temperatures for the 19th century suggest that more short-term fluctuations occurred compared to the 20th century. The gradual warming trend shown by our re-construction calibration period (1930–2002) is coeval with decreases in spring DTRs. Given the results of Turkes and Sumer (2004), the variations in short- and long-term temper-ature changes between the 19th and 20th centuries might be related to increased urbanization in Turkey.
We highlight that the 20th century warming trend is un-precedented within the context of the past ca. 200 years, es-pecially over the past ca. 15 years. Correlations with grid-ded climate fields and other climate reconstructions from the region revealed that our network-based temperature re-construction was representative of conditions across Turkey, as well as the broader Mediterranean region. Expanding the tree-ring network across Turkey, especially to the east, will improve the spatial implications of future temperature recon-structions.
The study revealed the potential for reconstructing tem-perature in an area previously thought impossible, especially given the strong precipitation signals displayed by most tree species growing in the dry Mediterranean climate that char-acterizes broad areas of Turkey. Our reconstruction only spans 205 years due to the shortness of the common interval for the chronologies used in this study, but the possibility ex-ists to extend our temperature reconstruction further back in time by increasing the sample depth with more temperature-sensitive trees, especially from northeastern Turkey. Thus, future research will focus on increasing the number of tree-ring sites across Turkey and maximizing chronology length at existing sites that would ultimately extend the reconstruc-tion back in time.
5 Data availability
ring data set is available from the International Tree-Ring Data Bank – ITRDB (https://www.ncdc.noaa.gov/ data-access/paleoclimatology-data/datasets/tree-ring).
Acknowledgements. This research was supported by the Sci-entific and Technical Research Council of Turkey (TUBITAK), projects ÇAYDAG 107Y267 and YDABAG 102Y063. Nesibe Köse was supported by the Council of Higher Education of Turkey. We are grateful to the Turkish Forest Service personnel and Ali Kaya, Umut Ç. Kahraman and Hüseyin Yurtseven for their invaluable support during our field studies. We thank Ufuk Turunco˘glu for his help on spatial analysis. Joel Guiot was supported by the Labex OT-Med (ANR-11-LABEX-0061), French National Research Agency (ANR).
Edited by: J. Luterbacher
Reviewed by: F. Charpentier Ljungqvist and three anonymous referees
References
Akkemik, Ü.: Dendroclimatology of Umbrella pine (Pinus pinea L.) in Istanbul (Turkey), Tree-Ring Bull., 56, 17–20, 2000a. Akkemik, Ü.: Tree-ring chronology of Abies cilicica Carr. in the
Western Mediterranean Region of Turkey and its response to cli-mate, Dendrochronologia, 18, 73–81, 2000b.
Akkemik, Ü.: Tree-rings of Cedrus libani A. Rich the northern boundary of its natural distribution, IAWA J., 24, 63-73, 2003.
Akkemik, Ü and Aras, A.: Reconstruction (1689–1994) of April– August precipitation in southwestern part of central Turkey, Int. J. Clim., 25, 537–548, 2005.
Akkemik, Ü., Dagdeviren, N., and Aras, A.: A preliminary recon-struction (A.D. 1635–2000) of spring precipitation using oak tree rings in the western Black Sea region of Turkey, Int. J. Biomet., 49, 297–302, 2005.
Akkemik, Ü., D’Arrigo, R., Cherubini, P., Köse, N., and Jacoby, G.: Tree-ring reconstructions of precipitation and streamflow for north-western Turkey, Int. J. Clim., 28, 173–183, 2008. Biondi, F. and Waikul, K.: DENDROCLIM2002: A C++ program
for statistical calibration of climate signals in tree-ring chronolo-gies, Comput. Geosci., 30, 303–311, 2004.
Briffa, K. R. and Jones, P. D.: Basic chronology statistics and as-sessment, in: Methods of Dendrochronology: Applications in the Environmental Sciences edited by: Cook, E. and Kairiukstis, L. A., Kluwer Academic Publishers, Amsterdam, 137–152, 1990. Casty, C., Wanner, H., Luterbacher, J., Esper, J., and Böhm, R.:
Temperature and precipitation variability in the European Alps since 1500, Int. J. Clim., 25, 1855–1880, 2005.
Cook, E.: A time series analysis approach to tree-ring standardiza-tion, PhD Dissertastandardiza-tion, University of Arizona, Tucson, 1985. Cook, E., Briffa, K., Shiyatov, S., and Mazepa, V.: Tree-ring
stan-dardization and growth-trend estimation, in: Methods of Den-drochronology: Applications in the Environmental Sciences, edited by: Cook, E. and Kairiukstis, L. A., Kluwer Academic Publishers, Amsterdam, 104–122, 1990a.
Cook, E., Shiyatov, S., and Mazepa, V.: Estimation of the mean chronology, in: Methods of Dendrochronology: Applications in the Environmental Sciences, edited by: Cook, E. and Kairiuk-stis, L. A., Kluwer Academic Publishers, Amsterdam, 123–132, 1990b.
Cook, E. R., Briffa, K. R., and Jones, P. D.: Spatial re-gression methods in dendroclimatology: A review and com-parison of two techniques, Int. J. Climatol., 14, 379–402, doi:10.1002/joc.3370140404, 1994.
Cook, E. R., Seager, R., Kushnir, Y., Briffa, K. R., Büntgen, U., Frank, D., Krusic, P. J., Tegel, W., van der Schrier, G., Andreu-Hayles, L., Baillie, M., Baittinger, C., Bleicher, N., Bonde, N., Brown, D., Carrer, M., Cooper, R., ˇCufar, K., Dittmar, C., Es-per, J., Griggs, C., Gunnarson, B., Günther, B., Gutierrez, E., Haneca, K., Helama, S., Herzig, F., Heussner, K.-U., Hofmann, J., Janda, P., Kontic, R., Köse, N., Kyncl, T., Levaniˇc, T., Lin-derholm, H., Manning, S., Melvin, T. M., Miles, D., Neuwirth, B., Nicolussi, K., Nola, P., Panayotov, M., Popa, I., Rothe, A., Seftigen, K., Seim, A., Svarva, H., Svoboda, M., Thun, T., Ti-monen, M., Touchan, R., Trotsiuk, V., Trouet, V., Walder, F., Wa˙zny, T., Wilson, R., and Zang, C.: Old World megadroughts and pluvials during the Common Era, Sci. Adv., 1, e1500561, doi:10.1126/sciadv.1500561, 2015.
D’Arrigo, R. and Cullen, H. M.: A 350-year (AD 1628–1980) re-construction of Turkish precipitation, Dendrochronologia, 19, 169–177, 2001.
Dean, J. R., Jones, M. D., Leng, M. J., Sloane, H. J., Roberts, C. N., Woodbridge, J., Swann, G. E. A., Metcalfe, S. E., Eastwood, W. J. and Yiitba¸siolu, H.: Palaeo-seasonality of the last two millen-nia reconstructed from the oxygen isotope composition of car-bonates and diatom silica from Nar Gölü, central Turkey, Qua-ternary Sci. Rev., 66, 35–44, 2013.
Deniz, A., Toros, T., and Incecik, S.: Spatial variations of climate indices in Turkey, Int. J. Clim., 31, 394–403, 2011.
Faroqhi, S. and Frisch, S. L.: The Ottoman Empire: A Short History, Markus Wiener Publishers, 2009.
Fleitmann, D., Cheng, H., Badertscher, S., Edwards, R. L., Mudelsee, M., Göktürk, O. M., Fankhauser, A., Pickering, R., Raible, C. C., Matter, A., Kramers, J. and Tüysüz, O.: Timing and climatic impact of Greenland interstadials recorded in sta-lagmites from northern Turkey, Geophys. Res. Lett., 36, L19707, doi:10.1029/2009gl040050, 2009.
Fritts, H. C.: Tree Rings and Climate, Academic Press, New York, 1976.
Gokturk, O. M., Fleitmann, D., Badertscher, S., Cheng, H., Ed-wards, R. L., and Tuysuz, O.: Climate on the Southern Black Sea coast during the Holocene, Quaternary Sci. Rev., 30, 2433–2445, 2010.
Griggs, C., DeGaetano, A., Kuniholm, P., and Newton, M.: A re-gional high-frequency reconstruction of May–June precipitation in the north Aegean from oak tree rings, A.D. 1809–1989, Int. J. Clim., 27, 1075–1089, 2007.
Grissino-Mayer, H. D.: Evaluating crossdating accuracy: A man-ual and tutorial for the computer program COFECHA, Tree-Ring Res., 57, 205–221, 2001.
Griffin, D. and Anchukaitis, K. J.: How unusual is the 2012–2014 California drought?, Geophy. Res. Lett., 41, 9017–9023, 2014. Güner, H. T., Köse, N., and Harley, G. L.: 200-year
reconstruc-tion of Kocasu River (Sakarya River Basin, Turkey) stream-flow derived from a tree-ring network, Int. J. Biometerol., 1–11, doi:10.1007/s00484-016-1223-y, 2016.
Hadi, A. S. and Ling, R. F.: Some cautionary notes on the use of principal components regression, Am. Stat., 52, 15–19, 1998. Heinrich, I., Touchan, R., Liñán, I. D., Vos, H., and Helle, G.:
Winter-to-spring temperature dynamics in Turkey derived from tree rings since AD 1125, Clim. Dynam., 41, 1685–1701, 2013. Hellmann, L., Agafonov, L., Ljungqvist, F. C., Sidorova, O. C.,
Frederick, E. D., Esper, J., Hülsmann, L., Kirdyanov, A. V., Moi-seev, P., Myglan, V. S., Nikolaev, A. N., Reinig, F., Schwein-gruber, F. H., Solomina, O., Tegel, W., and Büntgen, U.: Di-verse growth trends and climate responses across Eurasia’s bo-real forest, Environ. Res. Let., 11, 074021, doi:10.1088/1748-9326/11/7/074021, 2016.
Holmes, R. L.: Computer-assisted quality control in tree-ring data and measurements, Tree-Ring Bull., 43, 69–78, 1983.
Hughes, M. K., Kuniholm, P. I, Garfin, G. M., Latini, C., and Eis-cheid, J.: Aegean tree-ring signature years explained, Tree-Ring Res., 57, 67–73, 2001.
Jolliffe, I. T.: A note on the use of principal components in regres-sion, Appl. Stat., 31, 300–303, 1982.
Jex, C. N., Baker, A., Fairchild, I. J., Eastwood, W. J., Leng, M. J., Sloane, H. J., Thomas, L., and Bekarolu, E.: Calibration of speleothem δ18O with instrumental climate records from Turkey, Global Planet. Change, 71, 207–217, 2010.
Jones, M. D., Roberts, N., Leng, M. J., and Turke¸s, M.: A high-resolution late Holocene lake isotope record from Turkey and links to North Atlantic and monsoon climate, Geology, 34, 361– 364, 2006.
Jones, P. D. and Harris, I.: Climatic Research Unit (CRU) time-series datasets of variations in climate with vari-ations in other phenomena, NCAS British
Atmo-spheric Data Centre, http://catalogue.ceda.ac.uk/uuid/ 3f8944800cc48e1cbc29a5ee12d8542d (last access: 22 De-cember 2016), 2008.
Köse, N., Akkemik, Ü., and Dalfes, H. N.: Anadolu’nun iklim tar-ihinin son 500 yılı: Dendroklimatolojik ilk sonuçlar. Türkiye Kuvaterner Sempozyumu-TURQUA–V, 02–03 Haziran 2005, Bildiriler Kitabı, 136–142, 2005 (in Turkish).
Köse, N., Akkemik, Ü., Dalfes, H. N., and Özeren, M. S.: Tree-ring reconstructions of May–June precipitation of western Anatolia, Quaternary Res., 75, 438–450, 2011.
Köse, N., Akkemik, Ü., Dalfes, H. N., and Özeren, M. S., Tolunay D.: Tree-ring growth of Pinus nigra Arn. subsp. pallasiana under different climate conditions throughout western Anatolia, Den-drochronologia, 30, 295–301, 2012.
Köse, N., Akkemik, U., Guner, H. T., Dalfes, H. N., Grissino-Mayer, H. D., Ozeren, M. S., and Kindap, T.: An improved re-construction of May– June precipitation using tree-ring data from western Turkey and its links to volcanic eruptions, Int. J. Biome-teorol., 57, 691–701, 2013.
Kuniholm, P. I.: Archaeological Evidence and Non-Evidence for Climatic Change, Philos. T. R. Soc. A, 330, 645–655, 1990. Kuzucuo˘glu, C., Dörfler, W., Kunesch, S., and Goupille, F.: Mid- to
late-Holocene climate change in central Turkey: the Tecer Lake record, Holocene, 21, 173–188, 2011.
Luterbacher, J., Dietrich, D., Xoplaki, E., Grosjean, M., and Wan-ner, H.: European seasonal and annual temperature variability, trends and extremes since 1500, Science, 303, 1499–1503, 2004. Luterbacher, J., García-Herrera, R., Akcer-On, S., Allan, R., Alvarez-Castro, M. C., Benito, G., Booth, J., Büntgen, U., Ca-gatay, N., Colombaroli, D., Davis, B., Esper, J., Felis, T., Fleit-mann, D., Frank, D., Gallego, D., Garcia-Bustamante, E., Glaser, R., Gonzalez-Rouco, F. J., Goosse, H., Kiefer, T., Macklin, M. G., Manning, S. W., Montagna, P., Newman, L., Power, M. J., Rath, V., Ribera, P., Riemann, D., Roberts, N., Sicre, M. A., Silenzi, S., Tinner, W., Tzedakis, P. C., Valero-Garcés, B., van der Schrier, G., Vannière, B., Vogt, S., Wanner, H., Werner, J. P., Willett, G., Williams, M. H., Xoplaki, E., Zerefos, C. S., and Zorita, E.: A review of 2000 years of paleoclimatic evidence in the Mediterranean, The Climate of the Mediterranean region: from the past to the future, edited by: Lionello, P., Elsevier, Am-sterdam, the Netherlands, 87–185, 2012.
Luterbacher, J., Werner, J. P., Smerdon, J. E., Fernández-Donado, L., González-Rouco, F. J., Barriopedro, D., Ljungqvist, F. C., Büntgen, U., Zorita, E., Wagner, S., Esper, J., McCarroll, D., Toreti, A., Frank, D., Jungclaus, J. H., Barriendos, M., Bertolin, C., Bothe, O., Brázdil, R., Camuffo, D., Dobrovolný, P., Gagen, M., García-Bustamante, E., Ge, Q., Gómez-Navarro, J. J., Guiot, J., Hao, Z., Hegerl, G. C., Holmgren, K., Klimenko, V. V, Martín-Chivelet, J., Pfister, C., Roberts, N., Schindler, A., Schurer, A., Solomina, O., Gunten, L. von, Wahl, E., Wanner, H., Wetter, O., Xoplaki, E., Yuan, N., Zanchettin, D., Zhang, H., and Zerefos, C.: European summer temperatures since Roman times, Environ. Res. Lett., 11, 024001, 2016.
Martin-Benito, D., Ummenhofer C. C., Köse, N., Güner, H. T., and Pederson, N.: Tree-ring reconstructed May–June precipitation in the Caucasus since 1752 CE, Clim. Dynam., 47, 3011–3027, doi:10.1007/s00382-016-3010-1, 2016.
Meko, D. M. and Graybill, D. A.: Tree-ring reconstruction of upper Gila River discharge, Water Res. Bull., 31, 605–616, 1995.
Mutlu, H., Köse, N., Akkemik, Ü., Aral, D., Kaya, A., Manning, S. W., Pearson, C. L., and Dalfes, N.: Environmental and climatic signals from stable isotopes in Anatolian tree rings, Turkey, Reg. Environ. Change, 12, 559–570, doi:10.1007/s10113-011-0273-2, 2011.
Naumann, C.: Vom Goldenen Horn zu den Quellen des Euphrat: Munich, Leipzig, 1893.
Nicault, A., Alleaume, S., Brewer, S., Carrer, M., Nola, P., and Guiot, J.: Mediterranean drought fluctuation during the last 500 years based on tree-ring data, Clim. Dynam., 31, 227–245, 2008. Orvis, K. H. and Grissino-Mayer, H. D.: Standardizing the reporting of abrasive papers used to surface tree-ring samples, Tree-Ring Res., 58, 47–50, 2002.
Quataert, D.: The age of reforms, 1812–1914, An economic and social history of the Ottoman Empire, 1300–1914, edited by: In-alcık, H. and Quataert, D., Syndicate of the University of Cam-bridge, 759–934, 1996.
Pauling, A., Luterbacher, J., Casty, C., and Wanner, H.: Five hun-dred years of gridded high-resolution precipitation reconstruc-tions over Europe and the connection to large-scale circulation, Clim. Dynam., 26, 387–405, 2006.
Roberts, N., Jones, M. D., Benkaddour, A., Eastwood, W. J., Fil-ippi, M. L., Frogley, M. R., Lamb, H. F., Leng, M. J., Reed, J. M., Stein, M., Stevens, L., Valero-Garcés, B., and Zanchetta, G.: Stable isotope records of Late Quaternary climate and hydrology from Mediterranean lakes: the ISOMED synthesis, Quaternary Sci. Rev., 27, 2426–2441, 2008.
Roberts, N., Moreno, A., and Valero-Garces, B. L.: Palaeolimno-logical evidence for an east-west climate see-saw in the Mediter-ranean since AD 900, Global Planet. Change, 84, 23–34, 2012. Sánchez-López, G., Hernández, A., Pla-Rabes, S., Trigo, R. M.,
Toro, M., Granados, I., Sáez, A., Masqué, P., Pueyo, J. J., Rubio-Inglés, M. J., and Giralt, S.: Climate reconstruction for the last two millennia in central Iberia: The role of East Atlantic (EA), North Atlantic Oscillation (NAO) and their interplay over the Iberian Peninsula, Quaternary Sci. Rev., 149, 135–150, 2016. Server, M.: Evaluation of an oral history text in the context of social
memory and traditional activity, Milli Folklor 77, 61–68, 2008 (in Turkish).
Seyf, A.: Middle Eastern demographic trend in the nineteenth cen-tury: A critical note, Middle East Stud., 21, 33–44, 1985. Speer, J. H.: Fundamentals of Tree-Ring Research, University of
Arizona Press, Tucson, 2010.
St. George, S.: An overview of tree-ring width records across the Northern Hemisphere, Quaternary Sci. Rev., 95, 132–150, 2014. St. George, S. and Ault, T. R.: The imprint of climate within
north-ern hemisphere trees, Quatnorth-ernary Sci. Rev., 89, 1–4, 2014. Stokes, M. A. and Smiley, T. L.: An Introduction to Tree-ring
Dat-ing, The University of Arizona Press, Tucson, 1996.
Till, C. and Guiot, J.: Reconstruction of precipitation in Morocco since A D 1100 based on Cedrus atlantica tree-ring widths, Qua-ternary Res., 33, 337–351, 1990.
Touchan, R., Garfin, G. M., Meko, D. M., Funkhouser, G., Erkan, N., Hughes, M. K., and Wallin, B. S.: Preliminary reconstruc-tions of spring precipitation in southwestern Turkey from tree-ring width, Int. J. Clim., 23, 157–171, 2003.
Touchan, R., Xoplaki, E., Funkhouser, G., Luterbacher, J., Hughes, M. K., Erkan, N., Akkemik, Ü., and Stephan, J.: Reconstruction of spring/summer precipitation for the Eastern Mediterranean
from tree-ring widths and its connection to large-scale atmo-spheric circulation, Clim. Dynam., 25, 75–98, 2005a.
Touchan, R., Funkhouser, G., Hughes, M. K., and Erkan, N.: Stan-dardized Precipitation Index reconstructed from Turkish ring widths, Clim. Change, 72, 339–353, 2005b.
Touchan, R., Akkemik, Ü., Huges, M. K., and Erkan, N.: May–June precipitation reconstruction of southwestern Anatolia, Turkey during the last 900 years from tree-rings, Quaternary Res., 68, 196–202, 2007.
Turkes, M.: Spatial and temporal analysis of annual rainfall varia-tions in Turkey, Int. J. Clim., 16, 1057–1076, 1996a.
Turkes, M.: Meteorological drought in Turkey: a historical per-spective, 1930–1993, in: Drought Network News, International Drought Information Center, University of Nebraska, 8, 17–21, 1996b.
Turkes, M.: Vulnerability of Turkey to desertification with respect to precipitation and aridity conditions, Turk. J. Engineer. Environ Sci., 23, 363–380, 1999.
Turkes, M. and Sumer, U. M.: Spatial and temporal patterns of trends variability in diurnal temperature ranges of Turkey, Theor. Appl. Clim., 77, 195–227, 2004.
Ülgen, U. B., Franz, S. O., Biltekin, D., Çagatay, M. N., Roeser, P. A., Doner, L., and Thein, J.: Climatic and environmental evo-lution of Lake Iznik (NW Turkey) over the last ∼ 4700 years, Quatern. Int., 274, 88–101, 2012.
Xoplaki, E., Luterbacher J., Paeth H., Dietrich, D., Grosjean, M., and Wanner, H.: European spring and autumn temperature vari-ability and change of extremes over the last half millennium, Geophys. Res. Lett., 32, L15713, doi:10.1029/2005GL023424, 2005.
Wahl, E. R., Anderson, D. M., Bauer, B. A., Buckner, R., Gille, E. P., Gross, W. S., Hartman, M., and Shah, A.: An archive of high-resolution temperature reconstructions over the past two millennia, Geochem. Geophy. Geosy., 11, Q01001, doi:10.1029/2009GC002817, 2010.
Wick, L., Lemcke, G., and Sturm, M.: Evidence of Lateglacial and Holocene climatic change and human impact in eastern Ana-tolia: high-resolution pollen, charcoal, isotopic and geochemi-cal records from the laminated sediments of Lake Van, Turkey, Holocene, 13, 665–675, 2003.
Wigley, T. M. L., Briffa, K. R., and Jones, P. D.: On the average value of correlated time series with applications in dendrocli-matology and hydrometeorology, J. Clim. Appl. Meteorol., 23, 201–213, 1984.
Woodbridge, J. and Roberts, N.: Late Holocene climate of the East-ern Mediterranean inferred from diatom analysis of annually-laminated lake sediments, Quaternary Sci. Rev., 30, 3381–3392, 2011.
Yamaguchi, D. K.: A simple method for cross-dating increment cores from living trees, Can. J. Forest Res., 21, 414–416, 1991. Zücher, E. J.: Turkey: A modern history. Oxford Publishing