HAL Id: hal-02576845
https://hal-amu.archives-ouvertes.fr/hal-02576845
Submitted on 2 Nov 2020
HAL is a multi-disciplinary open access archive for the deposit and dissemination of sci-entific research documents, whether they are pub-lished or not. The documents may come from teaching and research institutions in France or abroad, or from public or private research centers.
L’archive ouverte pluridisciplinaire HAL, est destinée au dépôt et à la diffusion de documents scientifiques de niveau recherche, publiés ou non, émanant des établissements d’enseignement et de recherche français ou étrangers, des laboratoires publics ou privés.
Who’ll stop lying under oath? Empirical evidence from
tax evasion games
Nicolas Jacquemet, Stephane Luchini, A. Malézieux, Jason F. Shogren
To cite this version:
Nicolas Jacquemet, Stephane Luchini, A. Malézieux, Jason F. Shogren. Who’ll stop lying under oath? Empirical evidence from tax evasion games. European Economic Review, Elsevier, 2020, 124, pp.103369. �10.1016/j.euroecorev.2020.103369�. �hal-02576845�
Who’ll stop lying under oath?
Empirical evidence from Tax Evasion Games
∗N. Jacquemet† S. Luchini‡ A. Malézieux§ J.F. Shogren¶
October 2019
Abstract
Using two earned income/tax declaration experimental designs we show that only partial liars are affected by a truth-telling oath, a non-price commitment device. Under oath, we see no change in the number of chronic liars and fewer partial liars. Rather than smoothly increasing their compliance, we also observe that partial liars who respond to the oath, respond by becoming fully honest under oath. Based on both response times data and the consistency of subjects when several compliance decisions are made in a row, we show that partial lying arises as the result of weak preferences towards profitable honesty. The oath only transforms people with weak preferences for lying into being committed to the truth.
Keywords: Part-time Lying, honesty, oath, commitment, Tax evasion. JEL classification: C9 ; H26.
∗We thank James Alm, Cécile Bazart, Todd Cherry, Yannick Gabuthy, Erich Kirchler, Stefano Palminteri,
Drazen Prelec, Angela Sutan, Miriam Teschl, Claire Vandendriessche, Marie-Claire Villeval and participants at several seminars and conferences for their comments and the helpful discussions from which we benefited in the development of this work. We also thank Kene Boun My for his assistance in running the experiments. Jason Shogren thanks the University of Alaska-Anchorage for their support while working on this research. Stéphane Luchini thanks the Wissenschaftszentrum Berlin fur Sozialforschung (WZB) for their support while working on this research. Antoine Malézieux thanks the Tax Administration Research Centre (TARC) for their support while working on this research. The authors thank the Conseil Régional de Lorraine for its financial support.
†Paris School of Economics and University Paris 1 Panthéon-Sorbonne. CES, 106 Bd. de l’hôpital, 75013 Paris,
France. [email protected]
‡Aix-Marseille University (Aix-Marseille School of Economics), CNRS and EHESS. Centre de la Vieille Charitée,
2 Rue de la Charité, 13236 Marseille, France. [email protected]
§CEREN, EA 7477, Burgundy School of Business, Université Bourgogne Franche-Comté, 29 Rue Sambin, 21000
Dijon, France. [email protected]
¶Department of Economics, University of Wyoming, Laramie, WY 82071-3985, United States.
“The sad truth is [...] that most evil is done by people who never make up their minds to be good or evil.”
Hannah Arendt. The life of the mind, p. 180.
1 Introduction
Dishonesty erodes opportunities for economic gains in business and society.1 Scandals like
En-ron and the 2008 financial crisis have prompted the promotion of truth-telling oaths–a non-price commitment device, as well as similar pledges, or codes of conduct, like the MBA oath or Dutch Bankers oath (see e.g., McCabe, Trevino, and Butterfield, 2002; Shu, Mazar, Gino, Ariely, and Bazerman, 2012; Cohn, Fehr, and Maréchal, 2014).2 Empirical evidence confirms that when people
voluntarily commit to honesty through a solemn oath, they tell the truth most of the time, holding the lie constant (see e.g., Jacquemet, Luchini, Rosaz, and Shogren, 2018).3 The rationale is that
the oath will help promote greater economic exchange by triggering a person’s intrinsic commit-ment to telling the truth (i) by reducing the ability to rationalize a lie (i.e., self-justification), and (ii) by coupling the desire for a positive self-image together with the desire for consistency (Mazar, Amir, and Ariely, 2008). But not all lies are the same—a small lie is easier than a big lie (Lundquist, Ellingsen, Gribbe, and Johannesson, 2009; Gneezy, Kajackaite, and Sobel, 2018; Abeler, Nosenzo, and Raymond, 2019). And not all liars are the same—some people lie all the time, some never, and some waver between lying and the truth, depending. The open question we address is who actually responds to an oath with honesty, and why.
Using an earned income/tax declaration lab experiment, we find that the oath only affects partial liars, not full liars.4 What is more, partial liars do not react to the oath by smoothly
increasing their level of compliance under oath (as a homogeneous change in the cost of lying would predict), but rather jump to full compliance. We argue this is consistent with partial compliance
1Examples of recent work exploring the theoretical and behavioral underpinnings of deception, cheating, lying
and fraud include: Gneezy (2005); Kartik (2009); Ariely (2012); Fischbacher, Hertwig, and Bruhin (2013); Akerlof and Shiller (2015); also see Irlenbusch and Villeval (2015); Jacobsen, Fosgaard, and Pascual-Ezama (2018) for surveys.
2There are many examples of oaths as a commitment device in non-market domains, including the University
of Cambridge’s L’Appel de Paris (the Paris Pledge for Action, see http://parispledgeforaction.org/) to limit global temperature rise to less than 2 degrees Celsius (see e.g., Stern, 2016). Another example includes the “1% For The Planet’s ]OathOfAction”, which asks for a commitment for positive environmental impacts (https:// www.onepercentfortheplanet.org/oathofaction), and the Oath for the Ocean to “solemnly swear that we will faithfully speak up for the ocean, and will to, the best of our ability, preserve, protect and defend the Constitution of our Ocean” (https://oceanconservancy.org/blog/2017/01/22/take-the-oath/).
3Also see Koessler, Torgler, Feld, and Frey (2019), who show that a promise works as a screening device when
compliance with the promise-taking task is low.
4We use the tax evasion game for three reasons. First, this class of games is recognized in the literature to induce
significant lying behaviour (Alm, 2012). Second, it is also established that signed pledges help curb lying in this kind of game (see Shu, Mazar, Gino, Ariely, and Bazerman, 2012, and our Experiment 1). Third, the tax evasion game has excellent external validity and it transfers easily into real world applications (Mascagni, 2018).
arising from weak preferences for profitable dishonesty—partial liars seem to lack clarity about how to process profitable dishonesty, which suggests they were neither committed to lying nor to being truthful 100%. Their preferences were fungible—and the oath acted as a moral anchor, so that we observe fewer partial liars and more full truth tellers under oath than without the oath.
Our evidence is based on two experiments that compare income reporting behavior with and without an oath. Each experiment provides an alternative identification strategy for the relation-ship between compliance and the strength of preferences. In the first experiment, we observe that the response time of partial liars was longer than for either full liars or the fully honest, which suggests partial liars found their decision more challenging (Krajbich, Bartling, Hare, and Fehr, 2015).5 The second experiment used a repeated trial design to assess whether liars behave
con-sistently by always declaring the same income or whether they change their mind—a behavioral measure of the strength of preference for dis/honesty (Rustichini, 2008).6 Now we observe that
partial liars are the most indecisive, changing their declarations across rounds. The oath has the expected positive effect on declaration, and, most importantly, the oath mainly decreases the proportion of subjects who change their decision across rounds, transforming undecided partial compliers into certain full compliers. Both with and without an oath, only full liars and full com-pliers take the same decision across all rounds; but the share of full comcom-pliers drastically increases under oath.
Commitment-based devices like the oath are aimed at fostering honesty. But these devices are unlikely to change the behavior of decision-makers with clear and strong preferences towards profitable dishonesty. Targeting this subgroup of liars likely implies that a policy maker will need to find a mix of non-price commitment devices and financial incentives—with the potential risk of crowding-out the general "integrity" effect of non-price devices on the rest of the population.
2 Truth-telling oath procedure
We begin by describing the motivation and steps used in our oath procedure. In general, the design is identical to the baseline treatment except for the pre-experiment oath procedure. To ensure that the oath works in our experimental setting, our oath procedure uses insights from the social psychology theory of commitment (Kiesler, 1971; Joule and Beauvois, 1998). Experiments in social psychology have shown that commitment—the “binding of the individual to behavioral acts” (Kiesler and Sakumura, 1966, p.349)—is stronger when people comply freely and when
5Marketing research has long used response latency as a measure of the strength of preferences in value-based
choice tasks (see, e.g., Aaker, Bagozzi, Carman, and MacLachlan, 1980). This is reminiscent of Cartwright (1941)’s original finding that response time is longer when choice is made experimentally more difficult. Slower response times may also be associated with weaker preferences due to conflicting behavioral decision rules. Achtziger and Alós-Ferrer (2014), for example, show both in theory and with lab evidence that people take more time making risky decisions when their reinforced learning and Bayesian updating are misaligned.
commitment is signed. For commitment to be effective, moreover, people need to sign before self-reporting private information rather than afterwards; see for example Shu, Mazar, Gino, Ariely, and Bazerman (2012). The oath procedure implemented in the experiment closely follows the design of Jacquemet, Joule, Luchini, and Shogren (2013).
After filling out the consent form, the monitor asks each subject to sign a solemn oath form which states that he or she “swear upon [his/her] honor that, during the whole experiment, [he/she] will tell the truth and provide honest answers” (in bold in the original form). The Université de Strasbourg logo on the top of the form and the address at the bottom signal to each subject that the oath is an official document. The topic designation and the research number are added so to ensure credibility. Before the subject reads the form, the monitor tells him or her that (i) she or he is free to sign the oath or not, and (ii) participation and earnings in the subsequent experiment are not conditional on signing the oath. This independence is to ensure that we measure the direct effect of the oath and not the indirect effect of future retaliation or punishment. The monitor does not tell the subject what the impeding experiment will be about before proposing that he or she takes the oath. After the subject reads and signs (or does not sign) the oath form, he or she is thanked and invited to enter the experimental lab. We wrote a script for monitors, ensuring that they use exactly the same wording to standardize the procedure. The monitor never leaves that room at any time. A second monitor is on duty in the lab to prevent communication between subjects already presented with the oath. Subjects waiting for their turn cannot see or hear what is happening at the oath-desk. An important feature of the procedure is to be designed in such a way that signing the oath is free, but virtually everybody agree to sign (which is confirmed by the compliance rates observed in the two experiments, that are both higher than 90% as reported below). This allows us to investigate the change in behavior induced by signing a truth-telling oath, rather than its combined effect with the possible self-selection associated with an oath procedure achieving a lower compliance rate.
3 Experiment 1: One-shot tax declaration
Experiment 1 followed a two step design—earned income and declared income. First, to strengthen external validity, the experiment starts with a real effort task in which subjects earn their income. The earned-income task is similar to Alm, Cherry, Jones, and McKee (2012): subjects sort numbers in ascending order in a 3 * 3 matrix filled with digits generated in random order. We compute the earnings based on the time taken to complete the task—the quicker a subject is, the more money s/he earns, according to the following compensation rule (labeled in an Experimental Currency Unit): 150 (time ⇥ 13). The task is repeated 5 times and earned income is the sum of earnings from all 5 tasks. Second, subjects are asked to “declare the amount of income they earned at the previous stage” (see Cadsby, Maynes, and Trivedi, 2006, for a discussion about the framing of the income reporting step). They can declare any amount from no income up to 100% of earned
income. We recorded the time taken by each subject to state their income declaration. The tax rate in the experiment is 35% and the money declared through taxes is to be donated to the World Wide Fund for Nature (WWF). Donations are certified directly by the WWF, with certificates sent directly to the participants by email. Last, subjects are presented with debriefing questionnaires to collect their socio-demographics. We ran six sessions (three for each condition), each with 19 to 24 subjects. A total of 129 subjects participated, 75 males and 54 females, with mean age of 23. Sixty-six subjects took part in the baseline experiment and 63 in the oath treatment. All subjects but one signed the oath; this 98% acceptance rate means that there is no issue of selection in the oath treatment. Each session lasted about 1 hour, with an average payoff of 20 euros (17 euros directly given to the participants and 3 euros donated to WWF), including a 5 euro show-up fee.
3.1 Tax evasion under oath
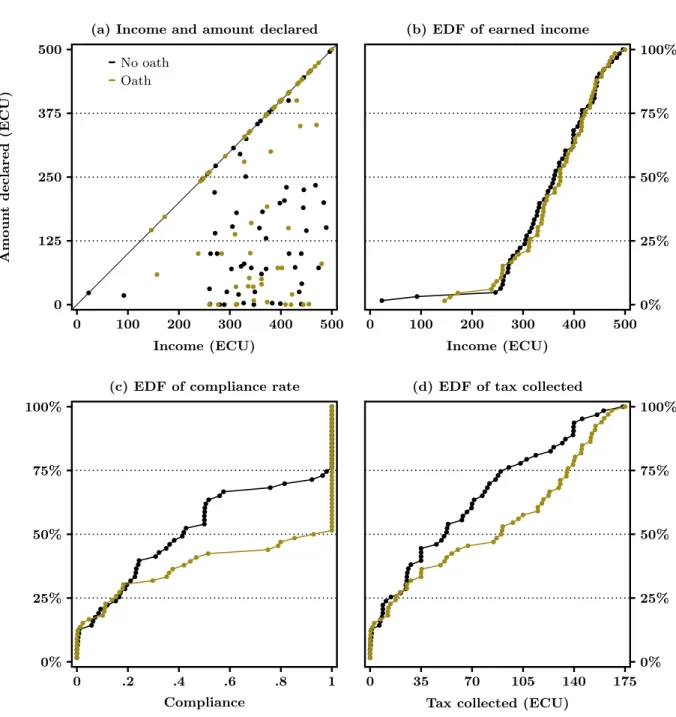
Figure 1 summarizes the main outcomes from this experiment. The raw data is presented in Figure 1.a, which provides a scatter plot of earned income on the x-axis and the amount de-clared on the y-axis by treatment. We observe a widespread under-declaration in the baseline: 74.6% of subjects under-declare their income. The average compliance rate (the ratio between the amount declared and the amount of income earned) is 49.0%. Now consider behavior in the oath treatment—here we see the oath significantly improves compliance. The average compliance rate in the oath treatment is 63.2% and is significantly higher than in the baseline according to a t-test (p = .047). As shown in Figure 1.b, this increase cannot be explained by a difference in earnings: the empirical distribution functions (EDF) of earnings are almost identical in the baseline and oath treatments—confirming that the oath has no effect per se on the performance at the earned income task.
Figure 1.c presents the EDF of compliance by treatment. The EDF of compliance in the oath treatment first-order dominates the EDF in the baseline (p = .011).7 The oath induces partial
liars to fully declare their income. While the bottom end of the compliance distribution is similar in both treatments (20.6% of participants declare less than 10% of their income in the baseline and 16.7% do so when they are under oath; p = .724), there are significantly fewer oath treatment subjects in the 10%-90% range of compliance: 31.8% in the oath treatment against 49.2% in the baseline (p = .067). It is interesting to note that the compliance rate of subjects who belong to this compliance range under oath is similar to that in the no oath treatment. The mean (median) compliance for partial compliers in the 10%-90% range without the oath is 37.41 (36.4); it amounts to 35.2 (36.6) under oath (see detailed statistics in the Appendix, Section A). The lower share of subjects observed in the medium compliance group under oath mainly comes from a change at the top of the compliance distribution—compliance rates above 90%—where we observe 30.1% of
7Our statistical test is a bootstrap version of the univariate Kolmogorov-Smirnov (KS) test. This modified test
provides correct coverage even when the distributions being compared are not entirely continuous and, unlike the traditional KS test, allows for ties (see Abadie, 2002; Sekhon, 2011).
Figure 1: Tax evasion behavior in Experiment 1, by treatment
(a) Income and amount declared
A m ou nt d ec la re d (E C U ) 0 125 250 375 500 0 100 200 300 400 500 Income (ECU) No oath Oath
(b) EDF of earned income
0% 25% 50% 75% 100% 0 100 200 300 400 500 Income (ECU) (c) EDF of compliance rate
0% 25% 50% 75% 100% 0 .2 .4 .6 .8 1 Compliance
(d) EDF of tax collected
0% 25% 50% 75% 100% 0 35 70 105 140 175
Tax collected (ECU)
subjects in the baseline as compared to 51.5% under oath (p = .022). Moreover, under oath, 50% of subjects fully comply to the request and declare all their earnings, against 25.4% in the baseline (p = .007).
The magnitude of the change in tax collected as a result of this increase in compliance under oath depends on the level of income of people who are more honest under oath. Figure 1.d replicates the EDF comparison across treatments provided in Figure 1.c, but in terms of tax collected rather
than compliance rate—which combines the earned income and the compliance decision of each subject. The increase in compliance has large consequences on the amount of tax collected from the subjects. The median amount of the individual tax collected increases from 52.5 ECU in the baseline to 90.3 ECU under oath, and the average tax bill from 60.9 ECU to 90.9 ECU. The EDF of the amount of tax collected under oath is shifted to the right as compared to the baseline over the entire range of individual amounts (first order stochastic dominance is statistically significant, with p = .012).
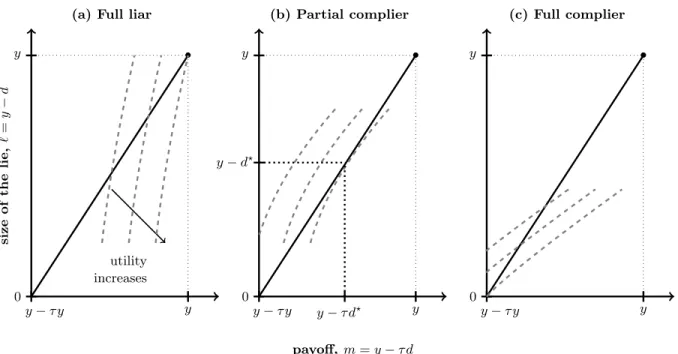
The behavioral results from this experiment are two-fold. First, only partial compliers respond to the oath: the share of partial compliers in the 10%-90% range decreases, and those who remain partial compliers under oath do not declare more income; while the share of low compliers (under 10%) remains stable. Second, those partial compliers who do respond to the oath do not just declare more income. Rather, they comply fully by declaring their entire income, no matter where they would have been in the compliance distribution without an oath. To illustrate the implications of these results in the context of a cost of lying model, we show how the Gneezy, Kajackaite, and Sobel (2018) model operates in the tax evasion game. In this game, each subject receives an income y and then decides how much they want to report, which we denote d. The model assumes quasi-linear preferences over money (m = y ⌧d, in which ⌧ denotes the tax rate) and the size of the lie, ` = y d, such that subjects always prefer more money to less but at the same time also experience a direct psychological cost of lying:8
u(m, `) = m c(`) (1)
The psychological cost of lying c(`) is increasing in ` and such that c(0) = 0—telling the truth is costless.
Figure 2 illustrates how such preferences can account for full lying, partial compliance, and full compliance in a tax evasion game. Each graph displays the indifference curves of a represen-tative subject, defined over the two utility arguments. Since over-reporting is excluded by design, compliance is bounded above and below (0 d y), which defines the range of possible values of both the size of the lie and the monetary payoffs. The black line (whose slope is 1/⌧) describes the choice set—i.e., the (m, `) bundles that are feasible. Utility is increasing in m and decreasing in `, so that indifference curves have a positive slope and utility increases towards the south-east corner. As discussed in Appendix B, this model can only account for both full compliance and partial compliance if (i) the marginal cost of a zero lie is non-zero (otherwise there would always exist an infinitely small lie that would be preferred to full compliance) and (ii) the cost function is convex (otherwise only corner solutions would maximize utility). Figure 2.a describes the choice of a full liar: the cost of lying is so small (resulting in very steep indifference curves) that the
8Note a subject’s income is perfectly observed by the experimenter here. Since subjects face no uncertainty
over whether they are perceived as honest, we do not account for the reputational costs component of Gneezy, Kajackaite, and Sobel (2018) utility arising from, e.g., social image (see also Abeler, Nosenzo, and Raymond, 2019, for a review of lying aversion models).
Figure 2: Optimal compliance in a cost of lying tax evasion model
(a) Full liar
size of th e lie, ` = y d y ⌧ y 0 y y • utility increases (b) Partial complier payoff, m = y ⌧ d y ⌧ y 0 y y • y d? y ⌧ d? (c) Full complier y ⌧ y 0 y y •
largest lie maximizes utility. Figure 2.c plots the other extreme case, in which the cost of lying results in flat indifference curves, leading to fully honest reports. Last, Figure 2.b illustrates the situation of a subject endowed with intermediate values of the cost of lying: the convexity of the cost function leads to a unique interior solution maximizing utility.
To assess the effect of the oath on such lying preferences, we estimate the distribution of morality parameters ✓i among subjects from each treatment based on the specification: c(`|✓i) =
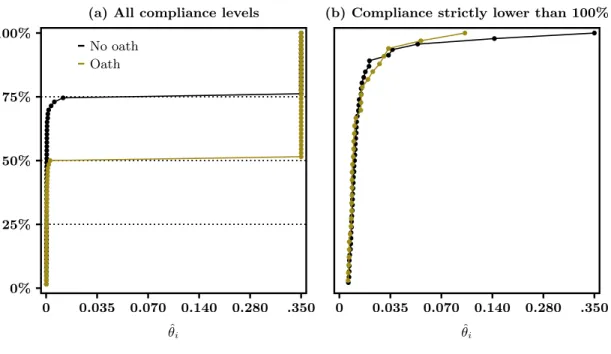
✓i(`2+`)(see Appendix B for the details of the computation). Figure 3 displays the results. Recall
that partial liars who react to the oath respond by becoming fully honest under oath rather than smoothly increasing their compliance. As shown in Figure 3.a, this response is accounted for by the model through a dramatic shift to the right in the distribution of the cost of lying induced by the oath. This shift is due to partial compliers who happen to respond to the oath—and do so by jumping to fully honest reports rather than trading-off some truth against some monetary gains. Figure 3.b focuses on the subset of subjects who do not fully comply: the comparison confirms that full liars and the remaining partial liars under oath do not respond to the oath (the EDF in 3.b are statistically the same, p = .449).
Our working hypothesis to such a shift in the cost of lying is that partial compliers in our experiment have weak preferences: it is difficult for them to choose between truth-telling and profitable dishonesty, such that they end up partially lying. When they are under oath, they switch their behavior to full compliance because discriminating between truth-telling and profitable dishonesty is made extrinsically easier by the oath.
Figure 3: EDF of the revealed morality parameter by treatment
(a) All compliance levels
0% 25% 50% 75% 100% 0 0.035 0.070 0.140 0.280 .350 ˆ ✓i No oath Oath
(b) Compliance strictly lower than 100%
0 0.035 0.070 0.140 0.280 .350
ˆ ✓i
Our challenge is to measure the “strength of preferences” to test this hypothesis. One popular approach to understand weak preferences is to study response times. Krajbich, Bartling, Hare, and Fehr (2015) have shown, for example, that response time decreases with the strength of preferences in dictator games and public good games. When the subjective utility values of different options are close to one another, subjects are slower and more indecisive; whereas subjects will choose quickly an option that they value clearly more than any other.
We can best explain the relationship between the strength of preferences and response time through the lens of the Drift Diffusion Model (DDM), which has gained traction within the neuroe-conomics literature (e.g., Krajbich and Rangel, 2011; Krajbich, Lu, Camerer, and Rangel, 2012). In the DDM model (initiated by Ratcliff, 1978), the cognitive process underlying decision making consists of (internally) accumulating noisy evidence in favor of the different alternatives, until a pre-defined decision threshold is reached for one of the options, i.e. when the person is confi-dent enough. Fudenberg, Strack, and Strzalecki (2018) extend this framework to an endogenous stopping rule by assuming that both the sign of preferences and its intensity is unknown to the decision maker. Here, a decision actually happens when the cost of waiting further exceeds the benefit of making a better decision later thanks to additional information from future signals. In this context, a signal that preferences are strong, in favor or against full compliance, is more likely to occur if preferences are actually strong, and is thus taken seriously even if it happens early. When a decision-maker has weak preferences, a signal that preferences are weak will be interpreted differently depending on when is is received. Such a signal will be interpreted as uninformative if
received early in the process; while it is more likely interpreted as an informative signal of true weak underlying preferences the later it is received. This implies that such a model predicts a hump-shape relationship between compliance and response time, in which partial compliance and longer response time are correlated through weak preferences.9 The next section provides a test
of this hypothesis using the distribution of response times observed in the experiment.
3.2 Compliance and response time
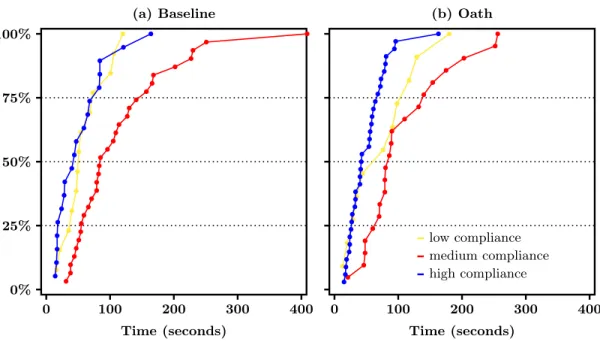
Response times data in each condition show a clear non-monotonic relationship between compli-ance and response time. In the baseline, a longer response time, with a median of 85 seconds, is observed for subjects whose compliance is between 10% and 90%. Median response time is only 51 seconds for compliance rates lower than 10% and 44 seconds for compliance higher than 90%. If we further restrict the analysis to full liars and full compliers, we find that their median response time is 21 seconds and 42 seconds. Figure 4.a plots the EDF of response time for the three groups of subjects, compliance below 10% (low compliance), compliance above 90% (high compliance) and compliance in between these two values (medium compliance). The EDF of response time for the medium compliance group is to the left of the EDF for both the low compliance group (p = .043) and the high compliance group (p < .001), while the EDF of the low and high compli-ance groups are not statistically different (p = .772). In line with Krajbich, Bartling, Hare, and Fehr (2015), these variations in response times suggest that partial compliance arises due to a lack of discriminability between truth-telling and profitable dishonesty: these subjects face a harder decision problem, which takes more time to solve. Subjects who either fully comply, or fully evade, on the opposite, have strong enough preferences and are able to make up their mind quickly.
Now turning to the oath treatment, we observe that response times exhibit the same non monotonic pattern to that observed in the baseline. Median response time when compliance is lower than 10% is 76 seconds (as compared to 51 seconds in the baseline). Median response time in the medium compliance group under oath is 86 seconds as compared to 85 seconds in the baseline. Median response time in the high compliance group is 42.5 seconds under oath and 44 seconds in the baseline. As shown in Figure 4.b, the non-monotonic pattern of the EDF of response times in the oath treatment according to compliance intensity is similar to that observed in the baseline (based on KS tests, the EDF of response times is statistically the same in both treatments among high compliers, p = .699, medium compliers, p = .987, as well as low compliers, p = .389). Between groups tests in the oath treatment show that partial liars have the slowest decision process. The EDF of response times of partial liars first order dominates that of low compliers (p = .043) and high compliers (p < .001). Although the decision time of full evaders is a bit longer under oath as compared to the baseline, which can be explained by the dissonance between their preferences
9In their study of the optimal allocation of time between several decision tasks, Chabris, Laibson, Morris,
Schuldt, and Taubinsky (2009) document a similar hump-shape relationship between the strength of preferences and decision times.
Figure 4: Response times in Experiment 1 according to the intensity of compliance (a) Baseline 0% 25% 50% 75% 100% 0 100 200 300 400 Time (seconds) (b) Oath 0 100 200 300 400 Time (seconds) low compliance medium compliance high compliance
and being under oath, it remains statistically identical to the distribution of response times among full compliers (p = .773). Full compliers, which are twice as much under oath, and low compliers, both decide more quickly than partial liars.
In sum, we observe that only subjects endowed with very specific preferences react to a truth-telling oath. Subjects who do not react to the oath both (i) exhibit unambiguous preferences in favor of either compliance or evasion and (ii) make up their mind quickly when reporting their income. On the opposite, subjects who comply only partially are slow, strongly react to the oath and those who do become quick full compliers. In the next section, we confirm this interpretation by studying an alternative behavioral measure of the strength of preferences.
4 Experiment 2: Repeated tax declaration
In Experiment 1, the truth-telling oath had the predicted positive effect on compliance, but only on the partial liars—those subjects who partially complied in the baseline. These partial compliers moreover took more time to make up their mind about their declaration, suggesting that they have difficulty processing profitable dishonesty. Experiment 2 aims to get further insights on this phenomenon by using an alternative behavioral measure of the strength of preferences for profitable dishonesty.
Following Agranov and Ortoleva (2017), we repeat the decision task and use the consistency of decisions made in a row at the individual level as a measure of the revealed strength of preference– an indecisive person, who often changes her mind about available options, having weak preferences
Figure 5: Tax evasion behavior in Experiment 2, by treatment
(a) Income and amount declared
M ea n am ou nt d ec la re d 0 125 250 375 500 0 100 200 300 400 500 Income (ECU) No oath Oath
(b) EDF of earned income
0% 25% 50% 75% 100% 0 100 200 300 400 500 Income (ECU) (c) EDF of compliance rate
0% 25% 50% 75% 100% 0 .2 .4 .6 .8 1 Mean compliance
(d) EDF of tax collected
0% 25% 50% 75% 100% 0 35 70 105 140 175
Tax collected (ECU)
(also see, e.g., Rustichini, 2008, who shows in the context of stochastic choice models that how frequently an option is chosen reveals how strong preferences are in favor of this option). This experiment is identical to Experiment 1 with one exception—in step two, we repeat the declaration stage five times. We make only one decision binding by telling subjects that we will select one declaration at random to determine their net income (i.e., their experimental earnings) and their donation to WWF. All five income-reporting decisions relate to the exact same level of earned
Figure 6: EDF of compliance in Experiments 1 and 2, by treatment (a) Baseline 0% 25% 50% 75% 100% 0 .2 .4 .6 .8 1 (mean) Compliance Experiment 1 Experiment 2 (b) Truth-telling oath 0% 25% 50% 75% 100% 00 .2 .4 .6 .8 1 (mean) Compliance
income. The decision context is kept constant and the sequence elicits the subjects’ degree of behavioral indecision. Our subject pool is again divided into two treatments: baseline and oath. Our analysis relies on four experimental sessions (two for each condition). We had a total of 87 subjects, 38 males and 49 females, with mean age equal to 22. In the oath condition, 91.1% of subjects signed the oath (4 out 42 decided not to sign). Each session lasted about 1 hour, with an average payoff of 20 euros (17 euros directly given to the participants and 3 euros donated to WWF), including a 5e show-up fee.
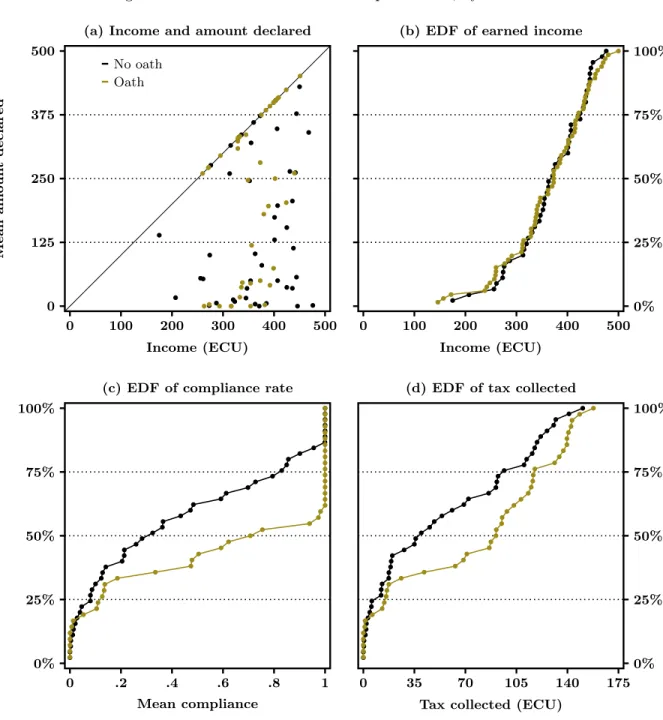
Figure 5 presents the results. To ease comparison with Experiment 1, we report the mean individual behavior across rounds. Figure 5.a presents a scatter plot of the earned income against the mean amount declared individually across the 5 rounds. Again, we see widespread under-declaration in the baseline treatment while the oath has a significant positive effect on compliance. Mean compliance across rounds is 43.0% in the baseline and 60.1% under oath (p = .051). As shown in Figure 5.b, the effect of the oath cannot be imputed to a difference in earnings between treatments. Figure 5.c presents the EDF of mean compliance by treatment. Again, the EDF of the truth-telling oath treatment first-order dominates the EDF of the baseline (p = .015). As in Experiment 1, we see that not all subjects respond to the oath: first-order dominance comes from a change at the upper end of the EDF. The share of subjects with a mean compliance rate lower or equal to 10% is 28.9% in the baseline and 19.0% in the oath treatment. For compliance rates between 10% and 90%, the shares are 51.1% in the baseline and 33.3% in the oath treatment. At the upper end, the share of subjects with a compliance rate above 90% are 20.0% and 47.6%.
Table 1: Proportion of consistent decisions, by treatment Number of consistent decisions
5 4 3 2 0 Total
Baseline(%) 20.0 11.1 15.6 8.9 44.4 100.0
Truth-telling oath(%) 54.7 11.9 4.8 2.4 26.2 100.0
Note. Consistent decisions are computed at the individual level as the number of times a subjects reports the exact same level of income. The table reports the empirical distribution of this statistic in each treatment.
Subjects under oath are much more likely to comply fully in all rounds than subjects in the baseline: 40.5% do so, as compared with 13.3% in the baseline. Figure 5.d reports the EDF of the mean amount of tax collected based on this reporting behavior. The median amount of the individual mean tax collected increases from 39.8 ECU in the baseline to 91.1 ECU under oath, and the average tax bill from 55.0 ECU to 76.3 ECU. The EDF of the mean amount of tax collected under oath first order dominates the EDF observed in the baseline (p = .077).
Figure 6 complements the comparison by presenting the EDF of compliance in Experiment 1 together with the EDF of mean compliance across the 5 rounds of Experiment 2. Compliance behavior both in the baseline (Figure 6.a) and in the truth-telling oath treatment (Figure 6.b) are very similar, and not statistically different according to two-sided KS bootstrap tests (p = .453 in the baseline treatments, p = .810 in the oath treatments). This confirms that similar incentives are at work in the one-shot and repeated designs. Experiment 2 allows us to study the relationship between the oath and the strength of preferences, holding constant the basic behavioral underpinnings behind compliance.
We now turn to the measure of the strength of preferences provided by the consistency of decisions at the individual level. Table 1 reports the observed distribution of consistent decisions in each treatment. Only 20.0% of subjects in the baseline declare the same income five times whereas they are 54.7% in the oath treatment (p = .002). The change in the distribution induced by the oath is concentrated on the most inconsistent behaviors, i.e subjects making only three or less consistent decisions: they are 68.7% in the baseline and 33.4% in the oath treatment (as shown in the Appendix, Section C, these differences in consistency cannot be explained by differences in the level of earned income).
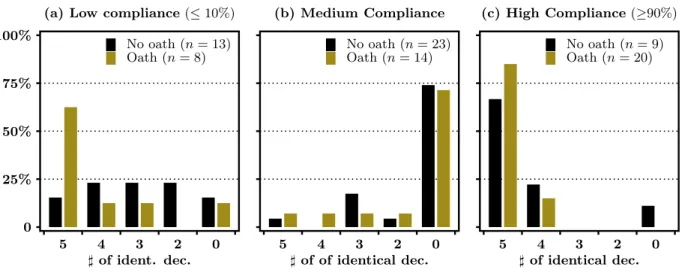
Figure 7 correlates inconsistency with the reporting decision: we split the sample into the three compliance groups defined in Section 3.2 (based on the average compliance computed at the individual level) and report the distribution of consistent decisions in the baseline and the oath treatments. In both treatments, partial liars are less consistent than both full liars or full compliers. The share of partial liars who make 5 different declarations is 73.9% in the baseline and 71.4% in the oath treatment. In the high compliance group, by contrast, 66.7% of subjects in the baseline, and 85.5% in the oath treatment, are fully consistent (all 5 decisions are the same).
Figure 7: Distribution of the number of identical decisions, by treatment
(a) Low compliance ( 10%)
0 25% 50% 75% 100% 5 4 3 2 0 ] of ident. dec. No oath (n = 13) Oath (n = 8) (b) Medium Compliance 5 4 3 2 0 ] of of identical dec. No oath (n = 23) Oath (n = 14) (c) High Compliance ( 90%) 5 4 3 2 0 ] of identical dec. No oath (n = 9) Oath (n = 20)
The remaining 15% are subjects with only two different decisions. In the low compliance group, 15.4% of subjects declare 5 times the same amount in the baseline, and 66.7% do so in the oath treatment. As shown in the Appendix, Section E, these differences can be statistically tested using first-order stochastic dominance between compliance groups. Bootstrap tests confirm that the distribution among medium compliers dominates both the distribution among low compliers (p < .001 in the baseline, p = .004 in the oath treatment) and among high compliers (p < .001 in the baseline, p < .001 in the oath treatment).10
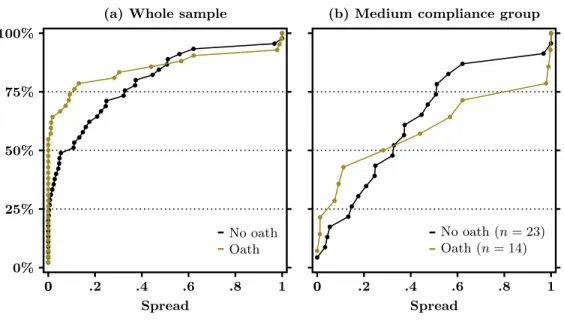
Partial lying (whether under oath or not) appears to be strongly associated with inconsistent decisions, while high and low compliance both emerge from highly consistent decisions. The oath moves medium compliers to the high compliance group, but does not change the consistency of partial liars who do not react to the oath. To assess the intensity of these inconsistencies, we now look at the spread of declarations, defined as the difference between the highest and lowest compliance levels across the 5 rounds for each subject. Figure 8.a reports the EDF of the individual spread of declarations by treatment both in the entire sample (Figure 8.a) and among medium compliers (Figure 8.b). The oath induces a significant decrease in spread in the overall sample: the EDF in the baseline first-order dominates the EDF in the oath treatment (p = .006). Among
10The distributions within each compliance group are moreover identical in the baseline and oath treatments for
both partial liars (p = .734) and high compliers (p = .304). Although the size of the sample is small (8 subjects), Figure 7.a shows a large increase in fully consistent decisions among low compliers (which is statistically significant,
p = .070). Interestingly, subjects in the low compliance group who are fully consistent always report no income in
both treatments (they also are the only subjects who decide to evade fully). This increase in the share of consistent decisions to evade fully is suggestive evidence that the oath helped subjects overcome their indecisiveness even if, in that case, this goes in the direction of a clearer preference for lying in full..
Figure 8: Individual spread of compliance, by treatment
(a) Whole sample
0% 25% 50% 75% 100% 00 .2 .4 .6 .8 1 Spread No oath Oath
(b) Medium compliance group
00 .2 .4 .6 .8 1
Spread
No oath (n = 23) Oath (n = 14)
partial liars, as shown in Figure 8.b, most of the distribution is concentrated at high levels of spread: the median spread is 0.5—which for instance implies that an average compliance equal to 50%arises from compliance decisions ranging between 25% and 75%. Only a few subjects appear at the bottom of the distribution: 4 subjects (17.4%) in the baseline, and 5 subjects (35.7%) in the oath treatment, have a spread lower than 0.1. Moreover, the oath has no influence on the distribution of the spread among medium compliers (p = .460).11
5 Conclusion
Over the centuries, societies have used the truth-telling oath to promote self-sacrificing honesty (Sylving, 1959). An oath is a non-price commitment device to generate sincere or honest behavior. But who is most likely to respond honestly to the oath—and to what extent can we rely on commitment-based devices to foster honesty? Using an earned income/tax declaration game, we show that full liars rarely changed their compliance behavior under the truth-telling oath. Rather, only partial liars (who neither fully comply, nor fully evade) are affected by the oath. When they do react to the oath, partial liars do not smoothly adjust their level of compliance, but rather they
11Subjective data, from the debriefing questionnaires, points in the same direction. Subjects who declare they
are more certain about their choices are less likely to be part-time liars than full-time compliers and liars (p = .009 in the baseline and p = .001 in the oath treatment). Overall, subjects in the oath treatment declare they are more certain than subjects in the baseline: as shown in Appendix D, the EDF of self-reported certainty in the oath treatment first-order dominates the EDF in the baseline (p = .047). This is mainly due to the greater number of totally certain subjects in the oath treatment.
jump discretely to full compliance.
We provide two different identification strategies to show that this behavioral pattern is related to the strength of preferences. We measure the strength of preferences for profitable dishonesty through the response latency in a one-shot game in experiment 1 and through consistency in a repeated task game in a second experiment. Partial liars are slow and are more inconsistent when repeated choices are elicited. This supports the idea that partial compliance arises from weak preferences. The oath provides a non-market anchor of real economic commitment to otherwise aimless truth-telling.
An important practical implication of our results is that people with strong and stable prefer-ences towards dishonesty are much less likely to respond to social institutions like a truth-telling oath. Institutions that rely on intrinsic motivation, as in our experimental setting, cannot be the only institutional means used to achieve honesty. A future avenue worth exploring is how adding external punishments for dishonesty (e.g., jail time or monetary fines for perjury) may help to im-prove the behavior of chronic liars.12 The obvious issue that arises is to what extent the existence
of sanctions might undermine the intrinsic motivation of otherwise motivated partial liars (Ryan and Deci, 2000; Gneezy, Meier, and Rey-Biel, 2011).
References
Aaker, D. A., R. P. Bagozzi, J. M. Carman, and J. M. MacLachlan (1980): “On Using Response Latency to Measure Preference,” Journal of Marketing Research, 17(2), 237–244.
Abadie, A. (2002): “Bootstrap Tests for Distributional Treatment Effects in Instrumental Variable Model,” Journal of the American Statistical Association, 97(457), 284–292.
Abeler, J., D. Nosenzo, and C. Raymond (2019): “Preferences for truth-telling,” Econometrica, 87(4), 1115–1153.
Achtziger, A., and C. Alós-Ferrer (2014): “Fast or Rational? A Response-Times Study of Bayesian Updating,” Management Science, 60(4), 923–938.
Agranov, M., and P. Ortoleva (2017): “Stochastic Choice and Preferences for Randomization,” Journal of Political Economy, 125(1), 40–68.
Akerlof, G. A., and R. J. Shiller (2015): Phishing for phools: The economics of manipulation and deception. Princeton: Princeton University Press.
Alm, J. (2012): “Measuring, explaining, and controlling tax evasion: lessons from theory, experiments, and field studies,” International Tax and Public Finance, 19(1), 54–77.
12This echoes the evidence gathered in the field by Bott, Cappelen, Sorensen, and Tungodden (2017), who
observe that appeal to morality letters impacts more the intensive margin of compliance, whereas manipulating the perception of chances of detection impacts the extensive margin.
Alm, J., T. L. Cherry, M. Jones, and M. McKee (2012): “Social programs as positive inducements for tax participation,” Journal of Economic Behavior & Organization, 84(1), 85–96.
Ariely, D. (2012): The Honest Truth About Dishonesty: How We Lie to Everyone–Especially Ourselves. HarperCollins Publishers, New York.
Bott, K. M., A. W. Cappelen, E. Sorensen, and B. Tungodden (2017): “You’ve got mail: a randomised field experiment on tax evasion,” Working Paper.
Cadsby, C. B., E. Maynes, and V. U. Trivedi (2006): “Tax compliance and obedience to authority at home and in the lab: A new experimental approach,” Experimental Economics, 9(4), 343–359. Calvet, C. R., and J. Alm (2014): “Empathy, sympathy, and tax compliance,” Journal of Economic
Psychology, 40(0), 62–82.
Cartwright, D. (1941): “The relation of the decision time to the categories of response,” American Journal of Psychology, 54, 174–196.
Chabris, C. F., D. Laibson, C. L. Morris, J. P. Schuldt, and D. Taubinsky (2009): “The allocation of time in decision-making,” Journal of the European Economic Association, 7(2), 628–637. Cohn, A., E. Fehr, and M. Maréchal (2014): “Business culture and dishonesty in the banking
industry,” Nature, 516, 86–89, doi:10.1038/nature13977.
Debreu, G. (1958): “Stochastic choice and cardinal utility,” Econometrica, 26, 440–444.
Fischbacher, U., R. Hertwig, and A. Bruhin (2013): “How to Model Heterogeneity in Costly Pun-ishment: Insights from Responders’ Response Times,” Journal of Behavioral Decision Making, 26(5), 462–476.
Fudenberg, D., P. Strack, and T. Strzalecki (2018): “Speed, Accuracy, and the Optimal Timing of Choices,” American Economic Review, 108(12), 3651–84.
Gneezy, U. (2005): “Deception: The Role of Consequences,” American Economic Review, 95(1), 384–394. Gneezy, U., A. Kajackaite, and J. Sobel (2018): “Lying Aversion and the Size of the Lie,” American
Economic Review, 108(2), 419–53.
Gneezy, U., S. Meier, and P. Rey-Biel (2011): “When and Why Incentives (Don’t) Work to Modify Behavior,” Journal of Economic Perspectives, 25(4), 191–210.
Irlenbusch, B., and M. C. Villeval (2015): “Behavioral ethics: how psychology influenced economics and how economics might inform psychology?,” Current Opinion in Psychology, 6, 87–92.
Jacobsen, C., T. R. Fosgaard, and D. Pascual-Ezama (2018): “Why Do We Lie? A Practical Guide To the Dishonesty Literature,” Journal of Economic Surveys, 32(2), 357–387.
Jacquemet, N., R.-V. Joule, S. Luchini, and J. F. Shogren (2013): “Preference Elicitation under Oath,” Journal of Environmental Economics and Management, 65(1), 110–132.
Jacquemet, N., S. Luchini, J. Rosaz, and J. F. Shogren (2018): “Truth-Telling under oath,” Management Science, 65(1), 426–438.
Joule, R., and J. Beauvois (1998): La soumission librement consentie. Presses Universitaires de France, Paris.
Kartik, N. (2009): “Strategic signaling with lying costs,” Review of Economic Studies, 76(4), 1359–1395. Kiesler, C. (1971): The psychology of commitment. Experiments liking behavior to belief. Academic
Press, New York.
Kiesler, C., and J. Sakumura (1966): “A test of a model for commitment,” Journal of Personality and Social Psychology, 3(3), 349–353.
Köbberling, V. (2006): “Strength of preferences and cardinal utility,” Economic Theory, 27(2), 375–391. Koessler, A.-K., B. Torgler, L. P. Feld, and B. S. Frey (2019): “Commitment to pay taxes:
Results from field and laboratory experiments,” European Economic Review, 115, 78–98.
Krajbich, I., B. Bartling, T. Hare, and E. Fehr (2015): “Rethinking fast and slow based on a critique of reaction-time reverse inference,” Nature Communications, 6(7455).
Krajbich, I., D. Lu, C. Camerer, and A. Rangel (2012): “The attentional drift-diffusion model extends to simple purchasing decisions,” Frontiers in Psychology, 3, 193.
Krajbich, I., and A. Rangel (2011): “Multialternative drift-diffusion model predicts the relationship between visual fixations and choice in value-based decisions,” Proceedings of the National Academy of Sciences, 108, 13852–1385710.
Lundquist, T., T. Ellingsen, E. Gribbe, and M. Johannesson (2009): “The aversion to lying,” Journal of Economic Behavior & Organization, 70(1-2), 81–92.
Mascagni, G. (2018): “From the lab to the field: a review of tax experiments,” Journal of Economic Surveys, 32(2), 273–301.
Mazar, N., O. Amir, and D. Ariely (2008): “Identity, Morals, and Taboos: Beliefs as Assets,” Journal of Marketing Research, 45(6), 633–644.
McCabe, D. L., L. K. Trevino, and K. D. Butterfield (2002): “Honor Codes and Other Contextual Influences on Academic Integrity: A Replication and Extension to Modified Honor Code Settings,” Research in Higher Education, 43(3), 357–378.
Ratcliff, R. (1978): “A theory of memory retrieval,” Psychological Review, 85(2), 59–108.
Rustichini, A. (2008): “Neuroeconomics: formal models of decision making and cognitive neuroscience,” in Neuroeconomics: Decision making and the brain, ed. by P. W. Glimcher, and E. Fehr. Academic Press.
Ryan, R., and E. Deci (2000): “Intrinsic and Extrinsic Motivations: Classic Definitions and New Direc-tions,” Contemporary Educational Psychology, 25, 54–67.
Sekhon, J. (2011): “Multivariate and Propensity Score Matching Software with Automated Balance Optimization,” Journal of Statistical Software, 42(7), 1–52.
Shu, L. L., N. Mazar, F. Gino, D. Ariely, and M. H. Bazerman (2012): “Signing at the beginning makes ethics salient and decreases dishonest self-reports in comparison to signing at the end,” Proceedings of the National Academy of Sciences, 109(38), 15197–15200.
Stern, N. (2016): “Economics: Current climate models are grossly misleading,” Nature, 530, 407–409. Sylving, H. (1959): “The Oath: I,” The Yale Law Journal, 68(7), 1329–1390.
Appendix
A Summary statistics on partial compliance in Experiment 1
The table below provides summary statistics on subjects whose compliance is between 10% and 90% in Experiment 1. The distribution of compliance rates of subjects falling in this range is similar in the two conditions.Min. 1st Qu. Median Mean 3rd Qu. Max.
Baseline(%) 11.92 22.91 36.36 37.41 50.06 81.48
Oath(%) 10.12 15.38 35.21 36.56 46.78 85.37
B Parametrization of a cost of lying model
Maximizing utility (1) with respect to d gives the following first order condition: c0(y d?) = ⌧
where d? denotes the optimal reporting decision. Full compliance (i.e., d? = y) can only arise
if @c
@d(0) is non-zero. This can be accommodated by assuming a linear cost of lying such that
c(`) = ✓`, where ✓ is the psychological cost weighting the size of the lie(see, e.g., Calvet and Alm, 2014). The FOC becomes ✓ = ⌧ so that d? = y if ✓ > ⌧ and d? = 0 if ✓ < ⌧. Another possibility
is to assume a fixed cost of lying: subjects will fully comply when the cost of lying is above a threshold (defined by the tax rate), and fully evade otherwise.
Both assumptions however rule out partial compliance, which is at odds with our experimental data.13 In order to generate both partial compliance and full compliance, the cost of lying function
must feature both a linear and a non-linear component. We consider a simple example from this class: c(`) = ✓(`2+ `). In that case, the FOC becomes
y d?= 1/2(⌧ ✓)/✓, (2)
from which full compliance (d? = y) arises whenever ✓ ⌧ (given that over-reporting is excluded
by design), and partial compliance results from lower values of ✓.
Based on this specification, the heterogeneity in the psychological cost of lying can be retrieved from the heterogeneity in reporting behavior (the identification of richer cost functions would require exogenous changes at the individual level of, e.g., the tax rate, or the level of income). To that end we solve the FOC in (2):
⌧ + 2✓i(yi d?i) + ✓i= 0() ✓i= ⌧ /
h
2(yi dˆ?i) + 1
i
(3) and compute for each subject a specific ˆ✓i. Figure 3 illustrates the resulting distributions.
13In the context of a linear cost function, for instance, the indifference curves in Figure 2 perfectly coincide with
C Mean income by consistent decisions and treatment
The table below reports, for each treatment, the average income earned at the first stage of Experiment 2 as a function of the number of consistent decisions across all 5 rounds (as defined in Section 4). There is neither a clear relationship between decision consistency and the amount of income earned, nor any difference between treatments.
Number of consistent decisions
5 4 3 2 0
Baseline(ECU) 349.9 382.4 334.8 383.5 376.9
Truth-telling oath(ECU) 349.9 346.8 304.5 402.0 379.8
D Self-reported certainty
In the figure below we report self-reported certainty. Subjects are asked after the declaration stage how certain they were about their decision on a 1 to 10 scale. Figure (a) presents box-and-whisker plots by treatment for part-time liars and full-time liars/full-compliers: filled rectangles contain 50% of responses whereas the whiskers show the least and greatest values excluding outliers. Medians are represented by a thick horizontal line. Figure (b) presents the EDF of self-reported uncertainty by treatment.
(a) Certainty Boxplot
compl. & liarsFull-time Part-timeliars
se lf -re p ort ed ce rt ai nt y 0 1 2 3 4 5 6 7 8 9 10 Baseline Oath (b) Certainty EDF 0% 25% 50% 75% 100% 0 1 2 3 4 5 6 7 8 9 10 self-reported certainty Baseline Oath
E Empirical distribution functions of the number of consistent
de-cisions, by compliance group and treatment
To ease comparison between compliance groups, the figure below displays the empirical distribu-tions funcdistribu-tions of the number of identical decisions, from full consistency (5 identical decisions) to full inconsistency (0 identical decisions), built based on the distributions shown in Figure 7.
(a) Baseline 0% 25% 50% 75% 100% 5 4 3 2 0 ]of identical dec. (b) Oath 5 4 3 2 0 ] of identical dec. low compliance medium compliance high compliance 23