HAL Id: cea-02492565
https://hal-cea.archives-ouvertes.fr/cea-02492565
Submitted on 27 Feb 2020HAL is a multi-disciplinary open access archive for the deposit and dissemination of sci-entific research documents, whether they are pub-lished or not. The documents may come from teaching and research institutions in France or abroad, or from public or private research centers.
L’archive ouverte pluridisciplinaire HAL, est destinée au dépôt et à la diffusion de documents scientifiques de niveau recherche, publiés ou non, émanant des établissements d’enseignement et de recherche français ou étrangers, des laboratoires publics ou privés.
program
T. Chaudat, F. Wang, G. Nahas, G. Guilhem, C. Piedagnel, B. Foure, M.
Feuillard, R. Schell, A. Mespoulle
To cite this version:
T. Chaudat, F. Wang, G. Nahas, G. Guilhem, C. Piedagnel, et al.. Seismic behavior of composite concrete floor without earthquake design provisions Part 1 : experimental program. SMIRT 23 -Structural Mechanics in Reactor Technology, Aug 2015, Manchester, United States. �cea-02492565�
SEISMIC BEHAVIOR OF COMPOSITE CONCRETE FLOOR WITHOUT
EARTHQUAKE DESIGN PROVISIONS
PART 1 : EXPERIMENTAL PROGRAM
Thierry Chaudat1, Fan Wang1, Georges Nahas2, Gilbert Guilhem2, Corine Piedagnel2, Bernard Fouré3, Maud Feuillard4, Arnaud Mespoullé4, Roland Schell5
1
Engineer, CEA, DEN, DM2S, SEMT, EMSI, 91191 Gif-sur-Yevette, France
2
Engineer, IRSN/PSN-EXP/SES/BEGC,
BP
17, 92262 Fontenay aux Roses, France3
Structural Engineering Expert, 12 Avenue Gay Lussac, 78990 Elancourt, France
4
Engineer, GINGER CEBTP/LEEMS, 12 Avenue Gay Lussac, 78990 Elancourt, France
5
Engineer, GINGER CEBTP/Materials Division, 12 Avenue Gay Lussac, 78990 Elancourt, France ABSTRACT
In some existing nuclear facilities in France, composite concrete floors were designed to support only gravity loads. Therefore those slabs were constructed without earthquake design provisions. In order to assess the structural dynamic behaviour and seismic margins of such slabs with regards to the resistance calculated with construction codes used in France for existing buildings, CEA and IRSN has launched in 2008, a research program, which is divided into two parts: (1) an experimental program performed on two full scale identical models, one being subjected to a mono-axial in-plane static cyclic loading up to failure (tested at GINGER CEBTP) and the other being subjected to a series of bi-axial horizontal seismic excitations (tested at CEA/Saclay on AZALEE shaking table); (2) some numerical analyses performed on the tests results, using the finite-element code CAST3M developed at CEA/Saclay.
This paper is dedicated to the presentation of the two experimental campaigns:
Presentation of the models (geometry, reinforcement detailing, construction, material properties),
Instrumentation of both models,
Experimental campaign protocol,
Main tests results.
Numerical analyses performed after the experimental campaigns are presented in a second paper in this conference.
INTRODUCTION
In some existing French nuclear facilities built before 1990, floors are composed of a cast in-place slab poured on precast reinforced (or pre-stressed) concrete plates. This type of composite floors has often been designed under uniformly distributed gravity loads. Therefore, constructive arrangements are not satisfactory to support seismic loads. The anchoring length of the lower reinforcement achieved inside the floor plate is often insufficient, either on edge or intermediate supporting walls or beams constituting the structural bracing elements. There is no additional reinforcement in the cast in-place upper slab to improve the anchoring or overlapping of the rebars. In most of floors, upper reinforcement is discontinuous, whereas connecting reinforcement ensuring an effective mechanical bond between the precast element and the poured concrete topping, is also missing. Moreover, there is no connection between adjacent plates: the load-carrying capacity in two horizontal directions is necessary in seismic situation, because floor slabs work as diaphragms to transfer horizontal earthquake-induced inertial forces (in-plane shear forces) to the lateral resistant system of the structure.
In order to assess the actual seismic behavior of such composite floors and to highlight margins compared to the resistance calculated with construction codes used in France, CEA and IRSN have launched in 2008, a research program based on experimental tests performed on two full-scale identical models representing a typical composite floor, which can be found in existing French nuclear facilities. The first model (Model-1), tested at GINGER CEBTP, was subjected to a mono-axial in-plane static cyclic loading until collapse. The second model (Model-2), tested at CEA/Saclay on the AZALEE shaking table, was subjected to a series of increasing bi-axial horizontal seismic excitations. These experimental campaigns have been completed by some numerical analyses performed on the tests results and reported in a second paper (Part 2: numerical analyses) in this conference.
DESIGN OF THE MODELS AND EXPERIMENTAL SET-UPS Design and construction of the models
The models were conceived in reference to the main objective exposed in the introduction, as part of a floor mainly subjected to in-plane forces representative of seismic loading. The tested in-plane floor dimensions were 4.27 m width and 2.46 m length; the small value of the length / width ratio induced a high shear stiffness and the predominance of shear over-bending in the failure mechanism. At one end, the horizontal floor was clamped into a stiff caisson made of four reinforced-concrete walls and attached to the test frame by vertical post-stressed tendons. At the other end, it was vertically supported by two hinged steel columns, in order to minimize its out-of-plane bending (Figure 1). Model-1 was dedicated to the static cyclic test and Model-2, to the seismic sequence.
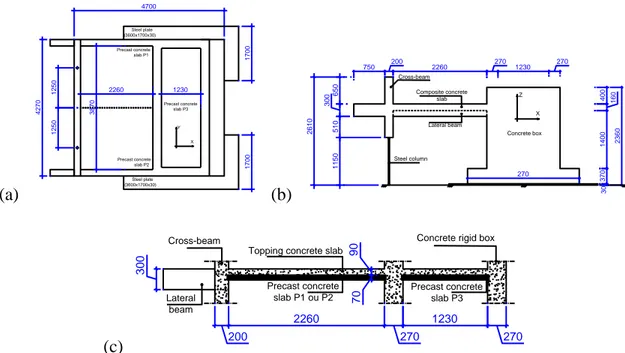
(a)
(b)
(c)
Figure 1: Dimensions of the model (unit: mm): (a) top; (b) elevation; (c) longitudinal section The floor was composite, consisting of two precast reinforced-concrete planks (70 mm thick) located side by side and in mutual contact along an unreinforced longitudinal joint, and a cast-in-place topping slab (90 mm thick). The total thickness of the floor was h = 0.16 m. The slab was provided with two edge-beams which reinforcement insuring a high in-plane bending strength and with a reinforced concrete cross-beam in the vertical plane of the steel columns. It was used to fix the additional loading blocks for
270 1230 270 2260 200 750 370 1400 160 400 2360 6 5 0 3 0 0 5 1 0 1 1 5 0 30 2 6 1 0 Concrete box Lateral beam Cross-beam Composite concrete slab Steel column 270 Precast concrete slab P1 Precast concrete slab P2 Precast concrete slab P3 4270 Steel plate (3600x1700x30) 1250 1250 4700 1700 X Y Steel plate (3600x1700x30) 1700 3870 1230 2260 X Y 270 1230 270 2260 200 750 370 1400 160 400 2360 650 300 510 1150 30 2610 Concrete box Lateral beam Cross-beam Composite concrete slab Steel column 270 X Z
Topping concrete slab
Precast concrete slab P1 ou P2 Precast concrete slab P3 Lateral beam 200 2260 270 1230 270 300 70 90
the seismic test. The precast planks were provided with protruding straight rebars along three of their sides to connect them to the cast-in-place concrete in the clamping caisson, the edge-beams and the cross-beam. Particularly at the clamped end, these rebars were not in continuity with any reinforcement inside the vertical wall, and their length was 11 cm, significantly under the normal anchorage length. This deficient detailing was retained voluntarily to reproduce cases which can be encountered in practice. The cast-in-place topping slab was unreinforced except for the disposal of anchored or continuous rebars at the junction with the clamping wall and the cross-beam. More specifically, there was no reinforcement at the joint level between both precast planks. The upper faces of the precast planks were trowelled to make them rather rough. There was no transverse reinforcement between the planks and the cast-in-place topping.
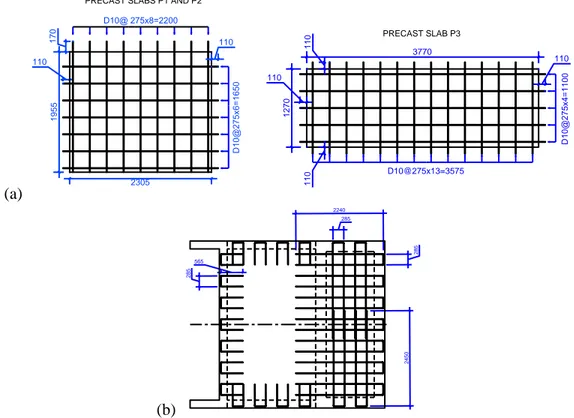
Reinforcement of precast concrete planks was designed using D10 deformed bars in two orthogonal layers (Figure 2), with a nominal yield strength of 570 MPa. Reinforcement of precast planks P1 and P2 were similar. D8 U-shape bars ensured a link between precast slabs and topping slab. For precast slabs P1 and P2, part of interest of the models, this configuration was representative of the reference building.
(a)
(b)
Figure 2: Reinforcement of (a) precast planks and (b) topping slab
Concrete properties
To be representative of a rather weak material possibly existing in real buildings, a target compressive strength of about 25 MPa was considered for the floor. The other parts of the model were cast with a concrete of higher performances.
At the age of the model test, the control specimens resulted in the following mean properties:
Model-1: compressive strength fcm = 25.5 MPa; modulus 21.5 GPa; splitting strength 2.85 MPa,
Model-2: compressive strength fcm = 25 MPa; modulus 20.5 GPa; splitting strength 2.15 MPa.
2305 1955 D10@27 5x6= 165 0 110 170 D10@ 275x8=2200 D10@275x13=3575 D10@27 5x4= 110 0 1270 3770 110 110 110 110 110 PRECAST SLAB P3 PRECAST SLABS P1 AND P2
2450 565 285 285 2240 285
Additional masses (seismic tests only)
Additional masses had to be fixed on Model-2 (Figure 3), in order to generate a sufficient level of inertial orce to load and potentially damage the composite floor. The masses were fixed on the cross-beam at the edge of the slab: (i) on the upper part, 11 steel masses (unit mass: 1000 kg – total mass: 11000 kg) and (ii) on the lower part, 160 lead blocks (unit mass: 67 kg – total mass: 10700 kg). The total additional mass of Model-2 was hence around 21700 kg.
Figure 3: Additional masses fixed on Model-2
Experimental set-ups and loading
Figure 4 presents the experimental set-up for Model-1. It was tested at GINGER CEBTP Elancourt, LEEMS laboratory. The model was loaded by two opposite hydraulic actuators, acting horizontally along Y direction at the intersection of the floor plane with the vertical cross-beam plane. The out-of-plane bending or torsion, induced by the dead-weight or by the transverse component of the actuator force due to its inclination following the floor deformation, as well as by vertical displacement due to the deformation of the test frame at the base of the steel columns, were negligible.
A program of alternate horizontal forces cycles was performed. For small forces, it was done under load control; for medium and high forces, it was under displacement control (hydraulic pressure monitored by the horizontal displacement of the actuator) and two successive cycles were realized at the same displacement limits.
An accidental preliminary monotonic loading induced some cracking as it was foreseen but without the complete set of corresponding measurement. The probable behaviour was set up afterwards. After this, five monotonic loading steps were applied in the opposite direction. Then 11 alternate cycles were realized, the last one in the post-failure range.
Figure 4: Static cyclic test set-up (Model-1)
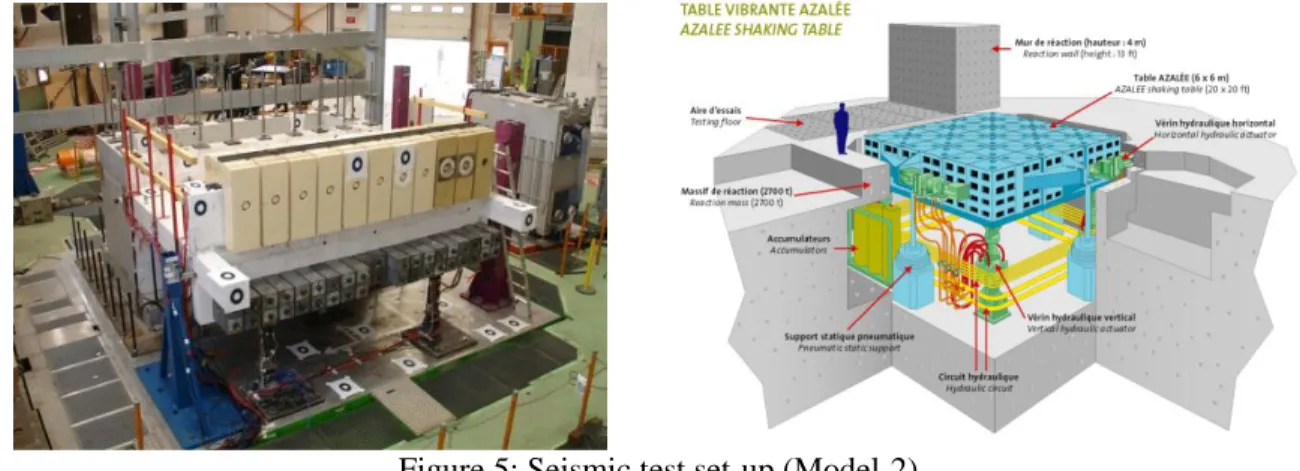
Figure 5 presents the experimental set-up for Model-2. It was tested at CEA Saclay, EMSI Laboratory, on the AZALEE shaking table. This six degrees of freedom table is equipped with 8 actuators (1000 kN
force each) and an aluminium platform of 6mx6m. The maximum payload is 1000 kN. Maximum displacement range is +/- 125 mm in each direction.
Figure 5: Seismic test set-up (Model-2)
As the seismic loading was bi-axial horizontal, two time-histories were used during all the seismic test sequence (Figure 6). These signals result from a dynamic analysis performed on the original building and correspond to the transferred seismic motion on the floor level from a set of natural seismic input signals. Here, Y direction is the same as for the models (see Figure 1(a)).
5 % damping response spectra
Figure 6: Seismic loading signals The experimental program consisted of two phases:
Phase 1: 13 bi-axial horizontal shaking table tests ranging in X direction from PGA = 0.03g to 2.00g and in Y direction, from PGA = 0.05g to 1.90g;
Phase 2: 5 uniaxial shaking table tests ranging in Y direction from PGA = 0.2g to 1.70g.
Natural frequencies of Model-2 were measured using random excitation before and after each test in the X, Y and Z directions. For this purpose, a low intensity excitation (maximum PGA = 0.05-0.07g)
containing a frequency range of 1-30 Hz was used. The response recorded on the model was used to identify the natural frequencies of the relevant vibration modes.
INSTRUMENTATION SET-UPS
Two different instrumentation set-ups were defined for Model-1 and Model-2. However, in order to perform comparisons between the two experimental campaigns, several points were instrumented in the same way. It concerned mainly strain gauges on reinforcement and concrete on the planks and displacements measurement.
For Model-1, the following measurements were done: - The overall displacements in the three principal directions by LVDTs, at the level of the cross-beam (mainly the displacement along the actuators’ axis, which is used to servo-control the force), at the floor clamping and at the base of the clamping caisson. - The overall length variation of the diagonals of the floor, by means of wires acting on LVDTs. - The local displacements, still by LVDTs, at the interfaces between the two slabs and between the slabs and its surrounding elements, to obtain the sliding and opening. - The local deformation of steel and concrete by strain gauges, to obtain the steel stress in the reinforcement of the planks, of the edge-beams and of the cross-beam, and to measure the concrete strain along the interfaces between the floor and the clamping caisson and cross-beam. - The separation between the precast planks and the cast-in-place topping due to failure of the adhesion, by the measure of the propagation time of ultrasonic waves through the floor thickness. - The opening of some cracks, by means of transducers glued to the concrete across the crack, after it appears.
For Model-2, the following measurements were done: -The motion of the shaking table in the three principal directions (acceleration and displacement/rotation). –The overall accelerations in the three principal directions at the foundation and floor levels. –The overall displacements in the three principal directions at the level of the foundation, the cross-beam, and the floor clamping. - The overall length variation of the diagonals of the floor, by means of wires acting on displacement transducers. - The local displacements at the interfaces between both slabs and between the slabs and their surrounding elements, to obtain the sliding and opening. - The local deformation of steel and concrete by strain gauges, to obtain the steel stress in the reinforcement of the planks, of the edge-beams and of the cross-beam, and to measure the concrete strain along the interfaces between the floor and the clamping caisson and cross-beam.
MODEL-1 TESTS RESULTS ANALYSIS Overall behaviour and failure
The first cracks to appear were flexural ones. The corresponding load fitted rather well with a calculation which takes into account the non-linear elastic stress distribution in a short corbel compared to the linear distribution in a slender beam, which results in an amplification of the maximum tensile stress (see Leonhardt 1970)). The shear cracks appeared at a quite smaller loading level compared to the elastic prediction, due to a redistribution induced by the flexural cracks; the elastic value predicts the “critical” crack instead, which corresponds to the initiation of the failure mechanism.
The appearance of the cracks and the measured stresses in the flexural reinforcement under increasing forces show clearly the development of a strut and tie mechanism resulting in a typical shear failure, with a largely opened shear crack (about 5 mm) not far from the diagonal. This mechanism occured for each loading direction. It has the appearance of the monolithic behaviour: the shear cracks affect the whole floor thickness and have no significant discontinuity where they intersect the longitudinal joint between the planks.
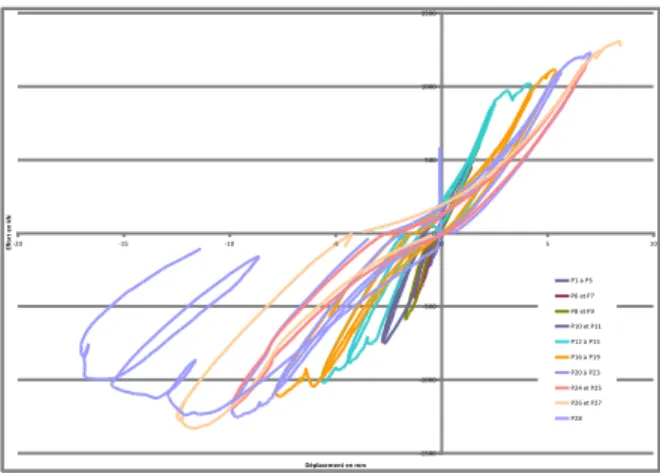
Figure 7 gives the force-displacement curves for all the cycles and figure 8 presents a view of the failure mechanism. The failure was finally due to local punching under the actuators, which slightly reduced the measured maximum resistance with respect to the shear mechanism. A parabolic extrapolation of the load-displacement curve was used to assess the probable shear resistance: VRu ≈ 1400 kN; estimated horizontal ultimate displacement is about 15 mm.
Figure 7: Force-displacement curves - Model-1 Figure 8: Ultimate state of the floor - Model-1 (after unloading; cracks partially closed)
Deviation from a monolithic behaviour
Although the failure seems to correspond to a monolithic behaviour, the measures show that there are some disorders which result in a certain deviation from the monolith. The ultrasonic waves revealed that a separation between the cast-in-place concrete topping and the precast planks begins at about 80% of the failure load. It affects an important area adjacent to the longitudinal joint between the planks when the failure is reached. The sliding along this joint is negligible up to 40% of the failure load. Then it increases regularly, with a maximum value in the vicinity of the critical shear crack, to about 5 mm at failure. It is much smaller near the cross-beam, about 1 mm. The sliding at the interfaces between the floor and the edge-beams also increases regularly, but with a small maximum value of about 0.5 mm. The strains measured in the rebars protruding from the planks into the clamping caisson and into the cross-beam show that the sliding along the joint makes the behaviours of the two planks independent to some extent. But no longitudinal crack along the joint was visible at the upper face of the floor; so the preceding behaviour does not concern the floor in its whole thickness.
Prediction of the failure load
The preliminary design of the model did consider several resisting mechanism: short beam flexural resistance; short beam shear resistance (by the formula recalled afterwards); shear friction resistance at the clamped end of the floor; sliding along the joint between the planks and locking effect of the cross-beam; shear friction at the interface between the floor and the edge-beams. Despite the great uncertainty affecting some mechanisms, it seems reasonable that the weakest mechanism was the overall shear failure.
From the strains measured in the edge-beams flexural reinforcement, we observe: i) they do not yield, thus the bending resistance was not attained; ii) the strains are almost the same all along the beams, which indicates that it behaves as a tie. This is coherent with a shear failure mechanism of short beams (corbel). There was no transverse continuous shear reinforcement, because of the joint between the two planks.
-1500 -1000 -500 0 500 1000 1500 -20 -15 -10 -5 0 5 10 Déplacement en mm Ef for t e n kN P1 à P5 P6 et P7 P8 et P9 P10 et P11 P12 à P15 P16 à P19 P20 à P23 P24 et P25 P26 et P27 P28
The failure load (in MN) was estimated by the empiric formula issued from about 450 tests results on rectangular unreinforced elements (Rafla, 1971; Kordina and Blume, 1985), in which all the main parameters are taken into account, and slightly modified to introduce the effect of the longitudinal distributed reinforcement (spacing sℓ = 0.275 m) and the contribution of the edge-beams (height h’ = 0.30
m; width t = 0.20 m):
V
Rc= 0.54 f
cm1/2(ρ
ℓ1+ ρ
ℓ2)
1/3(d*)
-1/4k
ah
*d
(1)
Ratios of longitudinal reinforcement (in %): flexural tie ρℓ1 = 0.28% ; distributed in planks ρℓ2 = 0.09%
(reduced for insufficient anchorage length).
Scale factor. Depth of reinforcement d = 4.17 m, modified in d* (expressed in cm in the formula): d* = (0.9 ρℓ1 d + ρℓ2 sℓ) / 0.9 (ρℓ1 + ρℓ2) = 3.26 m
Slenderness factor (span of the floor from clamped end to cross-beam axis: a = 2.375 m): ka = 6 – 2.2 (a / d) = 4.75
Modified thickness including the edge-beams: h* = h + 2 (h’ – h) (t / b) = 0.173 m
Assuming the floor is a monolith, the formula (1) gives VRc = 1577 kN, which is 13% higher than the test
value. As an extreme assumption of the complete loss of adhesion between the planks and the cast-in-place topping, the planks are totally neglected. The parameters are modified: ρℓ1 = 0.44%; ρℓ2 = 0; d* = d
= 4.17 m; h* = 0.11 m; the formula (1) gives VRc = 990 kN, which is 29% lower than the test value. It
MODEL-2 TESTS RESULTS ANALYSIS Overall behaviour and damage
Table 1 gives the range of global force values in the slab (axial force Fx and shear force Fy), deduced from
the acceleration measurements performed on the model during the tests. These forces cannot be directly measured as in the case of the static tests.
Table 1: Range values of global forces on the cross section of the slab (Model-2)
Test number PGA (g) Force Fx (kN) Force Fy (kN)
Fx_min Fx_max Fy_min Fy_max
1 X: 0.06 – Y: 0.05 -18.0 20.1 -36.0 57.3 2 X: 0.06 – Y:0.12 -14.0 16.0 -31.5 47.0 3 X: 0.25 – Y:0.30 -79.0 81.4 -100.7 88.9 4 X: 0.32 – Y:0.35 -98.5 97.9 -110.6 117.6 5 X: 0.40 – Y:0.45 -121.1 122.3 -146.9 161.3 6 X: 0.80 – Y:0.80 -239.3 239.0 -296.4 308.2 7 X: 1.00 – Y:1.10 -311.6 313.4 -314.3 355.0 8 X: 1.40 – Y:1.40 -452.9 396.4 -401.2 459.8 9 X: 2.00 – Y:1.90 -650.0 432.9 -532.6 631.4
The initial stiffness of the slab in Y direction was estimated to 11×108 N/m. At the end of the bi-axial seismic tests sequence, this stiffness was divided by 2. Figure 9 gives the force-displacement curve (Y direction) deduced from the results of the last bi-axial test (Test n°9).
As the maximum acceleration capacity of the shaking table was reached, seismic tests at higher acceleration were not performed. The only crack that appeared during the seismic sequence was along the joint between the two planks during Test n°8. A maximum of 0.1 mm sliding was measured during Test n°9 with a residual value of 0.03 mm. The length variation along the floor diagonals remained inferior to 0.05%.
Figure 9: Force-Displacement curve – Model-2 – Seismic test n°9 COMPARISON OF RESULTS – MODEL-1 AND MODEL-2
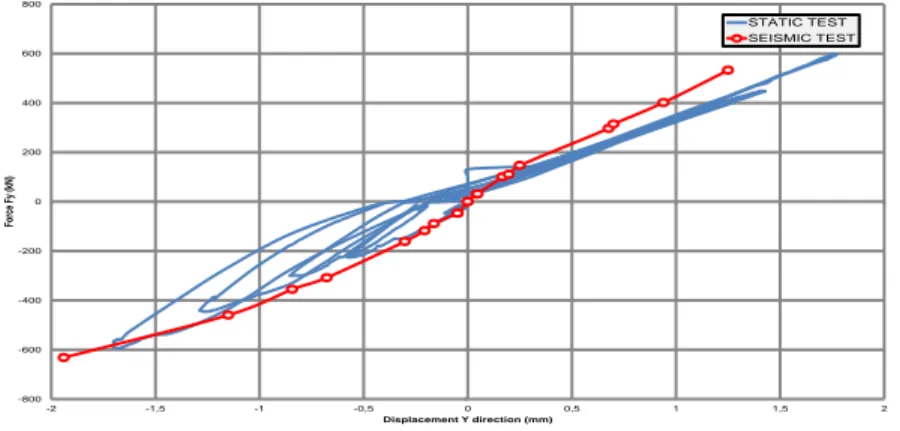
Figure 10 presents a comparison of the behaviour of Model-1 and Model-2. Blue line is the first cycles of the static test. Red line is the envelope of the curves obtained during the seismic test. In the negative part of the loading, there is a good agreement between both models. In the positive part of the loading, the difference between the curves is due to an accidental preliminary monotonic loading inducing some cracking. -600 -400 -200 0 200 400 600 800 -2 -1,5 -1 -0,5 0 0,5 1 1,5 2 2,5 Fo rc e Fy (k N ) Displacement - Y direction (mm)
Figure 10: Force-Displacement curve – Comparison between Model-1 and Model-2
This comparison shows that the behaviour of Model-2 can be extrapolated to Model-1, especially at low loading levels (in the elastic domain), even if the loading configurations of both models are different (mono-axial vs. bi-axial).
SEISMIC MARGIN
Initially, the research program was motivated by concerns about the seismic resistance of existing composite floors such as described in this paper. In some cases, the in-plane shear strength of the slabs calculated according to the French seismic code PS92 (2001) seems to be insufficient, especially against shear friction failures in the joint zone between the slabs and the supporting shear walls (at the clamped end of the floor). Hereafter, we will compare the experimental results with the resistance values calculated with the French code and also with Eurocode 8 - Part 3 (2005). In doing this code verification, we should sit in the conservative side. So the precast planks are completely neglected as in the extreme case for the failure load prediction.
Shear friction resistance with respect to French code PS92
According to PS92, the shear friction resistance of a reinforced concrete wall can be calculated by the following formula:
𝑉 = 0.35𝑓𝑡𝑗𝑎𝑥 + (𝐹𝑏+ 𝐴′𝑓𝑒)𝑡𝑔𝜑 (𝑡𝑔𝜑 = 0.7)
Where ftj is the tensile strength of concrete, a, the wall thickness, x, the compressed width of the cross
section, Fb, the resultant of the compressive stress, A’, the section area of distributed vertical
reinforcement and finally, fe is the yield strength of the steel. In the case of Model-2, the floor is subjected
to bi-axial excitations and the whole cross section of the floor can be subjected to tensile stress. The formula reduces to (14 D8 steels in the X direction in the topping slab, fe = 417 MPa):
𝑉 = 𝐴′ 𝑓
𝑒 𝑡𝑔𝜑 = (14𝜋 × 0.0042) × 417 × 0.7 = 0.21𝑀𝑁
The seismic tests did not bring Model-2 to a significant damage state, but we can see from Figure 10 that the resistance is greater than 0.63 MN. As a result, the seismic margin of the floor concerning the shear friction is greater than 3 (0.63/0.21) with respect to PS92.
Diagonal tension resistance with respect to Eurocode 8 – Part 3
According to Eurocode 8 - Part 3 (2005), the diagonal tension failure resistance of a squat shear wall under cyclic loading can be calculated by the following formula (Annex A, Eq A16):
-800 -600 -400 -200 0 200 400 600 800 -2 -1,5 -1 -0,5 0 0,5 1 1,5 2 Forc e Fy (kN) Displacement Y direction (mm) STATIC TEST SEISMIC TEST
𝑉𝑅,𝑚𝑎𝑥=4⁄ (1 − 0.02min (5; 𝜇7 ∆
𝑝𝑙)
𝛾𝑒𝑙 (1 + 1.35
𝑁
𝐴𝑐𝑓𝑐) (1 + 0.45(100𝜌𝑡𝑜𝑡))√min (40; 𝑓𝑐)𝑏𝑤𝑧𝑠𝑖𝑛2𝜃 Where γel = 1.0 (partial security factor for secondary element), 𝜇∆
𝑝𝑙= 0 (related to the ductility demand);
N, the axial force (= 0 for Model-1), 𝜌𝑡𝑜𝑡, the total steel ratio, fc, the compression strength of concrete, bw
, the wall thickness, z = 0.8h, the internal lever arm and θ, the angle between the diagonal and the floor direction (X direction). This leads us to a shear resistance equal to 1.04 MN which is rather close to the result obtained earlier from the Rafla-Kordina-Blume formula for Model-1. The seismic margin is therefore equal to 1.4/1.04 = 1.35.
CONCLUSION
In spite of defects in the model, some of them being intentional to simulate possible practical situations, the behaviour of the composite floor was quasi-monolithic. The margins of safety with respect to the French code PS92 and also with respect to Eurocode 8 – Part 3, are satisfactory.
REFERENCES
Kordina, K. and Blume, F. (1985). “Empirische Zusammenhänge zur Ermittlung der Schubtragfähigkeit stabförmiger Stahlbetonelemente“, Deutscher Ausschuss fur Stahlbeton, Heft 364.
Leonhardt, F. (1970). “Poutres–cloisons. Structures planes chargées parallèlement à leur plan moyen”,
Annales de l'ITBTP, série BBA 109, pp. 113–164.
Rafla, K. (1971). “Empirische Formeln zur Berechnung der Schubtragfähigkeit von Stahlbeton balken“,
Strasse, Brücke, Tunnel 23.
Norme Française NF P 06-013
(2001)
, “Règles Parasismiques applicables aux bâtiments - PS92”, EditionEy
rolles
.CEN (2005). European Standard EN 1998-3:2005, “Eurocode 8 - Part 3: Assessment and retrofitting of buildings”, Comité Européen de Normalisation, Brussels