HAL Id: hal-00296511
https://hal.archives-ouvertes.fr/hal-00296511
Submitted on 31 Mar 2008
HAL is a multi-disciplinary open access
archive for the deposit and dissemination of
sci-entific research documents, whether they are
pub-lished or not. The documents may come from
teaching and research institutions in France or
abroad, or from public or private research centers.
L’archive ouverte pluridisciplinaire HAL, est
destinée au dépôt et à la diffusion de documents
scientifiques de niveau recherche, publiés ou non,
émanant des établissements d’enseignement et de
recherche français ou étrangers, des laboratoires
publics ou privés.
microphysical properties by AERONET over south-east
Italy in the central Mediterranean
M. Santese, F. de Tomasi, M. R. Perrone
To cite this version:
M. Santese, F. de Tomasi, M. R. Perrone. Advection patterns and aerosol optical and microphysical
properties by AERONET over south-east Italy in the central Mediterranean. Atmospheric Chemistry
and Physics, European Geosciences Union, 2008, 8 (7), pp.1881-1896. �hal-00296511�
www.atmos-chem-phys.net/8/1881/2008/ © Author(s) 2008. This work is distributed under the Creative Commons Attribution 3.0 License.
Chemistry
and Physics
Advection patterns and aerosol optical and microphysical properties
by AERONET over south-east Italy in the central Mediterranean
M. Santese, F. De Tomasi, and M. R. PerroneCNISM, Physics Department, University of Salento, Via per Arnesano, 73100, Lecce, Italy
Received: 4 September 2007 – Published in Atmos. Chem. Phys. Discuss.: 15 November 2007 Revised: 31 January 2008 – Accepted: 15 February 2008 – Published: 31 March 2008
Abstract. Aerosol products by AERONET sun-sky radiome-ter measurements combined with air-mass backtrajectories were analyzed to identify source regions and pathways of air masses carrying aerosols to south-east Italy, and to determine the dependence of aerosol mean optical properties on advec-tion patterns. Aerosol optical depth (AOD), fine mode frac-tion (η), single scattering albedo (SSA), asymmetry factor (g), and lidar ratio (Lr) at 440 nm were used to character-ize aerosol properties. The analysis of 5-day-backtrajectories ending in Lecce on south-east Italy and referring to 240 mea-surement days of the 2003–2004 years revealed that 32% of the measurement days were characterized by air masses coming from all continental European sources with the ex-ception of Spain. 3% of the measurement days were char-acterized by air masses coming from both the Southern Mediterranean Sea and the Africa continent, and the West-ern Mediterranean, the Iberian Peninsula, and the Atlantic Ocean. 62% of the measurement days were characterized by mixed advection patterns. We found that AOD, SSA and g average values were not significantly dependent on air mass source regions. In contrast, η and Lr average values were quite affected by the air mass source region. AOD, η, SSA,
g, and Lr average values, which were equal to 0.29±0.15, 0.93±0.03, 0.93±0.03, 0.67±0.03, and 72±20 sr, respec-tively indicated that the aerosol advected from all con-tinental European sources with the exception of Spain, could be considered representative of “continental average aerosol”, mostly made of water soluble and a small amount of soot and insoluble components. Polluted-desert dust particles characterized by AOD=0.29±0.05, η=0.72±0.05, SSA=0.94±0.03, g=0.69±0.02, Lr=56±13 sr, were ad-vected over south-east Italy from the Southern Mediterranean Sea and the Africa continent. The Western Mediterranean,
Correspondence to: M. Santese
the Iberian Peninsula, and the Atlantic Ocean were instead responsible of the advection of maritime-polluted particles, which were characterized by AOD=0.27±0.17, η=0.8±0.1, SSA=0.94±0.03, g=0.67±0.03, Lr=58±24 sr. Hence, we found that the aerosol load over south-east Italy was domi-nated by moderately-absorbing, fine-mode particles even if it was also affected by the minor contribution of desert and maritime type aerosol. The application of an aerosol mask to the data points retrieved on measurement days characterized by mixed advection patterns, supported last comment
1 Introduction
Aerosol effects on climate are quite dependent on aerosol op-tical and microphysical properties (e.g. Giorgi and Bi, 2002; Horvath et al., 2002; Meloni et al., 2005). Thus, the charac-terization of aerosol properties is crucial to understand their influence on the Earth-atmosphere radiation budget. The Mediterranean region is certainly one of the most interest-ing regions in terms of atmospheric particulate and various model studies predicted maximum net direct radiative forc-ing by aerosols for this region (e.g. Charlson et al., 1991; Hatzianastassiou et al., 2004; Giorgi, 2006). The Mediter-ranean Sea that is bounded to the north by the European con-tinent and to the south by North Africa, is largely affected by different types of particles: desert dust, from the Sahara desert and surrounding arid regions; anthropogenic particles, produced mainly in urban and industrial areas of Europe; marine aerosol, from the Mediterranean itself or transported from the North Atlantic; and biomass burning particles, of-ten produced in forest fires (e.g. Lelieveld et al., 2002; Barn-aba et al., 2004; Pace et al., 2006; BarnBarn-aba et al., 2007). The strength of dust outbreaks over the Mediterranean tends to facilitate the Saharan dust detection by both ground and space based observations, allowing the quantification of its transport and optical and microphysical properties (e.g. De
Tomasi et al., 2003; Tafuro et al., 2006). In contrast, the ex-port of particulate matter from the industrialized countries surrounding the Mediterranean is complicated by the fact that an extremely large number of species and gas precur-sors contribute to it (e.g. Formenti et al., 2002; Barnaba et al., 2004). The Mediterranean Intensive Oxidant Study (MI-NOS) Project that highlighted the important role of pollu-tants in the summertime Mediterranean atmosphere is rep-resentative of the international effort to quantify the impact of anthropogenic emissions on the natural background of the Mediterranean environment (Lelieveld et al., 2002). Barn-aba and Gobbi (2004), for the sole Mediterranean basin and for the whole 2001, implemented a method (aerosol mask) to separate, on the basis of MODIS data, the contribution to the total aerosol optical depth (AOD) of the three aerosol types prevailing over the Mediterranean basin: maritime, continental and desert dust aerosol. In the paper of Barn-aba and Gobbi (2004) the application of an aerosol mask showed that in urban/industrial conditions, optical proper-ties are dominated by fine particles while, in the presence of desert dust, these are strongly dominated by coarse par-ticles. In maritime conditions, the relative contribution of coarse particles, although variable, is generally higher than in urban/industrial conditions and lower than for desert dust. Models were also usefully employed to investigate the export pathways of air pollution from Europe (Stohl et al., 2002; Duncan and Bey, 2004). The cluster analysis that appeared at the end of the 80’s (Kalkestein et al., 1987; Moody, 1986; Moody and Galloway, 1988) represents a valuable tool to reduce the subjectivity of the atmospheric aerosol classifi-cation. Four-day back trajectories categorized in five ma-jor clusters were used by Kazadzis et al. (2007) to assess the influence of long-range transport from various regions to the aerosol load over Thessaloniki (Greece). The clus-ter analysis showed that the contribution of air masses com-ing from the North and North Eastern directions resulted in high aerosol loads over Thessaloniki, while minimum aerosol optical depth was associated with air masses orig-inating from the Atlantic ocean. Five-day backtrajectories were used by Pace et al. (2006) to characterize at Lampedusa (Central Mediterranean) aerosol optical properties retrieved from multi filter rotating shadowband radiometer (MFRSR) observations (July 2001–September 2003). The backtrajec-tory analysis revealed that in cloud-free conditions, 36% of the air masses come from Africa, 25% from Central-Eastern Europe, and 19% from Western France, Spain and the North Atlantic. In almost all cases, African aerosols display high values of AOD and low values of Angstrom exponent ˚A (average values of AOD and ˚A are 0.36 and 0.42, respec-tively). Particles originating from Central-Eastern Europe show relatively large average values of AOD and ˚A (0.23 and 1.5, respectively), while particles from Western France, Spain and the North Atlantic show the lowest average val-ues of AOD (0.15), and relatively small valval-ues of ˚A (0.92). Four-day backtrajectories were used by Fotiadi et al. (2006)
to characterize the aerosol physical and optical properties over the eastern Mediterranean basin using a complete series of two-year (2003–2004) measurements from the FORTH-AERONET station in Crete. The broad frequency distri-butions of AOD and ˚A values together with the backtra-jectory analysis revealed the presence of a great variety of aerosol types over the study region including dust, urban-industrial and biomass-burning pollution, and maritime, as well as mixed aerosol type. Several experimental studies on aerosols were focused on the Eastern Mediterranean area in the last decade (Mihalopolulos et al., 1997; Papayannis et al., 1998, 2005; Formenti et al., 2001, 2002; Lelieveld et al., 2002; Gerasopoulos et al., 2003; Balis et al., 2003, 2004; Amiridis et al., 2005). In contrast, only few studies were conducted to characterize aerosol properties in the Central Mediterranean.
In this work, aerosol measurements from the AERONET station in Lecce (40◦20′N, 18◦06′E) combined with five-day
backtrajectories were analyzed to characterize aerosol prop-erties over the Central Mediterranean basin, to assess the im-pact on the aerosol load of long-range transport from var-ious regions, and to study the mixing of different aerosol types. The aerosol data include AOD, single scattering albedo (SSA), asymmetry factor (g), Angstrom coefficient ( ˚A), fine-mode fraction (η), and lidar ratio (Lr) retrieved from measurements performed in the period March 2003– October 2004. The location of the Lecce-AERONET sta-tion offers a good opportunity to monitor aerosols from dif-ferent sources and distinguish among various aerosol load scenarios, being on a narrow peninsula of south-east Italy away from large cities and industrial areas, ∼20 km away from both the Ionian and the Adriatic Sea, ∼100 km away from the western Balkan peninsula coast, and ∼800 km away from the North Africa coast. Satellite images and data from the MODerate resolution Imaging Spectroradiometer (MODIS) were also used to better assess the effects of forest-fires (http://maps.geog.umd.edu/firms/) and dust outbreaks (http://modis.gsfc.nasa.gov) on aerosol properties.
A brief description of AERONET instrumentation and re-trievals, and backtrajectory data is given in Sect. 2. The methodology used to select main advection patterns over the monitoring site by the 5-day backtrajectories analysis is il-lustrated in Sect. 3. Section 4 provides a general description of the aerosol properties over the AERONET monitoring sta-tion. The dependence of aerosol properties on advection pat-terns is illustrated in Sect. 5. Summary and conclusion are given in Sect. 6.
2 AERONET instrumentation and retrievals and back-trajectory properties
AERONET is a federated international network of sun/sky radiometers established in 1993 that maintains more than 400 instruments worldwide (Holben et al., 1998, 2001).
Data are publicly available online in near real-time mode (http://aeronet.gsfc.nasa.gov). Aerosol parameters presented in this study were retrieved by measurements with the AERONET sun/sky radiometer operating since March 2003 at Lecce, on the roof of the Physics Department of Uni-versita’ del Salento (40.33◦N, 18.10◦E, 27 m a.s.l.). The CIMEL sun/sky radiometer measures direct sun radiance in eight spectral channels between 340 and 1020 nm (340, 380, 440,500, 670, 870, 940 and 1020 nm). Sky measurements are performed at 440, 670, 870 and 1020 nm wavelengths through a wide range of scattering angles from the Sun (Hol-ben et al., 1998). An automated cloud-screening algorithm (Smirnov et al., 2000) is applied to AOD direct-sun mea-surements. Aerosol microphysical parameters are retrieved from direct sun and diffuse sky radiance measurements by a flexible inversion algorithm, developed by Dubovik and King (2000). A discussion on the accuracy of individual re-trievals is reported in Dubovik et al. (2000, 2002). In particu-lar, the AOD accuracy is of ±0.01 in the range 440–1020 nm, while the accuracy of SSA and g at 440 nm is ±0.03 and
±0.02, respectively. Quality assured (automatically cloud cleared and manually inspected) level 2 AERONET data from the V1 algorithm (Smirnov et al., 2000) and retrieved from measurements performed between March 2003 and Oc-tober 2004, were used in this study. It is worth mentioning that daily averaged products of level 1.5 AERONET data re-trieved from measurements performed between March 2003 and March 2004, were analyzed by Perrone et al. (2005) to investigate the seasonal dependence of aerosol properties over south-east Italy.
In our study, 5-day analytical backtrajectories were used to characterize main advection patterns over the Lecce AERONET site. Analytical backtrajectories provide infor-mation on the aerosol origin observed at a particular lo-cation and on the dynamical patterns governing the air mass transport (Kazadzis et al., 2007). The used back-trajectories are based on the trajectory Code 613.3 devel-oped at NASA/Goddard – The Atmospheric Chemistry and Dynamics Branch (http://croc.gsfc.nasa.gov/aeronet/index. html) and are provided for distinct arrival pressure levels and for two arrival times (12:00 and 24:00 UTC) on a day-by-day basis. The backtrajectories of all measurement days within March 2003–October 2004, for the arrival time of 12:00 UTC and for arrival pressure levels of 950, 850, 700, and 500 hPa were used in this study. Lidar measurements at Lecce re-vealed that the aerosol load extends up to ∼5 km from ground (De Tomasi et al., 2006) and as a consequence, backtrajecto-ries having arrival pressure levels higher than 500 hPa have not been taken into account.
In addition to 5-day analytical backtrajectories, MODIS images by Terra and Aqua satellites (http://rapidfire.sci.gsfc. nasa.gov/realtime/2008029/) and MODIS fire maps (http: //maps.geog.umd.edu/firms/) were also used to infer the ad-vection of dust and biomass burning particles, respectively over south-east Italy.
80 60 40 20 L a ti tu d e ( d e g re e s ) -60 -40 -20 0 20 40 60 Longitude (degrees)
A
C
B
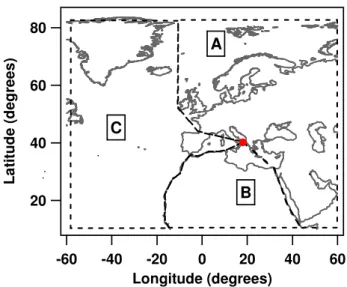
Fig. 1. Aerosol source Sectors: Sector A, includes all continental
European sources with exception of Spain, Sector B, includes the Southern Mediterranean Sea and the Africa continent, and Sector C, includes the Western Mediterranean, the Iberian Peninsula, and the Atlantic Ocean.
3 Aerosol source regions by 5-day backtrajectories
Considering main advection patterns over south-east Italy (Perrone et al., 2005; De Tomasi et al., 2006), three broad ge-ographical sectors, shown in Fig. 1, were defined as aerosol source regions: Sector A, which includes all continental Eu-ropean sources with the exception of Spain that is generally crossed by air masses from the west Atlantic Ocean; Sec-tor B, which includes the Southern Mediterranean Sea and the Africa continent; Sector C, which includes the West-ern Mediterranean, the Iberian Peninsula, and the Atlantic Ocean. Air masses from Sector A have the common property to travel across several industrialized European areas before reaching Lecce (De Tomasi et al., 2003). African deserts are instead the main sources of the Sector B aerosol. Marine and to lesser extent anthropogenic particles from the Atlantic Ocean (http://www.esrl.noaa.gov/csd/ICARTT/) and/or the Western Mediterranean regions are expected to be advected from Sector C.
The time spent by the trajectories in a Sector up to the measurement day was also considered to better define the aerosol origin sector. In particular, we assumed that Sec-tor A is the aerosol source region if at least three of the four back trajectories having 950, 850, 700, and 500 hPa arrival pressure level, respectively, spent at least 80% of the time within the Sector before reaching the sampling site. Africa deserts were considered responsible of the advection of par-ticles over southern-eastern Italy if at least two of the four back trajectories used in this study, spent more than 10% of time inside the border of the African continent and more than 60% of the time inside the Sector B before getting to
70 60 50 40 30 20 L a ti tu d e ( d e g re e s ) -60 -40 -20 0 20 40 60 Longitude (degrees) 850 hPa
(b)
900 800 700 600 500 400 300 70 60 50 40 30 20 L a ti tu d e ( d e g re e s ) -60 -40 -20 0 20 40 60 Longitude (degrees) 950 hPa(a)
900 800 700 600 500 400 300 70 60 50 40 30 20 L a ti tu d e ( d e g re e s ) -60 -40 -20 0 20 40 60 Longitude (degrees) 500 hPa(d)
900 800 700 600 500 400 300 70 60 50 40 30 20 L a ti tu d e ( d e g re e s ) -60 -40 -20 0 20 40 60 Longitude (degrees) 700 hPa(c)
900 800 700 600 500 400 300Fig. 2. 5-day backtrajectories of the measurement days with Sector A as aerosol source region for different arrival pressure levels: (a)
950 hPa, (b) 850 hPa, (c) 700 hPa, and (d) 500 hPa. Different colors are used to characterize pressure levels of each backtrajectory as a function of the time.
the monitoring site. Finally, we assumed Sector C as aerosol source region, if at least three of the four back trajectories with 950, 850, 700, and 500 hPa arrival pressure level, re-spectively, spent more than 40% of the time within the sector before reaching the sampling site. The peculiar geographical location of south-east Italy determined the use of different constraints on the number and time spent by backtrajecto-ries in a Sector. The above reported criteria are the result of a sensitivity study that was performed to properly relate aerosol properties to source Sectors. In particular, the chosen Sector constraints allow selecting measurement days charac-terized by aerosol loads with ˚A and AOD values that concen-trate in a particular area of the ˚A-AOD scatterplot. We found that less restrictive constraints than those used allow select-ing measurement days with aerosol loads characterized by
˚
A and AOD values that spread within all observed ˚A-AOD variability range. The sensitivity study is not reported to do not lengthen the paper. Nevertheless, we know that criteria different than those used in this paper could have be chosen to infer aerosol source regions.
Considering the above reported criteria, we found that 32% of the 240 measurement days were characterized by air masses coming from Sector A, while 3% of the measurement days were characterized by air masses coming either from Africa deserts (Sector B) or from the Atlantic and Mediter-ranean Sea (Sector C). As an example, Fig. 2a–d show for different arrival pressure levels, the backtrajectories of the measurement days with Sector A as aerosol source region. Different colors are used in Fig. 2a–d to characterize pres-sure levels of each backtrajectory as a function of the time.
1.0 0.8 0.6 0.4 0.2 0.0 ηηηη 2.0 1.5 1.0 0.5 0.0 Å (870/440 nm) R = 0.83
(b)
2.0 1.5 1.0 0.5 0.0 Å ( 87 0/ 44 0 n m ) 1.0 0.8 0.6 0.4 0.2 0.0 AOD (440 nm)(a)
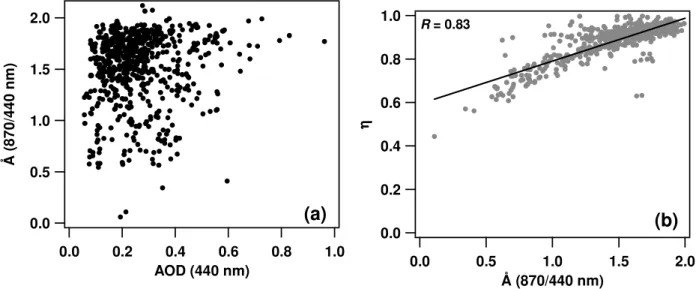
Fig. 3. (a) Scatter plot of the Angstrom coefficient ( ˚A) calculated from AOD values at 870 and 440 nm and the AOD at 440 nm retrieved from 240 AERONET measurements days between March 2003 and October 2004; (b) scatter plot of the fine mode fraction η at 440 nm versus ˚A. The regression line fitting the data points (black line) and the corresponding correlation coefficient R are also given in the figure.
Table 1. Measurement day percentages per Sector and per arrival
pressure level.
Percentages Sector A Sector B Sector C Sector M
Total 32% 3% 3% 62%
950 hPa 29% 0% 1% –
850 hPa 30% 2% 3% –
700 hPa 28% 3% 3% –
500 hPa 10% 3% 3% –
We mention that 62% of the measurement days were char-acterized by backtrajectories that do not allow defining the aerosol source sector. Aerosols monitored on these days are considered due mostly to mixed source regions (Sector M). The aerosol parameters of a measurement day characterized by a mixed advection pattern, are analyzed and discussed in the following section. Table 1 provides the measurement-day percentages per Sector in addition to the percentages referring to the back trajectories having 950, 850, 700, and 500 hPa arrival pressure level.
4 Aerosol properties over south-east Italy
A general description of the aerosol properties over the AERONET monitoring station is at first given in this sec-tion. Figure 3a shows the Angstrom coefficient calculated from AOD values at 870 and 440 nm, versus the AOD at 440 nm. AODs depend on aerosol load, while ˚A depends on the aerosol size distribution: typical values range from ˚A
>2.0 for fresh smoke particles, which are dominated by
ac-cumulation mode aerosols to nearly zero for large dust par-ticles (Dubovik et al., 2000). Therefore, the ˚A-AOD scatter-plot gives us a qualitative indication on the aerosol load due to particles of different size: particles of different size (type) tend to concentrate in different areas of the plot and this can allow inferring aerosol of different origin. A total of 658 measurements derived from 240 measurement days are re-ported in Fig. 3a showing that ˚A and AOD values vary within the 0.1–2.2 and the 0.1–1.0 range, respectively. In addition, Fig. 3a reveals either that small particles (1.2< ˚A<2) lead-ing to AODs within the 0.1–0.4 range are predominant and that highest AOD values (>0.6) are due to fine mode parti-cles. Aerosol size is a key parameter to separate natural from man-made aerosol. The anthropogenic aerosol is dominated by fine-mode particles, while natural aerosol contains a sub-stantial component of coarse-mode particles (e.g. Kaufman et al., 2001). The AERONET inversion algorithm allows re-trieving volume particle size distributions and all particles with radius 0.06 µm≤r<0.6 µm are considered fine, while those with 0.6 µm≤r≤8.8 µm are considered coarse. The predominant role of fine-mode particles over south-east Italy is better revealed by Fig. 3b showing the fine mode fraction
ηat 440 nm versus ˚A. η is the ratio between the fine-mode and the total optical depth at 440 nm. We observe that η val-ues, which are quite correlated to ˚A values (correlation co-efficient=0.83), vary within the 0.5–1.0 range. In particular,
η values within the 0.8–1.0 range are predominant (88%). Hence, anthropogenic particles are predominant over south-east Italy and are responsible of the highest AODs.
It is worth observing that the comparison of Fig. 3a of this paper with Fig. 2 of the paper by Pace et al. (2006), and Fig. 5 of the paper by Fotiadi et al. (2006), provides
900 800 700 600 500 400 h P a 08/23 08/25 08/27 08/29 month/day (b) 70 60 50 40 30 20 L a ti tu d e ( d e g re e s ) -60 -40 -20 0 20 40 60 Longitude (degrees) 900 800 700 600 500 400 (a)
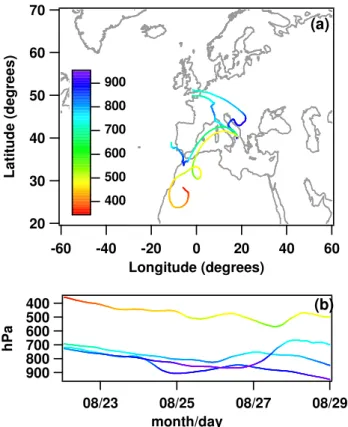
Fig. 4. (a) 5-day analytical backtrajectories of 29 August 2003 at
12:00 UTC arrival time; (b) altitude change as a function of time of each backtrajectory.
a quite significant indication on the dependence of the ˚A -AOD scatter plot on the location of the monitoring site in the central-east Mediterranean Sea. The data reported by Pace et al. (2006) show, despite the results of this paper, that large-size particles characterized by ˚A values within the 0.5– 0.3 range and by AOD values at 496 nm within the 0.2—0.8 range are predominant at Lampedusa that is ∼140 km away from the Africa coast. Coarse mode particles are also re-sponsible of the highest AOD values. According to Pace et al. (2006), the particles advected at Lampedusa from Euro-pean countries, are responsible of ˚A and AOD values within the 1–2 and the 0.1–0.6 range, respectively. The amount and properties of aerosols in the eastern Mediterranean island of Crete were found by Fotiadi et al. (2006) to be strongly deter-mined by the marine environment involving low concentra-tions of sea-salt aerosols produced by sea-spray, which con-stitute the background conditions. ˚A and AOD values were also influenced by dust aerosols mainly from African deserts, and secondarily from the Middle-East and Anatolian plateau. As a consequence, coarse mode particles also are predomi-nant at Crete and are responsible of the highest AOD val-ues. The transport of pollution fine aerosols from Europe and Turkey is responsible at Crete of the particles with ˚A values within the 1–2 range, in accordance with the results
of Lampedusa and Lecce. However, fine-mode particles and hence, the aerosol of anthropogenic origin is responsible at Crete of AODs <0.2. The larger distance of Crete from con-tinental polluted regions is responsible of these last results. In conclusion, the above reported discussion highlights that, in contrast to Lampedusa and Crete that are more affected by coarse mode particles mostly of natural origin, south-east Italy is more affected by fine-mode particles and hence by anthropogenic aerosol.
The aerosol parameters retrieved on 29 August 2003 are analyzed in this Section to show as an example, how aerosol properties can vary within few hours as a consequence of a mixed advection pattern. Figure 4 showing the backtrajec-tories of 29 August at 12:00 UTC, reveals that the 950 and 850 hPa air masses are advected from Sector A, while the 700 and 500 hPa air masses are advected from Sectors C and B, respectively. AERONET retrievals indicate that the aerosol monitored on the early morning (05:24 UTC) was character-ized by ˚A=1.5 and AOD=0.24. In contrast, aerosol proper-ties were characterized by ˚A=0.4 and AOD=0.4 in the early afternoon (14:45 UTC). Grey arrows indicate in Fig. 5b the data points retrieved on 29 August. ˚A and AOD values indi-cate that fine-mode particles probably advected from north-east Europe were present over south-north-east Italy on the early morning. In contrast, coarse-mode particles (probably from north-west Africa) determining a quite large aerosol load were predominant on the afternoon. In addition to backtra-jectories, MODIS images by Terra and Aqua satellites (http: //rapidfire.sci.gsfc.nasa.gov/realtime/2008029/) were used to support last comments: the image by Terra reveals that a dust plume was present over the Tyrrhenian Sea at 09:45 UTC, while the image by Aqua indicates that the dust plume was rather close to south-east Italy at 11:20 UTC.
The above reported discussion besides revealing the abil-ity of the AERONET inversion algorithm to follow aerosol property changes shows the importance of using single mea-surements instead of daily averaged data, to properly charac-terize aerosol properties of different source regions.
5 Aerosol properties and source regions
AERONET products including AOD, single scattering albedo, asymmetry factor, Angstrom coefficient, fine-mode fraction, and lidar ratio are used in this section to character-ize aerosol properties of different source regions. We men-tion that AOD, η, SSA, g, are the main parameters needed to incorporate aerosol particles into global climate models and evaluate aerosol direct radiative effects (Lyamani et al., 2004).
5.1 Analysis of AOD and ˚A data for all Sectors
Figure 5a shows ˚A versus AOD at 440 nm for the selected aerosol source Sectors: both grey open and full dots represent
2.0 1.5 1.0 0.5 0.0 Å ( 87 0/ 44 0 n m ) 1.0 0.8 0.6 0.4 0.2 0.0 AOD (440 nm)
(b)
Sect M 2.0 1.5 1.0 0.5 0.0 Å ( 87 0/ 44 0 n m ) 1.0 0.8 0.6 0.4 0.2 0.0 AOD (440 nm) Sect A Sect A Sect B Sect C(a)
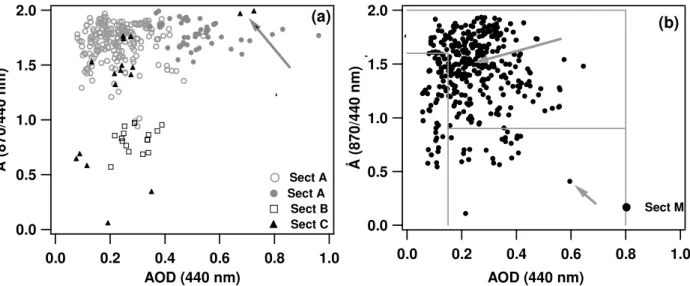
Fig. 5. (a) ˚A versus AOD at 440 nm for aerosol of different source Sectors: both grey open and full dots represent data referring to Sector A aerosol. In particular, grey full dots represent data that could be affected by the advection of biomass burning particles (BB).Open boxes and full triangles represent data of Sector B and C aerosol, respectively; (b) ˚A versus AOD of the Sector M aerosol. Grey solid lines represent the aerosol mask applied to the data points.
40 30 20 10 0 F re q u e n c y o f o c c u re n c e ( % ) 0.8 0.6 0.4 0.2 0.0 AOD Sector B (spheric) Sector C Sector M (b) 40 30 20 10 0 F re q u e n c y o f o c c u re n c e ( % ) 0.8 0.6 0.4 0.2 0.0 AOD Sector A_tot Sector A_spring Sector A_summer Sector A_autmn (a)
Fig. 6. (a) AOD frequency of occurrence plot for Sector A aerosol (grey line), and for summer (black dashed line), spring (black full line),
and autumn (black dotted line) AOD data.; (b) AOD frequency plot of Sector B (dotted line), C (full black line), and M (dashed grey line) aerosol.
data referring to the Sector A aerosol. In particular, grey open dots represent the parameters of aerosol loads advected from the urban/industrial Sector A regions. In contrast, grey full dots represent the parameters of aerosol loads also af-fected by the advection of biomass burning particles from Sector A regions. In addition to backtrajectories, fire maps retrieved by MODIS satellite images were used (http://maps. geog.umd.edu/firms/) to infer the advection of biomass
burn-ing particles over south-east Italy. Open boxes and full trian-gles in Fig. 5a represent aerosol data of the Sector B and C aerosol, respectively. We observe from Fig. 5a that fine-mode particles (0.94< ˚A<2.0) that are also responsible of the high-est AODs are advected over south-east Italy from Sector A. In contrast, large size particles (0.57< ˚A<0.96) are advected from Sector B. Particles of variable size that are on average responsible of rather low AODs are advected from Sector C.
50 40 30 20 10 0 F re q u e n c y o f o c c u re n c e ( % ) 1.0 0.9 0.8 0.7 0.6 0.5 η ηη η Sector B (spheric) Sector C Sector M (b) 50 40 30 20 10 0 F re q u e n c y o f o c c u re n c e ( % ) 1.0 0.9 0.8 0.7 0.6 0.5 η ηη η Total BB not BB Sector A (a)
Fig. 7. (a) η frequency of occurrence plot of Sector A aerosol (grey line). Black and dotted lines represent in the figure data referring to
aerosol affected (BB) and not-affected (not BB) by biomass burning particles, respectively, (b) η− frequency distribution plot for particles advected from Sector B (black dotted line), from Sector C (black line) and from Sector M (grey dashed line).
The results of Fig. 5a are in accordance with previous stud-ies (e.g. Pace et al., 2006; Fotiadi et al., 2006). The aerosol from Sector A, which travels over urban/industrial environ-ments before getting to the monitoring site, is dominated by fine-mode particles (Remer and Kaufman, 1998; Dubovik et al., 2002), while the one advected from desert regions (Sector B) is strongly dominated by coarse-mode particles. Sector C data (Fig. 5a, full triangles) show that in maritime conditions, the relative contribution of coarse particles, although vari-able (Smirnov et al., 2002), is generally higher than that in urban/industrial environments and lower than that for desert dust (Dubovik et al., 2002).
Figure 5b shows ˚A versus AOD for aerosol loads moni-tored on measurement days for which it was not possible to infer the aerosol source sector in accordance with the crite-ria defined in Sect. 3 (Sector M). Vacrite-riability ranges of both ˚A and AOD values are rather similar to those of Fig. 5a. Hence, Sector M aerosol parameters (Fig. 5b) are similar to the com-bination of the aerosol parameters that characterize particles from Sector A, B, and C.
Figure 6a (grey line) shows the AOD frequency of oc-currence plot of the total Sector A aerosol, and for sum-mer (black dashed line), spring (black full line), and autumn (black dotted line) measurements. Data points of winter months were not available for the lack of AERONET mea-surements. We observe from Fig. 6a (dashed line) that the summer-AOD frequency plot is bimodal with a main peak at
∼0.2 and a secondary peak at ∼0.5. Figure 5a indicates that AOD values larger than 0.4 are mostly due to aerosol affected by biomass burning particles. In fact, most of forest fires oc-cur on summer. Hence, AODs <0.4 are mostly due to
con-tinental urban/industrial aerosol. Figure 6a shows that AOD values of autumn (dotted line) and spring (solid black line) measurements are smaller (0.08–0.5) than those retrieved on summer, as it is generally observed over the Mediterranean basin (e.g. Gerasopoulos, 2005), where the aerosol load is on average larger in summer for the lack of rainy days, which favor the accumulation of aerosol particles and for the larger solar irradiance that favors the production of photochemical smog. Figure 6b shows for comparison the AOD frequency plot of the Sector B- (dotted line), C- (full black line), and M-aerosol (dashed grey line). We observe from Fig. 6b that par-ticles from Sector C and M are responsible of AODs varying up ∼0.7. In contrast, Sector B AODs vary within the 0.2–0.4 range with an average of 0.29±0.05.
5.2 Sector A: analysis of η, SSA, g, and Lr parameters
Figure 7a (grey line) shows the η frequency of occurrence plot of the total Sector A aerosol and for the aerosol affected (black line) and not-affected (dotted line) by biomass burn-ing particles. η-values span the 0.8–1.0 range and are peaked at ∼0.94. The SSA- and the g- frequency distribution plot of the total Sector A aerosol are shown in Fig. 8a (grey line) and 9a (grey line), respectively. Black and dotted lines rep-resent in both figures data referring to aerosol affected and not-affected by biomass burning particles, respectively. 1.5 level SSA data were plotted in Fig. 8a, since level 2 data were not available. We observe from Fig. 8a (grey line) that SSA values vary between 0.8 and 1 with an average of 0.93±0.03. Figure 9a (grey line) reveals that g values vary within the 0.6–0.74 range with an average of 0.67±0.03. The
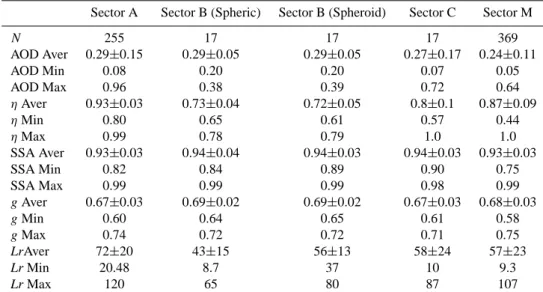
Table 2. Variability ranges, yearly average with standard deviations and number of data points (N ) of the investigated parameters for
air-masses originating from different sectors.
Sector A Sector B (Spheric) Sector B (Spheroid) Sector C Sector M
N 255 17 17 17 369 AOD Aver 0.29±0.15 0.29±0.05 0.29±0.05 0.27±0.17 0.24±0.11 AOD Min 0.08 0.20 0.20 0.07 0.05 AOD Max 0.96 0.38 0.39 0.72 0.64 ηAver 0.93±0.03 0.73±0.04 0.72±0.05 0.8±0.1 0.87±0.09 ηMin 0.80 0.65 0.61 0.57 0.44 ηMax 0.99 0.78 0.79 1.0 1.0 SSA Aver 0.93±0.03 0.94±0.04 0.94±0.03 0.94±0.03 0.93±0.03 SSA Min 0.82 0.84 0.89 0.90 0.75 SSA Max 0.99 0.99 0.99 0.98 0.99 gAver 0.67±0.03 0.69±0.02 0.69±0.02 0.67±0.03 0.68±0.03 gMin 0.60 0.64 0.65 0.61 0.58 gMax 0.74 0.72 0.72 0.71 0.75 LrAver 72±20 43±15 56±13 58±24 57±23 Lr Min 20.48 8.7 37 10 9.3 Lr Max 120 65 80 87 107 80 60 40 20 0 F re q u e n c y o f o c c u re n c e ( % ) 1.00 0.95 0.90 0.85 0.80 SSA Sector B (spheric) Sector C Sector M (b) 80 60 40 20 0 F re q u e n c y o f o c c u re n c e ( % ) 1.00 0.95 0.90 0.85 0.80 SSA Sector A Total BB not BB (a)
Fig. 8. (a) SSA frequency of occurrence plot of Sector A aerosol (grey line). Black and dotted lines represent in the figure data referring to
aerosol affected (BB) and not-affected (not BB) by biomass burning particles, respectively. (b) SSA-frequency distribution plot for particles advected from Sector B (black dotted line), from Sector C (black line) and from Sector M (grey dashed line).
comparison between the solid- and the dotted-black line both in Fig. 8a and in Fig. 9a, shows that the variability range of SSA and g values extends toward lower values for the aerosol not affected by biomass-burning particles, as a consequence of the larger presence of smaller-size, more-absorbing parti-cles. Variability ranges and mean values of the aerosol pa-rameters above analyzed are given in Table 2. According to d’ Almeida et al. (1991) and Hess et al. (1998), AOD,
η, SSA, and g frequency distribution plots indicate that the
Sector A aerosol can be considered representative of “con-tinental average aerosol”, mostly made of water soluble and a small amount of soot and insoluble components. A clo-sure study between a 2.5-year data set of Raman lidar mea-surements (performed in Lecce within the European Aerosol Research Lidar Network) and a numerical model, also in-dicated that rather clean continental aerosols, with water-soluble fine-mode aerosol accounting for 98–99% of the total number of particles, characterized the aerosol load advected
50 40 30 20 10 0 F re q u e n c y o f o c c u re n c e ( % ) 0.72 0.68 0.64 0.60 g Sector B (spheric) Sector C Sector M
(b)
50 40 30 20 10 0 F re q u e n c y o f o c c u re n c e ( % ) 0.72 0.68 0.64 0.60 g Sector A Total BB not BB(a)
Fig. 9. (a) g frequency of occurrence plot of Sector A aerosol (grey line). Black and dotted lines represent in the figure data referring to
aerosol affected (BB) and not-affected (not BB) by biomass burning particles, respectively. (b) g− frequency distribution plot for particles advected from Sector B (black dotted line), from Sector C (black line) and from Sector M (grey dashed line).
over south-east Italy from north and east European countries (Barnaba et al., 2007).
The lidar ratio Lr that is mainly retrieved from Raman li-dar measurements (e.g. De Tomasi et al., 2006) also is used to characterize aerosols of different type. Lr at the wave-length λ is calculated from AERONET products according to the following equation (e.g. Muller et al., 2003; Cattrall et al., 2005):
Lr(λ)= 4π
SSA(λ)P (λ,180◦) (1)
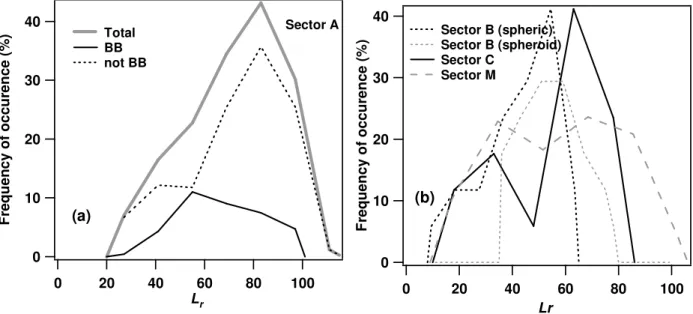
whereP (λ, 180◦)represents the phase function at 180◦. Fig-ure 10a (grey solid line) shows the Lr frequency of occur-rence plot for λ=440 nm and for the total Sector A aerosol. Black and dotted lines represent in Fig. 10a the Lr frequency of distribution plot due to aerosol affected and not-affected by biomass burning particles, respectively. Figure 10a (grey solid line) reveals that total Lr values vary between 20 and 120 sr and are peaked at ∼=80 sr. These data are in satisfac-tory accordance with those retrieved by Raman lidar mea-surements at 351 nm performed in Lecce during 2.5 year measurements, which provided lidar ratios spanning the 5– 130 sr range (Barnaba et al., 2007) for air masses advected from north and east-European countries. Figure 10a (black solid line) indicate that 70% of the Lr values due to aerosol affected by biomass burning particles vary within the 40– 80 sr range. Cattrall et al. (2005) analyzing AERONET measurements from 26 sites across the world, also revealed that lidar ratios at 550 nm of biomass-burning aerosol var-ied within the 40–80 sr range and were peaked at 60 sr, in
accordance with the results of this paper. In addition, Cat-trall et al. (2005) found that the urban-industrial aerosol was characterized by Lr values varying within the 40-100 sr range and peaked at 71 sr. Figure 10a (black dotted line) showing Lr values of urban/industrial aerosol not affected by biomass burning particles, reveals that Lr values vary within the 20–120 sr range and that 70% of the Lr values vary within the 85–120 sr range, in accordance with the re-sults by Cattrall et al. (2005) for urban/industrial aerosol. In conclusion, the above reported analysis indicates that air masses carrying moderately-absorbing (0.8<SSA<1.0 and 20 sr <Lr<120 sr), fine-mode (0.8<η<1.0 and 0.6<g<0.8) particles are advected over south-east Italy and hence over the central Mediterranean basin, from the urban/industrial European countries. In addition, during summer, these air-masses are responsible for rather high aerosol loads (AOD>0.5) contributed by biomass burning aerosol.
Finally, it is worth noting from Table 2 that 88% of the 289 classified data points are representative of the “continen-tal average aerosol” advected from Sector A source regions. Hence, the aerosol advected from Sector A is predominant over that advected from Sector B and C.
5.3 Sector B: analysis of η, SSA, g, and Lr parameters
Figures 7b–10b show by black dotted lines η, SSA-, g-, and Lr-frequency distribution plots for aerosol particles from Sector B. Variability ranges and average values of the in-vestigated parameters are given in Table 2. All data of Figs. 7b–10b were retrieved for aerosol particles that are
40 30 20 10 0 F re q u e n c y o f o c c u re n c e ( % ) 100 80 60 40 20 0 Lr Sector B (spheric) Sector B (spheroid) Sector C Sector M (b) 40 30 20 10 0 F re q u e n c y o f o c c u re n c e ( % ) 100 80 60 40 20 0 Lr Sector A Total BB not BB (a)
Fig. 10. (a) Lr frequency of occurrence plot for λ=440 nm of Sector A aerosol (grey line) and for aerosols affected (black solid line) (BB)
and not-affected (black dotted line) (not BB) by biomass burning particles, respectively. (b) Lr -frequency distribution plot for particles advected from Sector B (black dotted line), Sector C (black line) and Sector M (grey dashed line). The grey dotted line represents the - Lr frequency distribution plot of the values calculated by the spheroid model.
assumed to be polydisperse homogeneous spheres with the same complex refractive index. However, it is well known that latter assumption misleads AERONET inversion prod-ucts when the aerosol load is significantly affected by non-spherical particles and aerosols from Sector B are signifi-cantly affected by desert type particles, which are flattened and irregular in shape (Dubovik et al., 2000). The par-ticle non-sphericity leads to a not-negligible reduction of the backscatter efficiency compared to the one of surface equivalent spheres (e.g. Barnaba et al., 2005). As a result, there have been numerous efforts to account for particle non-sphericity in aerosol retrieval algorithms (e.g. Dubovik et al., 2002; Mishchenko et al., 2003). It was shown by Dubovik et al. (2006) that in dust dominated environments the use of polydisperse, randomly oriented spheroids leads to a signifi-cant improvement in retrieving the size distribution and real refractive index (Dubovik et al., 2002). A spheroid (ellip-soid of revolution) is the simplest nonspherical shape that can generalize the spherical shape (a sphere is a spheroid with an axis ratio equal to one). Variability ranges and av-erage values of the Sector B aerosol parameters retrieved by the spheroid model are given in Table 2. The compar-ison between η-, SSA-, and g- values by the spheroid and the spherical model revealed that the percentage variations were lower than 5%. In contrast, lidar ratio values by the spheroid model were significantly larger than the values pro-vided by the spherical model: percentage variations of the values provided by the two models were as high as 100% (e.g. Barnaba et al., 2005). In accordance with Eq. (1), the li-dar ratio increases with the backscatter efficiency reduction.
Figure 10b shows by grey dotted line the frequency distribu-tion plot of Lr values by the spheroid model and we observe that the lidar ratio values vary within the 37–80 sr range with an average of 56±13 sr. These results are in satisfactory ac-cordance with those reported by Cattrall et al. (2005). Ana-lyzing AERONET aerosol products of Africa and Saudi Ara-bia sites significantly affected by desert dust, they found at 550 nm that lidar ratio values by the spherical model varied within the 10–20 sr range and were peaked at 15 sr. In con-trast, lidar ratios by the spheroid model were peaked at 42 sr and varied within the 20–60 sr range. The results of Fig. 10b (grey dotted line) are also in satisfactory accordance with Lr values retrieved over south-east Italy by Raman-lidar mea-surements at 351 nm (e.g. De Tomasi et al., 2003), which combined with model calculations, revealed that an average lidar ratio of 47 sr could be used to characterize Sahara dust particles over south-east Italy (Barnaba et al., 2004).
ηvalues that vary within the 0.61–0.79 range (Table 2) in-dicate that the Sector B aerosol advected to south-east Italy is also quite affected by the contribution of fine-mode parti-cles. In fact, a recent Sahara dust event study by complemen-tary remote sensing measurements and ground observations revealed that the anthropogenic fine mode aerosol was over south-east Italy more than 50% of the total aerosol load dur-ing a dust outbreak (Bellantone et al., 2008). η values smaller than 0.5 were generally retrieved both at Lampedusa and Crete during dust outbreaks. The larger η values retrieved over south-east Italy may be partially due to the sedimenta-tion of large-size dust particles, since south-east Italy is at a larger distance from desert source regions than Lampedusa
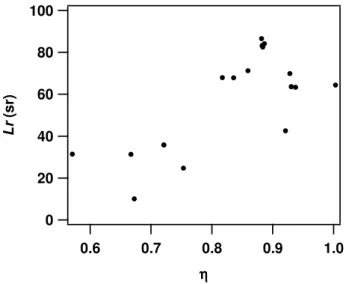
100 80 60 40 20 0 L r (s r) 1.0 0.9 0.8 0.7 0.6 η η η η
Fig. 11. Lr values by the spheroid model versus η of the Sector C
aerosol.
and Crete. However, the contribution of polluted particles from marine and continental areas crossed by the desert air masses before reaching south-east Italy can represent a sig-nificant contributing factor. SSA and g variability ranges and average values support last comment. According to Dubovik et al. (2002) desert dust at Cape Verde was characterized at 440 nm by SSA=0.93±0.01 and g=0.73±0.04. In contrast, Table 2 shows both that SSA values span the 0.89–0.99 range with an average of 0.94±0.03, and that g values span the 0.65–0.72 range with an average of 0.69±0.02. The larger (smaller) SSA (g) mean value found over south-east Italy with respect to that of Cape Verde can be explained by as-suming that desert dust particles advected over south-east Italy were also affected by the contribution of moderately-absorbing, fine-mode particles. Finally, we mention that Ta-ble 2 reveals that only 6% of the 289 Sector A-C data points were representative of polluted desert-dust aerosol advected from Sector B source regions. As a consequence, desert-dust is a minor aerosol component over south-east Italy.
5.4 Sector C: analysis of the η, SSA, g, and Lr parameters
Black lines represent in Figs. 7b–10b η-, SSA-, g-, and Lr-frequency distribution plots of Sector C aerosol. Variability ranges and mean values of the investigated parameters are given in Table 2, which also shows that AODs span the 0.07– 0.72 range with a mean value of about 0.27±0.17. According to Hess et al. (1998) and Smirnov et al. (2003) clean maritime particles are responsible of AODs at 440 nm smaller than 0.2. Hence, the Sector C aerosol is expected to be maritime pol-luted. SSA- and g- variability ranges support last comment. According to d’Almeida et al. (1991), sea-salt and oceanic particles are characterized at 450 nm by SSA and gvalues close to 1 and 0.79, respectively. In addition, Dubovik et al. (2002) showed that the oceanic aerosol is characterized at
440 nm by AOD ≤0.15, SSA=0.98±0.03, and g=0.75±0.04. Despite the results by d’Almeida et al. (1991) and Dubovik et al. (2002), Fig. 8b (solid line) shows that SSA values span the 0.90–0.98 range with a mean value of 0.94±0.03 and Fig. 9b reveals that g values that span the 0.61–0.71 range, have a mean value of 0.67±0.03. The smaller SSA and g values of this paper with respect to the ones reported by d’Almeida et al. (1991) and Dubovik et al. (2002) for marine aerosol can be explained by assuming that fine-mode and moderately-absorbing particles of non-marine origin affect the Sector C aerosol. In fact, the rather high AOD values indicated by the arrow in Fig. 5a are possibly due to contamination by biomass burning particles. They were retrieved on 9 Septem-ber 2003 at 15:37 UTC and 14:07 UTC, respectively and in accordance with bactrajectories and satellite fire maps, the air masses advected from the Atlantic crossed fire affected sites before reaching south east Italy. The marked bimodal structure of both the η- and the Lr-frequency distribution plot (Figs. 7b and 10b, solid line) and Fig. 11 showing the Lr ver-sus η scatterplot, also allow inferring that two main aerosol classes contribute to the Sector C aerosol. We observe from Fig. 11 that Lr values span the 10-36 sr range when η values vary within the 0.57–0.75. In contrast aerosol loads terized by η values spanning the 0.8–1.0 range are charac-terized by Lr values varying within the 42–86 sr range. Ac-cording to Ackerman (1998), the maritime aerosol is charac-terized at 355 nm by Lr values varying within the 17–24 sr range, while the continental aerosol, which consists of insol-uble, soot, and water soluble components, is characterized by lidar ratios spanning the 43–70 sr range. Cattrall et al. (2005) revealed that at 550 nm, lidar ratio values of oceanic par-ticles spanned the 20–40 sr range, while Lr values of ur-ban/industrial aerosol varied within the 40–100 sr range. In addition, Cattrall et al. (2005) showed that oceanic particles were characterized by Angstrom coefficient values spanning the 0.3–1.2 range, while ˚A values of urban/industrial aerosol varied within the 1.6–2.0 range. Finally, lidar measurements over south-east Italy by an elastic-Raman lidar operating at 351 nm, combined with model calculations, revealed that an average lidar ratio of 29 sr can be used to characterize mar-itime aerosols (Barnaba et al., 2004) over south-east Italy. In accordance with the above reported discussion, the Sector C aerosol characterized by Lr and η values spanning the 10– 36 sr and the 0.57–0.75 range, respectively can be considered of maritime type. In contrast, the Sector C aerosol character-ized by Lr and η values spanning the 42–86 sr and the 0.8–1.0 range, respectively can be considered of maritime-polluted type. Last results are mostly determined by the geographi-cal location of south-east Italy: oceanic particles generally cross urban/industrial area in the Mediterranean basin before reaching south-east Italy. Barnaba et al. (2004) also showed that the classification of cases of clean marine aerosols was particularly complex in the Mediterranean, due to the influ-ence of the surrounding continents and the limited dimension of the basin.
5.5 Sector M: analysis of η, SSA, g, and Lr parameters
In accordance with the backtrajectory analysis and the crite-ria defined in Section 3, 62% of the 240 measurements days were characterized by advection patterns that did not allow defining the aerosol source Sector (Sector M). Frequency dis-tribution plots of AOD, η, SSA, g, and Lr values of the Sector M aerosol are plotted in Figs. 6b–10b by grey dashed lines. Variability ranges and mean values of Sector M aerosol pa-rameters are given in Table 2. Both Table 2 and Fig. 5 indi-cate that Sector M aerosol parameters are similar to the com-bination of the aerosol parameters that characterize particles from Sector A, B, and C.
The mixing of different particle types is mainly expected to occur when the advection pattern changes with time of the day and as a consequence, it is not possible to infer the aerosol source Sector. A typical example of measurement day characterized by a mixed advection pattern was analyzed in Section 4, where it was shown that the aerosol properties significantly varied within few hours as a consequence of the advection pattern change.
The aerosol mask method (Barnaba and Gobbi, 2004), which represents a valuable tool to classify aerosol of differ-ent type, was applied to the Sector M data points of Fig. 5b to separate the contribution of maritime, continental and desert dust aerosol: the main aerosol components over the Mediter-ranean basin. According to Dubovik et al. (2002), we as-sumed that maritime particles were represented in the ˚A versus AOD scatterplot of Fig. 5b by the data points with AOD<0.15 and ˚A≤1.6. Data points characterized by AOD
≥0.15 and ˚A≤0.9 were considered representative of desert dust particles, while all the data points that could not be as-cribed to maritime and desert dust particles were considered representative of continental urban/industrial particles. Solid lines in Fig. 5b define the data point areas that are representa-tive of different aerosol types. In accordance with the aerosol mask criteria, it was found that 6%, 14%, and 80% of the 369 data points of Fig. 5b were representative of desert dust, mar-itime and continental aerosol particles, respectively. Latter results are in satisfactory accordance with the percentage val-ues obtained by analyzing bactrajectories to infer the aerosol contribution from Sector A, B, and C source regions, respec-tively. Hence, aerosol mask results further more show that the contribution of continental urban/industrial aerosol was predominant over south-east Italy and that Sector M aerosol properties were similar to the ones obtained by combining Sector A, B, and C aerosol properties. The comparison be-tween the Sector M AOD frequency of occurrence plot with the AOD frequency of occurrence plot due to the total aerosol load from Sector A, B, and C, revealed that the differences were lower than 5%.
6 Summary and conclusion
Aerosol measurements from the AERONET station in Lecce over south-east Italy, combined with five-day backtrajecto-ries were analyzed to characterize aerosol properties over the Central Mediterranean basin, to assess the influence to the aerosol load of long-range transport from various regions, and to study the mixing of different aerosol types. The aerosol data include AOD, single scattering albedo, asym-metry factor, Angstrom coefficient, fine-mode fraction, and lidar ratio retrieved from measurements performed in the pe-riod March 2003–October 2004. 5-day analytical backtrajec-tories were also used to characterize main advection patterns over the Lecce AERONET site. In particular, three broad geographical sectors were defined as aerosol source regions: Sector A, which includes all continental European sources with the exception of Spain; Sector B, which includes the Southern Mediterranean Sea and the Africa continent; Sec-tor C, which includes the Western Mediterranean, the Iberian Peninsula, and the Atlantic Ocean. The time spent by the trajectories in a Sector up to the measurement day was also considered to better define the aerosol origin sector. We found that 32% of the 240 measurement days were charac-terized by air masses coming from Sector A, while 3% of the measurement days were characterized by air masses coming either from Africa deserts (Sector B) or from the Atlantic and Mediterranean Sea (Sector C). 62% of the measurement days were characterized by backtrajectories that did not al-low defining the aerosol source Sector according to the cri-teria adopted in this paper. The aerosol monitored on these days was considered due to mixed source regions (Sector M). Air masses from Sector A have the common property to travel across several urban and industrialized European areas before reaching Lecce. As a consequence, it was shown that Sector A air masses could be considered responsible for the transport of urban/industrial and biomass burning aerosols. In particular, the comparison of the Sector A aerosol parameter mean values (AOD=0.29±0.15, η=0.93±0.03, SSA=0.93±0.03, g=0.67±0.03, and Lr=72±20 sr) with pre-vious investigations revealed that a “continental average aerosol”, mostly made of water soluble and a small amount of soot and insoluble component was advected over south-east Italy from Sector A source regions. The analysis of the Sector B aerosol parameters, which were character-ized by AOD=0.29±0.05, η=0.72±0.05, SSA=0.94±0.03,
g=0.69±0.02, and Lr=56±13 sr, revealed that desert dust particles advected over south-east Italy were also affected by the contribution of moderately-absorbing, fine-mode parti-cles as those due to water soluble species: the predominant component of the “continental average aerosol” that is ad-vected over the Mediterranean basin by the European con-tinent. Hence, it was shown that polluted-desert dust par-ticles were advected over south east Italy from Sector B source regions. It was also found that Sector C air masses were responsible for the advection over south-east Italy of
maritime-polluted aerosol due to marine and to lesser ex-tent anthropogenic particles from the Atlantic Ocean and/or the Western Mediterranean regions crossed by the Sector C air masses before reaching Lecce. Sector C aerosol parameter mean values (AOD=0.27±0.17, η=0.8±0.1, SSA=0.94±0.03, g=0.67±0.03, and Lr=58±24 sr) were compared to the values reported by previous studies to reach the above mentioned conclusion.
Table 2 revealed that 289 data points were ascribed to well defined source Sectors, In particular, 88% of the 289 mea-surement data were representative of “continental average aerosol” advected from Sector A source regions, while 6% of measurement data were representative of polluted desert-dust aerosol advected from Sector B source regions and of maritime-polluted aerosol advected from Sector C source regions, respectively. Hence, that the aerosol load over south-east Italy, in the central Mediterranean is dominated by “continental average aerosol” mostly made of moderately-absorbing, fine-mode particles even if it is also affected by the minor contribution of desert and maritime type aerosol. The results obtained by the application of an aerosol mask to the data points of Sector M, further more supported last comment. In accordance with the aerosol mask criteria it was found that 80% of the 369 Sector M data points were representative of “continental average aerosol”, while 14% and 6% of the data points were representative of maritime and desert-dust aerosol, respectively.
The geographical location of south-east Italy that is rather close to continental European regions is considered responsi-ble of the predominant contribution of the “continental aver-age aerosol” to the aerosol load of south-east Italy. Maritime-polluted and desert dust-Maritime-polluted particles were also ad-vected over south-east Italy from Sector C and B air masses, respectively. As a consequence, variability ranges and means values of the investigated aerosol parameters did not sig-nificantly vary from Sector to Sector with few exceptions. In particular, we found that η and Lr average values were quite affected by the air mass source Sector, while AOD, SSA and g average values were not significantly dependent on air mass source Sector. Finally, the comparison between the results of this paper with those retrieved at Lampedusa and Crete, reveled that the contribution of continental type aerosol made of fine-mode moderately absorbing particles reduces for Mediterranean coastal sites away from the Eu-ropean continent. In fact, it was shown that at Crete in the center of the eastern Mediterranean basin, continental ur-ban/industrial and biomass burning aerosols were responsi-ble of AODs lower than ∼0.2. In contrast, the coarse-mode aerosols mostly due to natural sources dominated the total columnar volume of particles during all seasons except for summer, when they were of equal importance to fine parti-cles. Hence, we believe that the mean properties of the south-east Italy aerosol load can be considered representative of most Mediterranean coastal sites rather close to the European continent and away from large sources of local pollution.
In conclusion, the results of this paper beside revealing that the aerosol characterization over the Mediterranean is complicated by the fact that a large number of sources and hence of aerosol species contribute to it, have contributed to the aerosol characterization over the Mediterranean, provid-ing valuable data for future studies devoted to the evaluation of the direct radiative forcing by aerosols for this region.
Acknowledgements. This work was supported by Ministero dell’
Istruzione dell’Universit`a e della Ricerca of Italy, (Programma di Ricerca di Interesse Nazionale 2006. Prot. 2006027825), by the European Project EARLINET-ASOS (2006 -2010, contract n. 025991), by Progetto FIRS AEROCLOUDS and by Centro EuroMediterraneo per i Cambiamenti Climatici (CMCC).
Edited by: N. Mihalopoulos
References
Ackerman, J.: The extinction-to-backscatter ratio of tropospheric aerosol: A numerical study, J. Atmos. Oceanic. Technol., 15, 1043–1050, 1998.
Amiridis, V., Balis, D. S., Kazadzis, S., Bais, A., Giannakaki, E., Papayannis, A., and Zerefos, C.: Four-year aerosol ob-servations with Raman lidar at Thessaloniki, Greece, in the framework of EARLINET, J. Geophys. Res., 110, D21203, doi:10.1029/2005JD006190, 2005.
Balis, D. S., Amiridis, V., Zerefos, C., Gerasopoulos, E., Andreae, M. Zanis, P., Kazantzidis, S., and Papayannis, A.: Raman lidar and sunphotometric measurements of aerosol optical properties over Thessaloniki, Greece during a biomass burning episode, At-mos. Environ., 37, 4529–4538, 2003.
Balis, D. S., Amiridis, V., Nickovic, S., Papayannis, A., and Zere-fos, C.: Optical properties of Sahara dust layers as detected by a Raman lidar at Thessaloniki, Greece, Geophys. Res. Lett., 31, L13104, doi:10.1029/2004GL019881, 2004.
Barnaba, F. and Gobbi, G. P.: Aerosol seasonal variability over the Mediterranean region and relative impact of maritime, continen-tal and Saharan dust particles over the basin from MODIS data in the year 2001, Atmos. Chem. Phys., 4, 2367–2391, 2004, http://www.atmos-chem-phys.net/4/2367/2004/.
Barnaba, F., Tafuro, A. M., De Tomasi, F., and Perrone M.R.: Ob-served and simulated vertically resolved optical properties of continental aerosols over southeastern Italy: A closure study, J.Geophys. Res., 112, D10203, doi:10.1029/2006JD007926, 2007.
Bellantone, V., Carofalo, I., De Tomasi, F., Perrone, M. R., San-tese, M., Tafuro, A. M., and Turnone, A.: In situ samplings and remote sensing measurements to characterize aerosol properties over south-east Italy, in press by J. Atmos. Sci., 2008.
Cattral, C., Reagan, J., Thome, K., and Dubovik, O.: Variabil-ity of aerosol and spectral lidar and backscatter and extinc-tion ratios of key aerosol types derived from selected Aerosol Robotic Network locations, J. Geophys. Res., 110, D10SA11, doi:10.1029/2004JD005124, 2005.
Charlson, R. J., Langner, J., Rodhe, H., Leovy, C. B., and Warren, S. G.: Perturbation of the northern hemispheric radiative balance
by backscattering from anthropogenic surface aerosols, Tellus, 4AB, 152–163, 1991.
D’Almeida, G. A.: Atmospheric aerosols: global climatology and radiative characteristics, A Deepak Publishing, 1991.
De Tomasi, F., Blanco, A., and Perrone, M. R.: Raman lidar moni-toring of extinction and backscattering of ´Africa dust layers and dust characterization, Appl. Opt., 42, 1699–1709, 2003. De Tomasi, F., Tafuro, A. M., and Perrone, M. R: Height
and seasonal dependence of aerosol optical properties over south-east Italy, J. Geophys. Res., 111, D10203, doi:10.1029/2005JD006779, 2006.
Dubovik, O. and. King, M. D.: A flexible inversion algorithm for retrieval of aerosol optical properties from Sun and sky radiance measurements, J. Geophys. Res., 105, 20 673–20 696, 2000. Dubovik, O., Smirnov, A., Holben, B. N., King, M. D.,
Kauf-man, Y. J., Eck, T. F., and Slutsker, I.: Accuracy assessments of aerosol optical properties retrieved from AERONET sun and sky-radiance measurements, J. Geophys. Res., 105, 9791–9806, 2000.
Dubovik, O., Holben, B. N., Lapyonok, T., Sinyk, A., Mishechenko, M. I., Yang, P., and Slutsker, I.: Non-spherical aerosol retrieval method employing light scattering by spheroids, J. Geophys. Res. Lett., 29, 54-1–54-4, 2002.
Dubovik, O., Sinyuk, A., Lapyonok, T., Holben, B. N., Mishchenko, M., Yang, P., Eck, T. F., Volten, H., Munoz, O., Veihelmann, B., van der Zande, W. J., Leon, J-F, Sorokin, M., and Slutsker, I.: Application of spheroid models to account for aerosol particle nonsphericity in remote sensing of desert dust., J. Geophys. Res., 111, D11208, doi:10.1029/2005JD006619, 2006. Duncan, B. N. and Bey I.: A modelling study of the export pathways of pollution from Europe : seasonal and interan-nual variation (1987–1997), J. Geophys. Res., 109, D08301, doi:10.1029/2003JD004079, 2004.
Formenti, P., Andreae, M. O., Andreae, T.W., Galani, E., Vasaras, A., Zerefos, C., Amidiris, V., Orlovsky, L., Karnieli, A., Wendisch, M., Wex, H., Holben, B. N., Maenhaut, W., and Lelieveld, J.: Aerosol optical properties and large scale trans-port of air masses : Observations at a coastal and a seniarid site in the eastern Mediterranean during summer 1998, J. Geophys. Res., 106, 9807–9826, 2001.
Formenti, P., Reiner, O., Sprung, D., Andreae, M.O., Wendisch, M., Wex, H., Kindred, D., Dewey, K., Kent, J., Tzortziou, M., vasaras, A., and Zerefos, C.: The STAARTE-MED 1998 summer airborne measurements over the Aegean Sea :1. Arosol particles and trace gases, J. Geophys. Res., 107, 4450, doi:10.1029/2001JD001337, 2002.
Fotiadi, A., Hatzianastassiou, N., Drakakis, E., Matsoukas, C., Pavlakis, K. G., Hatzidimitriou, D., Gerasopoulos, E., Mi-halopoulos N., and Vardavas I.: Aerosol physical and opti-cal properties in the eastern Mediterranean Basin, Crete, from Aerosol Robotic Network data, Atmos. Chem. Phys., 6, 5399– 5413, 2006,
http://www.atmos-chem-phys.net/6/5399/2006/.
Gerasopoulos, E., Andreae, M. O., Zerefos, C., Andreae, T. W., Balis, D., Formenti, P., Merlet, P. Amiridis, V., and Papastefanou, C.: Climatological aspects of aerosol optical properties in Noth-ern Greece, Atmos. Chem. Phys., 3, 2025–2041, 2003,
http://www.atmos-chem-phys.net/3/2025/2003/.
Gerasopoulos, E., Kouvarakis, G., Vrekoussis, M., Kanakidou, M.,
and Mihalopoulos, N.: Ozone varability in the marine boundary layer of the Eastern Mediterranean based on 7-year observations, J. Geophys. Res., 110, D15309, doi:10.1029/2005 JD005991, 2005.
Giorgi, F., Bi, X. Q., and Qian, Y.: Direct radiative forcing and re-gional climatic effects of anthropogenic aerosols over East Asia: A regional coupled climate-chemistry/aerosol model study, J. Geophys. Res., 107(D20), 4439, 2002.
Giorgi, F.: Climate change hot-spots, J. Geophys. Res., 33, L08707, doi:10.1029/2006GL025734, 2006.
Hatzianastassiou, N., Katsoulis, B., and Vardavas, I.: Global dis-tribution of aerosol direct radiative forcing in the ultraviolet and visible arising under clear skies, Tellus, 56B, 4679–4690, 2004. Hess, M., Koepke, P., and Schult, I.: Optical Properties of Aerosols
and Clouds: The software package OPAC, B. Am. Meteorol. Soc., 79, 831–844, 1998.
Holben, B. N., Eck, T. F., Slutsker, I., Tanre, D., Buis, J. P., Set-zer, A., Vermote, E., Reagan, J. A, Kaufman, Y., Nakajima, T., Lavenu, F., Jankowiak, I., and Smirnov, A.: AERONET – A fed-erated instrument network and data archive for aerosol character-ization, Rem. Sens. Environ., 66, 1–16, 1998.
Holben, B. N., Tanre, D., Smirnov, A., Eck, T. F., Slutsker, I., Abuhassan, N., Newcomb, W. W., Schafer, J., Chatenet, B., Lav-enue, F., Kaufman, Y. J., Vande Castle, J., Setzer, A., Markham, B., Clark, D., Frouin, R., Halthore, R., Karnieli, A., O’Neill, N.T., Pietras, C., Pinker, R.T., Voss, K. and Zibordi, G.: An emerging ground-based aerosol climatology: Aerosol Optical Depth from AERONET, J. Geophys. Res., 106, 12 067–12 097, 2001.
Horvath, H., Alados Arboledas, L., Olmo F. J., et al.: Optical char-acteristics of the aerosol in Spain and Austria and its effect on radiative forcing, J. Geophys. Res., 107(D19), 4386, 2002. Kalkstein, L. S., Tan, G., and Skindlov, J. A.: An evaluation of three
clustering procedures for use in synoptic climatological classifi-cation, J. Climate Appl. Meteor., 26, 717–730, 1987.
Kaufman, Y. J., Smirnov, A., Holben, B. N., and Dubovik, O.: Baseline maritime aerosol: methodology to derive the optical thickness and scattering properties, J. Geophys. res. Lett., 28, 17, 3251–3254, 2001.
Kazadzis, S., Bais, A., Amidiris, V., Balis, D., Meleti, C., Kouremeti, N., Zerefos, C. S., Rapsomanikis, S., Petrakakis, M., Kelesis, A., Tzoumaka, P., and Kelektsoglou, K.: Nine years of UV aerosol optical depth measurements at Thessaloniki, Greece, Atmos. Chem. Phys., 7, 2091–2101, 2007,
http://www.atmos-chem-phys.net/7/2091/2007/.
Lelieveld, J., Berresheim, H., Borrmann, S., et al.: Global air pollu-tion crossroads over the Mediterranean, Science, 298, 794–799, 2002.
Lyamani, H., Olmo, F. J., and Alados-Arboledas, L.: Long-term change in aerosol radiative properties at Armilla, Atmospheric Environment, 38, 5935–5943, 2004.
Meloni, D., Di Sarra, A., Di Iorio T., and Fiocco, G.: Influence of the vertical profile of Saharan dust on the visible direct radia-tive forcing, J. Quant. Spectrosc. Radiat. Transfer, 93, 347–413, 2005.
Mihalopoulos, N., Stephanou E., Kanakidou, M., Pilitsidis, S., and Bousquet, P.: Tropospheric aerosol ionic composition in the east-ern Mediterranean region, Tellus B, 49, 314–326, 1997. Mishchenko, M. I., Geogdzhayev, I. V., Liu, L., Ogren, J. A.,