HAL Id: hal-00412175
https://hal.archives-ouvertes.fr/hal-00412175
Submitted on 26 Oct 2016
HAL is a multi-disciplinary open access
archive for the deposit and dissemination of
sci-entific research documents, whether they are
pub-lished or not. The documents may come from
teaching and research institutions in France or
abroad, or from public or private research centers.
L’archive ouverte pluridisciplinaire HAL, est
destinée au dépôt et à la diffusion de documents
scientifiques de niveau recherche, publiés ou non,
émanant des établissements d’enseignement et de
recherche français ou étrangers, des laboratoires
publics ou privés.
Seismic anisotropy beneath southern Iberia from SKS
splitting
L. Buontempo, Goetz Bokelmann, Guilhem Barruol, J. Morales
To cite this version:
L. Buontempo, Goetz Bokelmann, Guilhem Barruol, J. Morales. Seismic anisotropy beneath southern
Iberia from SKS splitting. Earth and Planetary Science Letters, Elsevier, 2008, 273 (3-4), pp.237-250.
�10.1016/j.epsl.2008.06.024�. �hal-00412175�
Seismic anisotropy beneath southern Iberia from SKS splitting
L. Buontempo
a,⁎
, G.H.R. Bokelmann
b, G. Barruol
b, J. Morales
aa
Instituto Andaluz de Geofísica, Universidad de Granada, Campus Cartuja, Spain b
Université Montpellier II, CNRS, Géosciences Montpellier, CC060, F-34095 Montpellier cedex 5, France
A B S T R A C T
Seismic anisotropy of the south Iberian upper mantle is investigated using shear-wave splitting of SKS phases. We analyzed teleseismic events recorded by sixteen permanent broadband stations installed on the southern Iberian Peninsula and in northern Africa, and we determined fast polarization directionsϕ, and delay timesδt between fast and slow components. The area of investigation extends across two important geological structures in the Variscan Iberian Peninsula: the Variscan Iberian Massif in its center, and the Gibraltar arc in the Southeast, that represents the most westerly Alpine belt in the western Mediterranean. Shear-wave splitting measurements from stations in the Betic domain show homogeneous ENE–WSW fast directions nearly parallel to the trend of the mountain belt, and smooth spatial variations. Stations in the North, toward the southern part of the Variscan Iberian Massif show homogeneous fast directions however trending NS to NE–SW, different from those recorded in the Betic. These observations may reflect a post-Hercynian (Variscan) deformation of the Ossa-Morena zone, related to the main stages in the tectonic evolution of this part, namely transpressional stage, transtensional stage and shortening episode, or a deformation related to the posterior Alpine orogeny. Along the Gibraltar arc, we observe a smoothly varying ϕ trend changing from ENE–WSW in the Eastern Betics to NS in the area of Gibraltar and Ceuta, following more or less the general trend of the mountain belt around the Alboran Sea, and the coastline. Since a similar rotation is also visible in results from Pn anisotropy, this suggests that the anisotropy is vertically coherent starting from just below the Moho. Comparing the anisotropy pattern expected from various geodynamic models with the observed SKS splitting suggests that the anisotropy is best explained by a model of slab rollback, rather than by delamination models.
1. Introduction
During the last decades, seismological techniques have been developed to analyze the deep deformation of the Earth, and particularly the relation between plate tectonics and mantleflow as well as the internal deformation of the plate (e.g.,Silver and Chan, 1988). The most popular technique uses the birefringence in anisotropic media that induces the splitting of shear waves and allows one to obtain quantitative information about seismic aniso-tropy in the upper mantle below a seismic station. Seismic anisoaniso-tropy in the upper mantle is dominated by elastic anisotropy of rock-forming minerals which develop lattice-preferred orientations (LPO) or fabrics in response to strain (e.g.Nicolas and Christensen, 1987; Mainprice et al., 2000). The primary constituent of the upper mantle is olivine which is more anisotropic than most other minerals. Olivine deforms by dislocation-creep at upper mantle conditions (Nicolas and Christensen, 1987), and it generally aligns the main crystallographic
axes with respect to the structural directions (lineation, pole of the foliation), therefore producing a large-scale anisotropy that is detectable by seismic waves. The anisotropy is thus correlated with the strain in the upper mantle, and it therefore allows constraining deformation at that depth within the Earth remotely from the surface. The most useful seismological phase for studying shear-wave splitting is the SKS phase. It travels through the mantle as an S wave, through the liquid outer core as a P wave after a S to P conversion at the core–mantle boundary, and is converted back into a radially polarized S wave when passing back in the mantle. On its way to the Earth's surface, this SKS phase is split into two mutually orthogonally polarized shear waves as it propagates through an anisotropic medium. From three-component seismic records, two parameters can be measured to quantify the anisotropy: 1) the difference in arrival time (δt) between the two split waves that depends on thickness and the intrinsic anisotropy of the medium, and 2) the polarization plane azimuth ϕ of the faster split shear wave that is related to the orientation of the anisotropic structure. Shear-wave splitting measure-ments can therefore characterize the orientation and to a lesser degree the depth extent of the mantle strainfield (see review bySavage, 1999). Determining the vertical location of the anisotropic layer(s) is always challenging since the splitting of SKS phases may occur somewhere between the core–mantle boundary and the station.
⁎ Corresponding author. Tel.: +34 958 249554; fax: +34 958160907.
E-mail addresses:[email protected](L. Buontempo),[email protected] (G.H.R. Bokelmann),[email protected](G. Barruol),[email protected] (J. Morales).
Other phases such as local S (e.g.Bowman and Ando, 1987), may help to constrain the anisotropy distribution beneath a station, but they require the presence of nearby seismogenic zones. Petrophysical analyses of mantle minerals and rocks (Mainprice et al., 2000; Mainprice et al., 2005) suggest that anisotropy lies in the uppermost 400 km of the Earth. Recent theoretical studies usingfinite-frequency sensitivity kernels provide similar conclusions since SKS splitting are shown to be more sensitive to the upper mantle above the transition zone than to the lower mantle (Sieminski et al., 2007). If one assumes that the crust may contribute only a few tenths of a second to the total SKS splitting (Barruol and Mainprice, 1993; Godfrey et al., 2000), these arguments suggest that the anisotropy lies primarily in the subcrustal upper mantle. It is however not clear whether the anisotropy lies within the lithosphere and is related to a‘frozen’ deformation (Silver and Chan, 1988), or within the asthenosphere and is thus related to present-day plate motion (Vinnik et al., 1992). This question can be addressed by SKS splitting only indirectly since these observations constrain only weakly the depth of anisotropy within the upper
mantle. On the other hand, this question can in principle be resolved combining SKS observations with surface wave anisotropy and Pn observations. We will in fact use Pn in this study to compare with SKS splitting results.
The area of interest of this paper, in southern Iberia and around the Gibraltar arc, represents a key area of geodynamic interest for the Africa–Eurasia collision and for the various stages of opening and closure of the Mediterranean basins. Various geodynamic models and mechanisms have been proposed to explain the large-scale structures and timing constraints, based on regional-scale recycling of litho-sphere into the mantle, such as active continental subduction (Morales et al., 1999), delamination (Seber et al., 1996a) or active oceanic subduction (Lonergan and White, 1997; Gutscher et al., 2002). In this study, we present new shear-wave splitting measurements obtained at permanent stations located in the Betic and Rif Cordillera and in the southern part of the Variscan Iberian Massif. We compare these new results with previous ones from Iberia (Diaz et al., 1998; Schmid et al., 2004), as well as from Pn phase anisotropy (Calvert et al.,
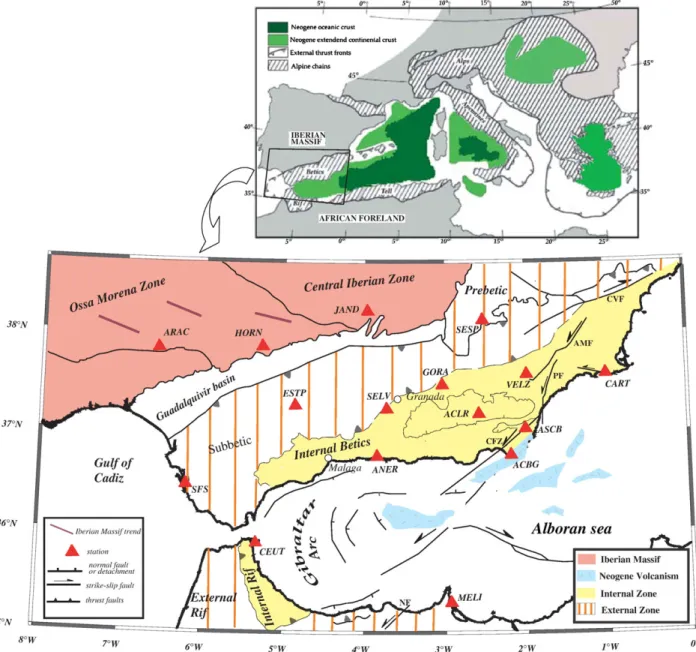
Fig. 1. Tectonic sketch of the Mediterranean area showing the Neogene basins and Alpine chains (top, redrawn fromComas et al., 1999) and geological setting of South of Iberia and North of Africa (bottom, redrawn fromLonergan and White, 1997; Platt el al., 2003). Main faults are shown in the External and Internal Zones and in the Alboran Domain (CVF: Crevillente fault, AMF: Alhama de Murcia fault, PF: Palomares fault, CFZ: Carboneras fault, NF: Nekor fault). Locations of seismological stations used in this study are also shown by triangles.
2000b). In the light of tomographic models for this region we propose that all these anisotropy observations may help to constrain and to better understand the geodynamic setting of this complex area. 2. Geodynamic setting
The Betic and Rif belts, connected through the Gibraltar arc, represent the most westerly Alpine range in southern Europe (Fig. 1). Together with the Alboran basin, these belts constitute one of the most complex and most debated geological regions in the western Medi-terranean. A major characteristic of the Alboran basin is that it is an extensional regime (Comas et al.,1999) within a general collision regime, induced by the convergence of Africa and Eurasia from the Cretaceous to Paleogene (Dewey et al., 1989). The geological records and geophysical observations shed some light on the evolution of the region. Formally, the Gibraltar arc is divided into three pre-Neogene crustal domains: the first consists of Mesozoic and Tertiary sedimentary rocks deformed during the Neogene as a thrust-and-fold belt mainly directed to the NW and WNW (e.g.,Garcia-Dueñas, 1969; Garcia-Hernandez et al., 1980), which covered the South-Iberian and Maghrebian continental paleo-margins and constitute the External Zones of the Betics and Rif. The second corresponds to the sediments deposited on oceanic troughs or thin continental crust (Luján et al., 2006) and belongs to the so-called Flysch Trough that is well-represented in the Rif and Tell regions. The last one, the Alboran crustal domain, represents the internal zones of the orogen, composed mainly of Paleozoic to Mesozoic rocks affected by low to very high-grade metamorphism that were deformed mainly during the late Cretaceous to Paleogene and thrust onto the south Iberian and north African margins during the Early Miocene (Balanyá and García-Dueñas, 1988). Three tectono-metamorphic complexes are recognized in this zone, the Nevado-Filabride, the Alpujarride and the Malaguide in the Betics. The Alboran domain shows N–S continuity below the sea and constitutes the metamorphic basement of the Alboran basin (Platt et al., 1996). That basin represents a post-orogenic back arc basin (Lonergan and White, 1997), similar to the Calabrian arc (Faccenna et al., 2004; Rosenbaum and Lister, 2004), formed during the westward migration of the orogenic wedge. The main extension occurred during the Early Miocene (Comas et al., 1999), coeval with shortening in the orogen. The extension was associated with subsidence during the Miocene and accompanied by tholeitic and calcoalkaline magmatism (Turner et al., 1999; Duggen et al., 2005). Since the Upper Miocene–Pliocene until present, a contractive episode with a roughly NW–SE direction, although varying from the Upper Miocene to the Pliocene (Ott D'Estevou and Montenat, 1985; De Larouzière et al., 1988; Galindo-Zaldívar et al., 1997) manifests itself by strike–slip tectonics, mainly in the eastern Betics and
Alboran basin. This contractive episode was accompanied by magma-tism of mainly shoshonitic, lamproitic and alkaline basalts (Lonergan and White, 1997; Zeck et al., 1998; Duggen et al., 2005).
At present, the kinematics of the Gibraltar arc as defined by GPS and seismic moment tensor observations shows different deformation styles that are characterized by NNW-directed thrust faulting near the Algerian coast and the SW of Iberia and an E–W extensional regime in the Alboran Sea (Stich et al., 2003, 2006). A crucial role is played by the so-called Trans-Alboran shear zone, a major structure formed by NE–SW sinistral strike–slip faults, and NW–SE conjugates in the partitioning of the strain in the region (Fernández-Ibáñez et al., 2007) that allow coeval shortening and extensional structures in a oblique convergent plate margin between Africa and Europe.
Several models have been proposed to explain the formation of the Gibraltar arc. These models may be compared by considering the style of recycling of lithospheric material back into the mantle that may occur in the form of lithospheric delamination (e.g.Seber et al., 1996a; Platt et al., 1998; Calvert et al., 2000b), convective removal (Platt and Vissers, 1989), or subduction (Lonergan and White, 1997; Gutscher et al., 2002).
Platt and Vissers (1989)proposed that a lithospheric thickening as a result of convergence created a collisional ridge of thick crust underlain by a thick root of cold lithospheric mantle, during late Eocene to Oligocene time. Such a gravitationally unstable root could have been removed by convection and replaced by an asthenospheric mantle during the late Oligocene, resulting in the uplift and extension of the region and in the exhumation of metamorphic rocks and high-temperature peridotites from the base of the crust. The continuous convergence between Africa and Eurasia is then proposed to be accommodated by shortening in the external zones of the belts (Subbetic and External Rif).
The model proposed by Seber et al. (1996a) is also based on delamination, and is somewhat similar to the model of Platt and Vissers (1989). The difference is the style of removal of the thickened lithosphere. Seber et al. (1996a) proposed indeed that, as a consequence of compression, a thickened lithosphere was underlying the (thickened) crust, and that gravitationally unstable lithospheric root was progressively replaced by hot asthenosphere by convective removal from the crust toward W and NW. A consequence of the resulting asthenospheric inflow is the heating of the crust inducing an uplift and the extension in the Alboran area.
The slab rollback model ofRoyden (1993)andLonergan and White (1997) is very different from the above models, since it focuses primarily on subduction of oceanic lithosphere under the Alboran Sea. As the rate of subduction exceeds the rate of convergence, the subduction zone began migrating to the west while the crust of the
Table 1
Station locations and mean splitting parameters, given as mean values (m), median values (md) and weighted-mean values (w) with 2σ errors Station name Latitude
(°) Longitude (°) ϕm (°) σϕm (°) δtm σδtm ϕmd (°) δtmd ϕw σϕw δtw σδtw Number of observations ACBG 36.7686 −2.1939 59.42 7.94 1.70 0.64 59.59 1.88 67.09 1.59 1.86 0.08 5 ACLR 37.1897 −2.5822 77.16 8.49 1.74 0.69 77.20 2.00 82.60 4.26 1.72 0.18 6 ANER 36.7623 −3.8453 31.12 21.11 1.54 0.8 36.82 1.18 35.91 1.29 1.29 0.06 16 ARAC 37.8800 −6.5800 63.65 12.51 0.99 0.35 67.81 1.00 65.00 6.95 0.79 0.12 8 ASCB 37.0394 −2.0056 54.26 14.76 1.46 0.73 63.46 1.52 65.73 2.51 1.62 0.16 6 CART 37.5868 −1.0012 68.86 7.97 1.56 0.31 69.74 1.50 72.93 1.27 1.46 0.07 11 CEUT 35.8831 −5.3263 −3.61 22.27 2.06 0.88 −3.61 2.06 −15.01 3.76 1.71 0.44 2 ESTP 37.2713 −4.8662 81.14 13.05 1.56 0.59 83.16 1.34 63.44 3.12 1.45 0.18 9 GORA 37.4805 −3.0398 72.71 6.85 1.30 0.38 74.46 1.12 73.28 5.36 1.18 0.14 5 HORN 37.8200 −5.2800 58.06 21.19 1.07 0.4 57.56 0.94 40.15 2.28 0.92 0.1 14 JAND 38.22 −3.97 6.49 48.64 1.72 0.33 31.52 1.80 1.03 3.75 1.61 0.32 3 MELI 35.2899 −2.9392 66.87 8.24 1.43 0.6 63.11 1.50 67.51 3.27 0.95 0.09 3 SELV 37.2383 −3.7277 59.01 14.65 1.04 0.56 52.48 0.81 48.33 4.56 0.86 0.12 6 SESP 38.1208 −2.5452 66.28 28.69 1.68 0.63 72.26 1.70 47.35 1.38 1.77 0.11 14 SFS 36.4656 −6.2055 −1.27 28.41 1.10 0.99 −1.27 1.10 17.03 7.91 0.87 0.41 2 VELZ 37.5838 −1.9880 69.66 12.87 1.45 0.48 66.45 1.40 64.94 2.64 1.39 0.08 8 For (m) errors give two times the standard deviation of individual values; for (w) they give the error of the weighted mean.
former collision ridge (Internal Zone) was broken up and dispersed, and the crust behind this region was thinned by extension. In the northern and southern portions of the subduction zone, the westward movement slowed down as Iberian and African lithosphere was encountered and the emplacement of the Internal Zone was accommodated by shortening in the continental margins. The central portion of the subducting trench continued its westward migration and the continued subduction-zone rollback induced extension beneath the Alboran Sea. On the other hand, several other models consider different geometries and dip direction for the subducting slab: the above models invoke eastward subduction of oceanic lithosphere rolling back to the west (Lonergan and White, 1997; Gutscher et al., 2002); others consider an extinct subduction oriented northwards (e.g.,Zeck, 1996). Recent analyses of body-wave disper-sion at Ceuta (Bokelmann and Maufroy, 2007) indicate very different dispersion characteristics of events arriving from the West from those arriving from the East, which suggests the presence of an oceanic slab beneath the Alboran Sea.
3. Data and method
In this study, we used seismic data recorded by 13 permanent broadband stations of the Instituto Andaluz de Geofisica (IAG), and by 3 broadband seismic stations of the ROA-UCM-GEOFON (Real Observa-torio de la Armada in San Fernando—Universidad Computence Madrid-Geofon). The station locations are reported inFig. 1andTable 1.
Locations and centroid times of teleseismic events used to extract the data from the continuous record were taken from the Harvard
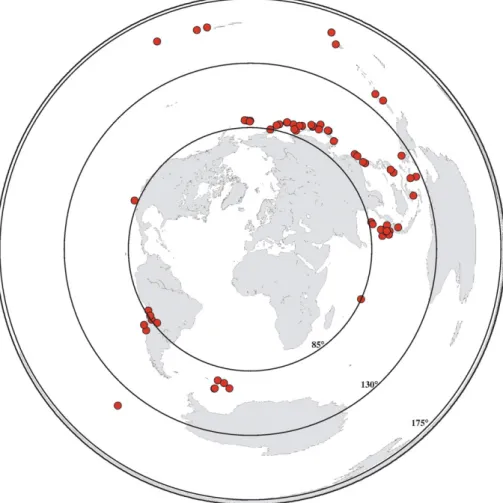
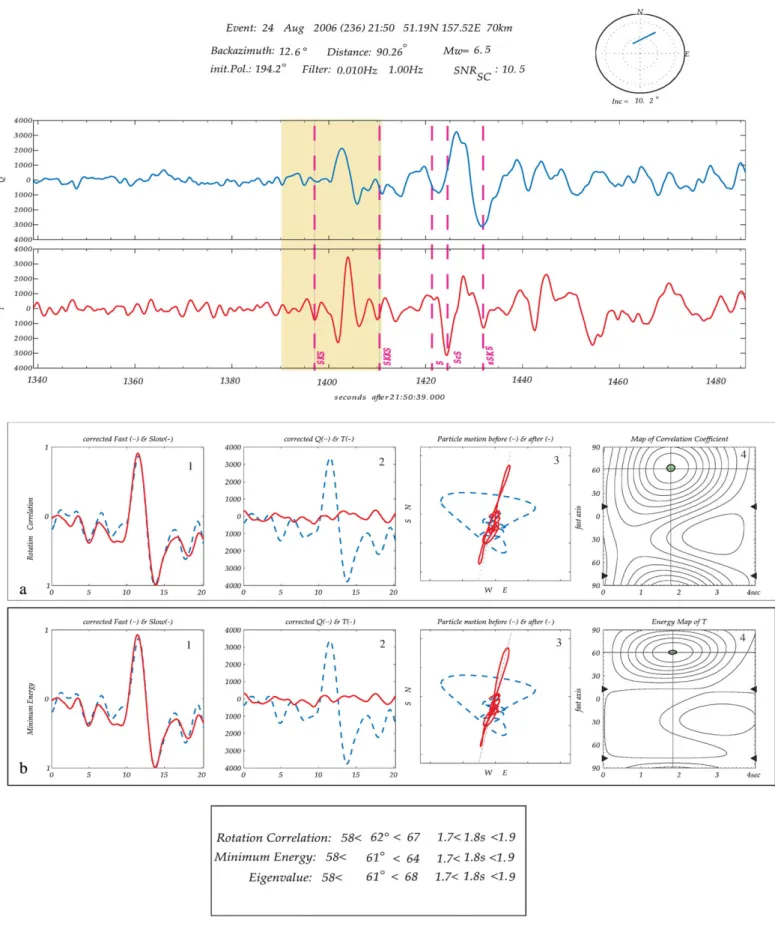
catalogue, http://www.seismologyharvard.edu/CMTsearch.html and arrival times of theoretical SKS phases at the stations were calculated using the theoretical Earth model IASP91 (Kennett, 1995) with the IASP91TTIM software (Buland and Chapman, 1983; Kennett and Engdahl, 1991). From the teleseismic events covering the period 2001–2006, we selected events occurring at distances larger than 85° and of magnitude (Mw) larger than 5.7. The selected events are shown inFig. 2, with a global projection centered on southern Spain and preserving the azimuths. For the distance range between 130 and 165° we also selected SKKS phases. A careful visual inspection of the data allowed us to keep about 207 seismograms from 67 teleseismic events. For each selected event, we calculated the two splitting parameters, that is, the azimuth of the fast axisϕ and the delay time δt between the fast and slow component of the shear waves. We performed these measurements using SplitLab (Wüstefeld and Bokelmann, 2007; Wüstefeld et al., 2008), which utilizes three different techniques simultaneously: the rotation-correlation method (e.g.Bowman and Ando, 1987), that is maximizing the cross-correlation between the radial and transverse component of the SKS phase, the minimum energy method (Silver and Chan, 1991), that is minimizing the energy on the transverse component, and the minimum eigenvalue method (Silver and Chan, 1991).Fig. 3shows an example of the application of these techniques for an event that arrives from the North at station ACBG. Under good measurement conditions, i.e. good signal-to-noise ratio and a favorable backazimuth, these methodologies give similar splitting parameters. The comparison between the different methods is helpful for characterizing cases of smallδt where seismograms do not show clear SKS splitting, the so-called Null measurements, and for
Fig. 2. Spatial distribution of earthquakes used in this study in a projection that preserves backazimuths, centered on the Alboran. The 85° (minimum distance for SKS splitting measurement) and 130° of epicentral distance are also shown.
Fig. 3. Example of data processing using SplitLab software (Wüstefeld et al., 2008) at ACBG station. (top) The upper panel shows the event information and the initial radial and transverse components. Dashed lines are the predicted phase arrival times from IASP91; the shaded area is the selected window for the shear-wave splitting processing. (middle) Figures for inspecting the performance are shown with four plots for the rotation-correlation method in panel a) and four plots for the minimum energy method in panel b). From left to right: 1) fast and slow components (dashed and continuous lines, respectively), corrected for the calculated splitting delay time; 2) corrected radial and transverse components (dashed and continuous lines, respectively), note that the energy on the transverse component is well removed after anisotropy correction; 3) the particle motion in the horizontal plane (dashed) becomes linear after the correction for anisotropy (solid); 4) contour plot for the maximum value of correlation coefficient and for the energy on transverse component as function of delay time and fast polarization angle. The shaded area marks the 95% confidence interval. (bottom) Numerical values that summarize the results for the three methodologies are given at the bottom, with their respective error ranges.
Fig. 4. Splitting results shown at the seismic stations used in the present study. Each measurement is characterized by a fast azimuthϕ, and the length of the segment is proportional to the delay timeδt. Good (thick dark lines) and fair (thin lines) are represented.
Fig. 5. Individual splitting measurements projected at 150 km depth along the ray paths. Good measurements are shown by thick lines, fair measurements by thin lines. Null measurements (events with no apparent splitting) are shown by circles. White arrows are average stress extension directions calculated byStich et al. (2006), the dark arrow shows absolute plate motion direction for the model HS3-Nuvel-lA (Gripp and Gordon, 2002).
discriminating them from cases of existent but weak splitting. Null measurements occur when the SKS phase is not split. This may happen when the medium is isotropic or when the backazimuth of the incoming SKS wave is parallel to either the slow or the fast directions in the anisotropic layer. In the case of a simple anisotropic medium, Null and non-Null measurements have to be consistent with each other. For simplicity in the discussion and pictures we present only measure-ments obtained with the minimum energy method. Table 1 gives resulting splitting parameters (ϕ and δt) for each seismogram.
We qualified the splitting results as “good”, “fair”, and “poor” as proposed byBarruol et al. (1997), i.e., depending on the quality of the seismograms, on the signal-to-noise ratio of the initial phase, on the
amount of energy on the transverse component, on the correlation of the two split waveforms, and on the elliptical particle motion before anisotropy correction and its linearization after correction. Waveforms with good or fair quality generally provide similar results with and withoutfiltering, indicating that results do not overly depend on the filter parameters. We generally choose to not filter the data unless required to remove high frequencies and/or long-period noise.
We will initially assume that the anisotropy is characterized by layer (s) with horizontal symmetry axes. Dipping axes of symmetry (or some orthorhombic symmetry systems) can cause systematic variations of splitting parameters as functions of backazimuth. However the small number of observations at each station precludes testing such cases.
Fig. 6. Backazimuthal distribution of SKS splitting for stations SESP, JAND, HORN, ARAC, and ANER that are not easily explained by a single anisotropic layer. The panels for ANER also show the prediction for the best-fitting two-layer model. See text for explanation.
4. Results of SKS splitting
The individual splitting measurements (see Table 2, given in the Electronic supplement) are plotted inFig. 4at the various stations to evaluate the coherence of the results. Lines show the fast anisotropy directionsϕ, obtained from the minimum energy method, and their lengths are proportional to the splitting delay timeδt. “Good” data are shown by thick dark lines, and“fair” data by thin lines; “poor” data are not plotted. Most stations in the Eastern Betics, CART, VELZ, ACBG, GORA, ACLR and ASCB show a homogeneous ϕ trending roughly N70°E and high delay times of around 1.5 s. Given the weak spreading of fast direction measurementsϕ at stations in that region, and the spatial coherence, the splitting observed at those stations is likely originating within a single anisotropic layer that is well-constrained by a suitable number of measurements. We record a similar trend for the station MELI in Northern Africa, where the fast direction is N68°E with a delay time of roughly 0.95 s. Interestingly,ϕ is nearly North– South at stations SFS and CEUT, i.e., parallel to the trend of the Gibraltar arc. At each of these two stations unfortunately, measure-ment conditions were relatively difficult, and there are only two measurements available at CEUT from 3 yr of data analyzed, (N12°E, δt=1.44 s and N19°W δt=2.68 s), and two non-Null measurements at SFS (N19°E,δt=1.80 s and N21°W δt=0.4 s).
Diaz et al. (1998)used data from temporary stations and found a fast direction oriented N80˚E at a station in the southern part of the Variscan Iberian Massif. In the Betics, they observed a NNE–SSW trend in the eastern part that changes to E–W in the central part, near Granada, and again NNE–SSW near the coast of Malaga interpreted in terms of their particular lithospheric geodynamic settings.Schmid et al. (2004)studied the station CART, in the eastern part of Betic, and MELI in the north of Africa,finding fast directions in the Betic trend, oriented N70°E and N56°E respectively.
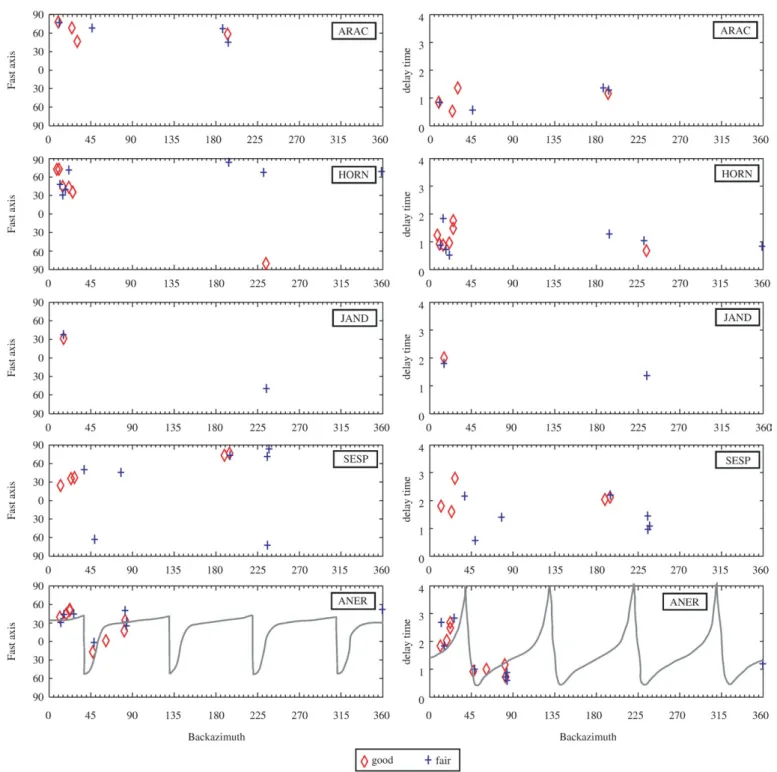
At a number of stations, there is a clear backazimuthal dependence of the splitting parameters, like at stations ARAC, HORN, JAND, SESP, and ANER. Such a backazimuthal dependence of splitting parameters may be explained either by invoking vertical variation of anisotropy, e.g. by the presence of two (or more) anisotropic layers, or by lateral variations of anisotropy. First, we address the case of lateral heterogeneity. In order to better visualize the lateral sampling of the anisotropy measurements and the regional-scale stability of the anisotropy parameters beneath the stations, we choose to project the individual splitting measurements of good and fair quality along their incoming rays to a depth of 150 km (Fig. 5). Although the splitting of the SKS waves is not well-located vertically, this representation is helpful since it plots the splitting parameters closer to the location where they were acquired. The measurements with well-constrained anisotropy (“good”) are presented as thick dark lines while measurements of lower quality (“fair”) are shown by thin lines. In addition,Fig. 5presents the Null measurements by open circles. In the eastern and internal Betics, thisfigure clearly indicates smooth spatial variation of the anisotropic structures beneath most stations (with the exception of ANER, see discussion below). Such a pattern was less clear inFig. 4. It suggests that the variation is not caused by noise in the observations. It is apparently due to real anisotropic variations at depth. This suggests that the upper mantle beneath the Internal Betics is dominated by a single anisotropic layer, with smoothly varying fast directions. Station ESTP located in the Subbetic domain shows a homogeneous distribution of the fast directions that led us to conclude that this part is characterized by a single layer. We will address the nature of this anisotropy and its smooth spatial variation in detail below.
The splitting parameters observed at stations ARAC, HORN and JAND near the transition to the Variscan Iberian Massif, SESP in the Prebetic units, and ANER in the Internal Betics, are not fully explained by lateral variation of splitting. These 5 stations are characterized by an apparent backazimuthal variation of the splitting parameters as shown inFig. 4. The projection at depth of the individual splitting
measurements (Fig. 5) suggests strong lateral variations at small scale-length. Such a rapid variation is not easily explained by lateral variation since the Fresnel zone of SKS phases in the upper mantle that quantifies the width of the zone over which the SKS ‘average’ the structure, is 100 to 200 km wide for SKS waves with 10 s period. For these 5 stations, we show the detailed ϕ and δt backazimuthal variation inFig. 6. A single anisotropic layer would produce a constant fast directionϕ, independent of backazimuth, as well as a constant splitting delayδt. With the possible exception of station ARAC, such a simple single layer does not explain the observations at these stations. However, the stations are characterized by varying amounts of data, partly due to the different running periods of the stations. Data at station JAND were available only from July 2006 and therefore provide only few SKS measurements. Nevertheless, the station exhibits a general NE trend except for the event on day 237 (year 2006, see Table 2 Electronic supplement) with backazimuth of 234° that shows a differentϕ. The small number of data cannot constrain the results for that station. For ANER, there is a nearly North–South trend for such events that arrive from ENE, but data with NNE backazimuth show NE–SW fast directions. The stations HORN, SESP and ARAC exhibit a good number of data which will allow the discussion of a possible two-layer case that we will present below.
5. Discussion
A striking feature in the anisotropy pattern observed in this study is that the Eastern Betics seems to be well-described by a single and rather homogeneous anisotropic layer, whereas a more complex anisotropic model likely involving lateral and vertical variations of anisotropy seems to be present in the upper mantle beneath stations in the North, and perhaps the West and the South. The Eastern Betics show indeed a smooth lateral variation of anisotropy, whereas stations in the Western and Southern part of this region indicate much stronger lateral variations in the splitting parameters. There are also strong lateral variations associated with the transition from the Betic to Variscan Iberia, in addition to two-layer anisotropy as we will show below, as is required at some of the stations at least.
5.1. Eastern Betics
Fast directions are oriented ENE–WSW in the Eastern Betics, and there is a smooth spatial variation clearly visible inFig. 5that is more or less parallel to the mountain belt. The anisotropy in that region is easily explained by a single anisotropic layer. The average splitting delay time in that region is about 1.5 s, which is consistent with a layer that is 150 km thick assuming the typically used value of 4% anisotropy in the upper mantle (Mainprice and Silver, 1993; Mainprice et al., 2000). Tomographic models for the region, (e.g.Blanco and Spakman, 1993), show a pronounced low-velocity anomaly in the upper mantle under the Betics between 30 and 100 km depth that is also apparent and even more pronounced in the Pn tomographic model ofCalvert et al. (2000a). This area is also the locus of a pronounced high attenuation anomaly of Sn waves (Calvert et al., 2000b). This may suggest that continental mantle material under the Betics has been replaced by asthenospheric material. Geochemical studies favor such a hypothesis by suggesting an edge delamination that could have occurred under the Betics (Duggen et al., 2005). If the lithosphere has indeed been removed, this should suggest that the deformation recorded by the seismic anisotropy under the Betics is associated rather with hot and thus relatively low-viscosity material. At larger depths, however, velocities are again relatively high in tomographic models (e.g.,Blanco and Spakman, 1993) down to the transition zone, including the zone of very deep seismicity around 600 km depth (Buforn et al., 1997).
The ENE–WSW fast directions observed in the Eastern Betics are nearly parallel to the absolute plate motion direction, which is 239°
and 2 cm/yr for the motion model Nuvel1A relative to the hotspot reference system HS3 (Gripp and Gordon, 2002). Although the Eurasian plate motion vector is slow and therefore still matter of debate, a simple deformation model related to plate motion of the Iberian/Eurasian plate over the deeper mantle might thus explain the anisotropy. In this context, the gradual rotation of fast direction along the coast might be explained reasonably by invoking a deviation of mantle flow around the Iberian lithosphere, following similar suggestions ofBormann et al. (1996)for central Europe and ofBarruol et al. (1997)andFouch et al. (2000)for North America. This might also explain the minor difference of 10° between the average fast direction in the Eastern Betics and the absolute plate motion direction.
On the other hand, the observed fast directions in the Eastern Betics also show an interesting correlation with crustal features which is not expected in the case of plate motion induced asthenospheric anisotropy. The convergence direction between the African and the Iberian/Eurasian plate is NNW–SSE, and the current style of deforma-tion in the crust is predominately left-lateral strike–slip faults with a NE–SW trend (e.g. Alhama de Murcia, Palomares and Carboneras faults).Vauchez and Nicolas (1991)suggested that in many collisional belts the dominant motion is strike–slip parallel to the main trend of the belt. In this case, both crustal and mantle fabrics may reflect these movements, and the entire lithosphere develops a fabric and becomes anisotropic. They attribute this anisotropy to a dominant mantleflow parallel to the mountain belt during orogeny. Such a structure is well illustrated in the Ronda peridotite massif where pervasive structures and fabric in the lithospheric and asthenospheric mantle are well preserved (Vauchez and Garrido, 2001). The present-day extension direction inferred byStich et al. (2006), using moment tensors of crustal earthquakes, is N240°E, which is indeed parallel to the inferred fast polarization directions. The anisotropy is thus also consistent with a notion of vertically coherent deformation of crust and mantle as initially proposed bySilver and Chan (1988, 1991), except that we are dealing with hot deformed mantle in this region, and thus probably with current deformation, rather than fossil deformation remaining from the creation of continental lithosphere. For the close-by Gulf of Cadiz region,Stich et al. (2005)have shown that the stresses imposed by the Africa–Iberia plate convergence have the same geometry in the crust and the mantle. The convergence thus imposes a similar lateral boundary condition over a considerable depth range. Crust and mantle in the Betics may thus both be constrained to deform in a similar fashion. The observed anisotropy under the Eastern Betics could be thus caused by a combination of this kind of vertically coherent deformation, and absolute-motion-related deformation, both produ-cing a seismic anisotropy such as the observed one. The relative importance of each is not constrained though. Interestingly, a model of slab rollback is also consistent with such coherence between crustal and upper mantle deformation. The retreat to the WSW of the Alboran slab may have induced a large transcurrent deformation in the mantle beneath the eastern Betics but also in its crust.
5.2. Variscan belt
The northernmost stations of our study area are situated on or near the Variscan Iberian Massif. The fast anisotropy directions we observe at these stations are trending more NE–SW than those recorded by stations in the Betics that trend more ENE–WSW. These directions do not appear to correspond to orientations of geological structures in the Variscan basement, since the latter trend more or less NW–SE in the Northwest portion of Iberia and East–West in eastern Spain. While we do not obtain those“Variscan” directions for our northernmost stations that are near the southern end of the Variscan belt, they are in fact observed further North, in the center of Variscan Iberia (Silver and Chan, 1988; Schmid et al., 2004), where they are roughly E–W. Three of our northernmost stations show a wide range of fast orientations (Figs. 5 and 6). Different anisotropy parameters are obtained for
measurements arriving from the North and South. This is not easily explained by lateral heterogeneity, unless all these stations are located above a geological suture zone so that events arriving from the North and the South could experience a different medium. Since these stations are indeed near the Betics deformation front, we wish to further test both hypotheses for the northernmost stations, namely the‘lateral heterogeneity hypothesis’ and the ‘two-layer anisotropy hypothesis’.Fig. 5illustrates the‘lateral variation hypothesis’, where splitting results were projected along the incoming rays to 150 km depth. In this view, fast directions that show up to the North of the stations, within the Iberian Variscan Massif, are generally associated with NE–SW fast direction, while results generally show more East– West trending fast directions, for southern backazimuth i.e., close to the general Betics trend. This is particularly clear at station SESP, and it may indicate that the events arriving from the south are experiencing the same anisotropic structure as the stations located further south in the Internal Betics. This would suggest that SESP may lie close to an important boundary between lithospheric blocks. Among the north-ern stations of our study area, ARAC shows little backazimuthal dependence of the anisotropy parameters: NE–SW fast directions are visible both to the North and to the South of the station.
On the other hand, we may assume a two-layer model for each of these four northern stations, to try to explain the observed variation of the splitting parameters apparent in Fig. 6. Constraining the four parameters of a two-layer model requires a relatively good back-azimuthal coverage (seeWalker et al., 2007), which we do not have. We therefore decided to apply a similar approach asFontaine et al. (2007)for the SKS splitting obtained at oceanic island stations, by considering the area as homogeneous enough to group the individual splitting measurements together into a single“virtual” station. We processed measurements obtained from the four stations together, since they have similar backazimuthal coverages. Different from the other three stations, SESP is located within the Betic Cordillera, in the so-called Pre-Betic. Nevertheless splitting parameters are more like those of the stations at the limit, e.g. HORN, rather than the other station on the Betics.
If there were several anisotropic layers present at depth, mantle deformation would not necessarily mimic crustal deformation. A tectonic decoupling somewhere within the lithosphere might explain why anisotropic directions in the area are different from the trend of the mountain belt. Seismic reflection profiles in the south-western portion of the Iberian Massif show that the Moho is discontinuous (Simancas et al., 2003), particularly under the Ossa-Morena and Central Iberian Massif. In fact, the Moho is probably a decoupling zone between the mantle and the crust in the area.
Following the approach defined bySilver and Savage (1994), we therefore tested two-layer models by varyingϕ and δt in the upper and lower layer by increments of 2° and 0.2 s, respectively, and compared the expected backazimuthal variations with our observa-tions. We use the statistical technique presented inWalker et al. (2005)to judge the significance of the variance reduction over the best-fitting one-layer model. Testing all possible two-layer models (Fig. 7), wefind that the best-fitting models belong to three groups of models, 1) those having NE–SW fast directions in both layers, 2) those having NE–SW for the upper layer and NW–SE for the lower layer, and 3) vice-versa. While the best model formally falls into the second category, we cannot rule out the other two cases, including the one of a shallower layer with NW–SE fast azimuths, that would indeed correspond to the trend of the Variscan basement in its southern portion. This ambiguity is in part due to the backazimuthal distribution of the events being rather limited, but more fundamen-tally since a second layer with exactly perpendicular orientation to the first one only varies the splitting delay but does not produce a backazimuthal variation of fast direction and splitting delay. We note that the splitting delay associated with the lower layer is quite small (0.2 s). While the additional variance reduction (39%) associated with this weak second layer is slightly statistically significant, we choose to
not attribute much significance to this. The backazimuthal variation that is present in the data may likely represent a complexity that is perhaps better characterized by an anisotropy that varies laterally. 5.3. Gibraltar arc: constraints on geodynamic models
Fast directions in Southernmost Spain, close to Gibraltar show rather distinct orientations from those in the Internal or External Betics:ϕ trends more or less North–South at the two stations CEUT and SFS. Station ANER near Malaga provides evidence for higher complexity and perhaps multi-layer anisotropy. We have therefore performed a two-layer modeling as detailed above but consider only the results obtained at this station. The thousand best two-layer models obtained for ANER give a best-fitting model with fast direction ϕ for the upper layer of N28°E and for the lower layer of N68°E (Fig. 8), and splitting delays 1.0 and 0.6 s. This result suggests that this station lies in a region of transition between the eastern Betics whereϕ trend ENE (i.e., close to the ANER lower layerϕ) and the Gibraltar arc where ϕ trend close to NS (i.e., close to the ANER upper layer ϕ). Interestingly, the close NS trend of the upper layer seems also to coincide with the
N–S line of intermediate-depth earthquakes (Morales et al., 1999; Calvert et al., 2000b). Nevertheless, we note that for the fast directions in the two layers, the maxima of the histograms inFig. 8are only 20° apart. Even though the statistical improvement is slightly significant, we defer a deeper discussion of a possible two-layer anisotropy until data from more stations around ANER become available.
We consider both Pn and SKS anisotropy measurements, which provide different and complementary depth sampling (e.g.,Pera et al., 2003). SKS waves travel almost vertically and are not able to localize the precise depth range of the anisotropy, except that a layer of more than 100 km thickness is required to explain the observed splitting delay times (Mainprice and Silver, 1993; Ben Ismaïl and Mainprice, 1998), and that it should be in the upper mantle. On the other hand, Pn travels horizontally just below the Moho, and thus constrains anisotropy at that depth level. Pn models for the area have been produced byCalvert et al. (2000b)and bySerrano et al. (2005)which give rather similar results in the area of interest. In each case, arrival times of regional events have been used to determine isotropic and anisotropic velocity variations. The agreement of anisotropic fast directions from Pn and SKS are in fact remarkable on the Spanish side
Fig. 7. Statistical analysis of two-layer modelling for the joint data set of 4 stations in the north (ARAC + HORN + JAND + SESP): parameters for the 1000 best-fitting models are shown as histograms for a) fast direction in upper layer; b) delay time in the upper layer c) fast direction in the lower layer; d) delay time in the lower layer. The arrows show the optimum values for each model,ϕ=N52°E and ϕ=N136°E for a) and c) respectively, and δt=1.2 s and δt=0.2 s for b) and d) respectively.
of the Alboran arc (Fig. 9). Not only are these fast directions parallel in the eastern Betics, but they seem to rotate together with the large-scale geological structures of the Alboran arc, and parallel with the coast, in a similar fashion for the shallowest and somewhat deeper mantle. The model may perhaps suggest that this parallelism is not present on the African side of the Gibraltar arc where fast Pn trend NS to NNW–SSW and fast split SKS trend NE–SW. The model is less well-constrained in that area, but if the feature is real, this may suggest a complete decoupling between the sub-Moho and the deeper anisotropy. However, the similarity between Pn and SKS fast directions may reflect different tectonic processes at depth, particu-larly in the vicinity of a subduction zone. Indeed, if there is subduction in the area, as has often been argued (e.g.,Gutscher et al., 2002), Pn may be affected by the anisotropy above the slab, whereas SKS might be sensitive to the anisotropy below, above, and possibly within the slab. Fast split directions parallel to the slab is a rather common feature in subduction zones, both above and below the slab. This has been found for instance in New Zealand (Marson-Pidgeon and Savage,
2004) and in Northern Italy (Mele et al., 1998). Trench-parallel fast directions, may be explained either by invoking trench-parallelflow (e.g.,Russo and Silver, 1994), or by invoking a hydrated mantle wedge above the slab (Jung and Karato, 2001). The degree of hydration of the mantle wedge and of magnitude of the applied stress above a subduction zone appears to have a strong influence on the style of seismic anisotropy (e.g.,Jung and Karato, 2001; Kaminski and Ribe 2002): Slab-parallel seismic fast axes from SKS can in principle be explained either by slab-parallelflow in an anhydrous mantle wedge or by slab-normal compression in a hydrous mantle wedge. Such a pattern of anisotropy may show apparently erratic behaviour in some places; this may perhaps help to explain the complexity that wefind at station ANER.
Deep structure and dynamics beneath the Alboran area has been widely debated throughout the last decades and a wide variety of geodynamic models has been proposed for the area. These models can be categorized by the way material is recycled into the mantle. If mantle lithosphere has been removed as has been proposed in the
Fig. 8. Statistical analysis of two-layer modelling for station ANER: parameters for the 1000 best-fitting models are shown as histograms for a) fast direction in upper layer; b) delay time in the upper layer; c) fast direction in the lower layer; d) delay time in the lower layer. The arrows show the optimum values for each model,ϕ=N28°E and ϕ=N68°E for a) and c) respectively, andδt=1.0 s and δt=0.6 s for b) and d) respectively.
convection-removal hypothesis (Platt and Vissers, 1989) and the delamination model (e.g.,Seber et al., 1996a), this would require the removed material to be replaced by asthenospheric material. This replacement would correspond to aflow that is directed radially inwards. An idealized convective-removal model would in fact imply that such aflow would be acting radially inwards from all directions. One should not expect to observe a radialflow from all directions though, since any asymmetry or heterogeneity would easily lead to an asymmetricflow, more like that to be expected in a delamination model. However, a radialflow would necessarily exist somewhere, to replace the material that has been recycled into the mantle. Thisflow would produce anisotropic fast directions that are oriented radially.
Fig. 5 shows however, that the flow is oriented more or less tangentially to the Alboran Sea region. The required radialflow is thus not observed. This suggests that convective-removal and delamination models are unlikely to explain the anisotropy observa-tions. On the other hand, subduction to the Northwest, as proposed by
Zeck (1996), would require a rollback to the South to produce trench-parallelflow. Focal mechanisms of intermediate-depth seismicity are consistent with this, but hypocenters do not show a dip toward the North. In fact, they do not show a clear Benioff zone at all, but a line of seismicity dipping steeply to the South. For that same area, teleseismic and regional tomographic studies indicate a pronounced high-velocity anomaly located beneath the Alboran Sea (e.g.Blanco and Spakman, 1993; Calvert et al., 2000b; Seber et al., 1996a).Calvert et al. (2000b)
produced a tomographic model that showed a robust high-velocity anomaly beneath the west Alboran Sea and west and central Betics between 100 and 150 km. Assuming that these positive velocity anomalies indicate a region of cooler mantle, the most likely interpretation is that it indicates the presence of lithospheric mantle in view of the coherent continuation of the anomaly at depth. The positive anomaly extends from lithospheric depths beneath the Strait of Gibraltar and southern Spain to depths of about 350–400 km
beneath the Alboran Sea, and it is interpreted as a lithospheric body that has descended into the upper mantle. More recently, waveform studies (Bokelmann and Maufroy, 2007) have indicated dispersed body-wave arrivals propagating through the mantle under the Alboran Sea, that favor the presence of a subducted slab under the Alboran Sea, still containing a continuous low-velocity crustal layer.
Wortel and Spakman (2000)also proposed a slab structure isolated in the mantle below the Betic-Alboran region at 200 km depth and that seems to be connected with deep seismicity at depths of about 640 km. Lonergan and White (1997) proposed that there was a subduction zone beneath the Alboran Sea that is now extinct. They suggested that the ancient subducting slab in the Western Mediterra-nean was split into two fragments, the eastern one of which has continued to roll back toward the south-east, generating the Tyrrhenian Sea and forming the present-day Calabrian arc. The other slab fragment rolled back to the west, generating the Alboran Sea and the Betic-Rif orocline. Our SKS splitting observations, together with the previously published Pn results, show a spectacular rotation following the curvature of the roll back and of the mountain chain. If the SKS fast directions are to be explained by a rotation similar to that shown by the Pn observations, this would be explained most easily by a toroidal mantleflow under the subducting lithosphere that shows rollback toward the west. There is an interesting similarity with the Calabrian arc in Southern Italy, for which shear-wave splitting results have been presented by Civello and Margheriti (2004) and more recently byBaccheschi et al. (2007). The asthenospheric toroidalflow induced by the Tyrrhenian slab roll back is presently beneath Calabria (Civello and Margheriti, 2004; Baccheschi et al., 2007) but may have left some imprint in the mantle all along its Neogene travel path from southern France (Barruol et al., 2004) to Sicily (Lucente et al., 2006). Seismic anisotropy beneath the Betics is likely related to a similar phenomenon, and thus to the large-scale dynamics of ocean opening in the Southwestern Mediterranean.
6. Conclusions
We have studied upper mantle seismic anisotropy in Southern Spain and around the Gibraltar arc. Our observations suggest a consistent splitting direction parallel to the mountain belt in the Internal Betics, a more northerly direction at stations located further north in the transition with the Variscan Iberia, and a rotation of fast split directions toward NS azimuths around the Gibraltar arc.
The Eastern Betics anisotropy observations are well explained by a single layer of anisotropy with a fast anisotropic direction trending ENE, with smooth and small variations in space. In the transition region between the Variscan and the Betics, the anisotropy shows backazimuthal variations of splitting parameters. Models of two-layer anisotropy and lateral heterogeneous anisotropy have been tested, and a strong lateral change in anisotropy is likely for the transition region toward the Variscan Iberian Massif. Close to Gibraltar, fast directions are oriented close to N–S at CEUT and SFS and this suggests a gradual rotation around the arc. Combining Pn and SKS anisotropy, geological features and tomographic images allow us to discuss the various families of geodynamic models. Our SKS measurements are difficult to reconcile with geodynamic models based on delamination or convective removal. The observa-tions instead favor models of subduction and rollback of the western Mediterranean slab.
Acknowledgements
We warmly thank Andreas Wüstefeld for his useful help in the use of SplitLab software, and Alain Vauchez, Daniel Stich, Carlos Garrido and Francisco Vidal for fruitful discussions. We also thank Martha Savage and an anonymous reviewer for their comments and corrections. SplitLab is available at http://www.gm.univ-montp2.fr/ splitting/together with its user guide, the related publications and the SKS World splitting database. Figures are created using the GMT software ofWessel and Smith (1995). This study was possible thanks to the effort of collecting high-quality broadband seismic data of the IAG-UGR and ROA-UCM-Geofon networks. We received support through Spanish project CGL2005-04541-C03-01-BTE, European Commission project NEAREST (GoCE-037110) and Junta de Andalucia RNM104 and through the project Topo-Iberia CSD2006.
Appendix A. Supplementary data
Supplementary data associated with this article can be found, in the online version, atdoi:10.1016/j.epsl.2008.06.024.
References
Baccheschi, P., Margheriti, L., Steckler, M.S., 2007. Seismic anisotropy reveals focused mantleflow around the Calabrian slab (Southern Italy). Geophys. Res. Lett. 34, L05302.doi:10.1029/2006GL028899.
Balanyá, J.C., García-Dueñas, V., 1988. El Cabalgamiento cortical de Gibraltar y la tectónica de Béticas y Rif, presentado en II Congreso Geológico de España. Simposium sobre Cinturones Orogénicos.
Barruol, G., Mainprice, D., 1993. A quantitative evaluation of the contribution of crustal rocks to the shear wave splitting of teleseismic SKS waves. Phys. Earth Planet. Inter. 78 (3–4), 281–300.doi:10.1016/0031-9201(93)90161-2.
Barruol, G., Silver, P.G., Vauchez, A., 1997. Seismic anisotropy in the eastern US: deep structure of a complex continental plate. J. Geophys. Res. 102 (B4), 8329–8348. Barruol, G., Deschamps, A., Coutant, O., 2004. Mapping Upper mantle anisotropy
beneath SE France by SKS splitting indicates a Neogene asthenosphericflow induced by the Apenninic slab rollback and deflected by the deep Alpine roots. Tectonophysics 394, 125–138.doi:10.1016/j.tecto.2004.08.002.
Ben Ismaïl, W., Mainprice, D., 1998. An olivine fabric database: an overview of upper mantle fabrics and seismic anisotropy. Tectonophysics 296 (1–2), 145–157. Blanco, M.J., Spakman, W., 1993. The P-wave velocity structure of the mantle below the
Iberian Peninsula: evidence for subducted lithosphere below southern Spain. Tectonophysics 221, 13–34.
Bokelmann, G.H.R., Maufroy, E., 2007. Mantle structure under Gibraltar constrained by dispersion of body waves. Geophys. Res. Lett. 34, L22305.doi:10.1029/2007GL030964.
Bormann, P., Grünthal, G., Kind, R., Montag, H., 1996. Upper mantle anisotropy beneath Central Europe from SKS wave splitting: effects of absolute plate motion and lithosphere asthenosphere boundary topography? J. Geodynamics 22 (1–2), 11–32. Bowman, J.R., Ando, M., 1987. Shear-wave splitting in the upper-mantle wedge above
the Tonga subduction zone. Geophys. J. R. Astron. Soc. 88, 25–41.
Buforn, E., Coca, P., Udías, A., Lasa, C., 1997. Source mechanism of intermediate and deep earthquakes in southern Spain. J. Seismol. 1, 113–130.
Buland, R., Chapman, C.H., 1983. The computation of seismic travel times. Bull. Seismol. Soc. Am. 73, 1,271–1,302.
Calvert, A., Sandvol, E., Seber, D., Barazangi, M., Roecker, S., Mourabit, T., Vidal, F., Alguacil, G., Jabour, N., 2000a. Geodynamic evolution of the lithosphere and upper-mantle beneath the Alboran Region of the western Mediterranean—constraints from travel-time tomography. J. Geophys. Res. 105, 10871–10898.
Calvert, A., Sandvol, E., Seber, D., Barazangi, M., Vidal, F., Alguacil, G., Jabour, N., 2000b. Propagation of regional seismic phases (Lg and Sn) and Pn velocity structure along the Africa–Iberia plate boundary zone: tectonic implications. Geophys. J. Int.142, 384–408. Civello, S., Margheriti, L., 2004. Toroidal mantleflow around the Calabrian slab (Italy)
from SKS splitting. Geophys. Res. Lett. 31, L10601.doi:10.1029/2004GL019607. Comas, M.C., Platt, J.P., Soto, J.I., Watts, A.B., 1999. The origin and tectonic history of the
Alborán Basin: insights from Leg 161 results. In: Zahn, R., Comas, M.C., Klaus, A. (Eds.), Proc. ODP, Sci. Results. Ocean Drilling Program, College Station, TX, pp. 555–579. De Larouzière, F.D., Bolze, J., Bordet, P., Hernández, J., Montenat, C., Ott d'Estevou, P.,
1988. The Betic segment of the lithospheric Trans-Alboran shear zone during the Late Miocene. Tectonophysics 152, 41–52.
Dewey, J.F., Helman, M.L., Turco, E., Hutton, D.H.W., Knott, S.D., 1989. Kinematics of the western Mediterranean, in: Conference on Alpine tectonics. In: Coward, M.P., Dietrich, D., Park, R.G. (Eds.), Geological Society of London Special Publications, London, pp. 265–283.
Diaz, J., Gallart, J., Hirn, A., Paulssen, H., 1998. Anisotropy beneath the Iberian Peninsula: the contribution of the ILIHA-NARS broad-band experiment. Pure Appl. Geophys. 151, 395–405.
Duggen, S., Hoernle, K., Van den Bogaard, P., Garbe-Schonberg, D., 2005. Post-collisional transition from subduction- to intraplate-type magmatism in the westernmost Mediterranean: evidence for continental-edge delamination of subcontinental lithosphere. J. Petrol. 46, 1155–1201.
Faccenna, C., Piromallo, C., Crespo-Blanc, A., Jolivet, L., Rossetti, F., 2004. Lateral slab deformation and the origin of the western Mediterranean arcs. Tectonics 23, TC1012.doi:10.1029/2002TC001488.
Fernández-Ibáñez, F., Soto, J.I., Zoback, M.D., Morales, J., 2007. Present-day stressfield in the Gibraltar Arc (western Mediterranean). J. Geophys. Res. 112, B08404. doi:10.1029/2006JB004683.
Fontaine, F.R., Barruol, G., Tommasi, A., Bokelmann, G.H.R., 2007. Upper-mantleflow beneath French Polynesia from shear wave splitting. Geophys. J. Int. 223. doi:10.1111/j.1365-246X.2007.03475.x.
Fouch, M.J., Fischer, K.M., Parmentier, E.M., Wysession, M.E., Clarke, T.J., 2000. Shear wave splitting, continental keels, and patterns of mantleflow. J. Geophys. Res. 105 (B3), 6255–6275.
Galindo-Zaldívar, J., Jabaloy, A., González-Lodeiro, F., Aldaya, F., 1997. Crustal structure of the central sector of the Betic Cordillera (SE Spain). Tectonics 16, 18–37. Garcia-Dueñas, V., 1969. Les unités allochtones de la zone Subbétique,dans la transversale
de Grenade (Cordillères Bétiques, Espagne). Rev. Geogr. Phys. Geol. Dyn. 2, 211–222. Garcia-Hernandez, M., Lopez-Garrido, A.C., Rivas, P., Sanz de Galdeano, C., Vera, J.A.,
1980. Mesozoic paleogeographic evolution of the External Zones of the Betic Cordillera. Geol. Mijnb. 59, 155–168.
Godfrey, N.J., Christensen, N.I., Okaya, D.A., 2000. Anisotropy of schists: contribution of crustal anisotropy to active source seismic experiments and shear wave splitting observations. J. Geophys. Res. 105, 27991–28007.
Gripp, A.E., Gordon, R.G., 2002. Young tracks of hotspots and current plate velocities. Geophys. J. Int. 150, 321–361.
Gutscher, M.A., Malod, J., Rehault, J.P., Contrucci, I., Klingelhoefer, F., Mendes, V.L., Spakman, W., 2002. Evidence for active subduction beneath Gibraltar. Geology 30, 1071–1074. Jung, H., Karato, S., 2001. Water-induced fabric transitions in olivine. Science 293,
1460–1463.doi:10.1126/science.1062235.
Kaminski, E., Ribe, N.M., 2002. Timescales for the evolution of seismic anisotropy in mantleflow. Geochem. Geophys. Geosystem 3, 1051.doi:10.1029/2001GC000222. Kennett, B.L.N., 1995. Seismic traveltime table. In: Ahrens, T.J. (Ed.), Global Earth Physics. A
Handbook of Physical Constants. AGU Ref. Shelf. AGU, Washington, DC, pp. 126–143. Kennett, B.L.N., Engdahl, E.R., 1991. Travel times for global earthquake location and
phase identification. Geophys. J. Int. 105, 429–465.
Lonergan, L., White, N., 1997. Origin of the Betic-Rif mountain belt. Tectonics 16, 504–522. Lucente, F.P., Margheriti, L., Piromallo, C., Barruol, G., 2006. Seismic anisotropy reveals the long route of the slab through the western-central Mediterranean mantle. Earth Planet. Sci. Lett. 241, 517–529.doi:10.1016/j.epsl.2005.10.041.
Luján, M., Crespo-Blanc, A., Balanyá, J.C., 2006. The Flysch Trough thrust imbricate (Betic Cordillera):a key element of the Gibraltar Arc orogenic wedge. Tectonics 25, TC6001. doi:10.1029/2005TC001910.
Mainprice, D., Silver, P.G., 1993. Interpretation of SKS-waves using samples from the subcontinental lithosphere. Phys. Earth Planet. Inter. 78, 257–280.doi:10.1016/ 0031-9201(93)90160-B.
Mainprice, D., Barruol, G., Ben Ismail, W., 2000. The seismic anisotropy of the Earth's mantle: from single crystal to polycrystal. In: Karato, S.I. (Ed.), Earth's Deep Interior: Mineral Physics and Tomography from the Atomic to the Global Scale. . Geodyn. Ser. AGU, Washington, D.C., pp. 237–264.
Mainprice, D., Tommasi, A., Couvy, H., Cordier, P., Frost, D.J., 2005. Pressure sensitivity of olivine slip systems: implications for the interpretation of seismic anisotropy of the Earth's upper mantle. Nature 433, 731–733.
Marson-Pidgeon, K., Savage, M., 2004. Shear-wave splitting variations across an array in the southern North Island, New Zealand. Geophys. Res. Lett. 31, 21602.doi:10.1029/ 2004GL021190.
Mele, G., Rovelli, A., Seber, D., Hearn, T., Barazangi, M., 1998. Compressional velocity structure and anisotropy in the uppermost mantle beneath Italy and surrounding regions. J. Geophys. Res. 103 (B6).doi:10.1029/98JB00596.
Morales, J., Serrano, I., Jabajoy, A., Galindo-Zaldívar, J., Zhao, D., Torcal, F., Vidal, F., González Lodeiro, F., 1999. Active continental subduction beneath the Betic Cordillera and the Alborán Sea. Geology 27, 735–738.
Nicolas, A., Christensen, N.I., 1987. Formation of anisotropy in upper mantle peridotites— A review. In: Fuchs, K., Froideveaux, C. (Eds.), Composition Structure and Dynamics of the Lithosphere Asthenosphere System. AGU, Washington D.C., pp. 111–123. Ott D'Estevou, P., Montenat, C., 1985. Evolution structurale de la zone bétique orientale
(Espagne) du Tortonian a l'Holocene. C. R. Acad. Sci. Paris 300, 363–368. Pera, E., Mainprice, D., Burlini, L., 2003. Petrophysical properties of the upper mantle
beneath the Torre Alfina area (Northern Apennines, Central Italy). Tectonophysics 370, 11–30.
Platt, J.P., Vissers, R.L.M., 1989. Extensional collapse of thickened continental litho-sphere: a working hypothesis for the Alboran Sea and Gibraltar Arc. Geology 17, 540–543.
Platt, J.P., Soto, J.I., Comas, M.C., Leg 161 Shipboard Scientific Party, 1996. Decompression and high-temperature–low-pressure metamorphism in the exhumed floor of an extensional basin, Alboran Sea, western Mediterranean. Geology 24 (5), 447–450. Platt, J.P., Soto, J.I., Whitehouse, M.J., Hurford, A.J., Kelley, S.P., 1998. Thermal evolution,
rate of exhumation, and tectonic significance of metamorphic rocks from the floor of the Alboran extensional basin, western Mediterranean. Tectonics 17, 671–689. Platt, J.P., Whitehouse, M.J., Kelley, S.P., Carter, A., Hollick, L., 2003. Simultaneous
extensional exhumation across the Alborán Basin: implications for the causes of late orogenic extension. Geology 31, 251–254.
Rosenbaum, G., Lister, G.S., 2004. Neogene and Quaternary rollback evolution of the Tyrrhenian Sea, the Apennines and the Sicilian Maghrebides. Tectonics 23, TC1013. doi:10.1029/2003 TC001518.
Royden, L.H., 1993. Evolution of retreating subduction boundaries formed during continental collision. Tectonics 12, 629–638.
Russo, R., Silver, P., 1994. Trench-parallelflow beneath the Nazca Plate from seismic anisotropy. Science 263, 1105–1111.
Savage, M.K., 1999. Seismic anisotropy and mantle deformation: what have we learned from shear wave splitting? Rev. Geophys. 37, 69–106.
Schmid, C., Van der Lee, S., Giardini, D., 2004. Delay times and shear wave splitting in the Mediterranean region. Geophys. J. Int. 159, 275–290.
Seber, D., Barazangi, M., Ibenbrahim, A., Demnati, A., 1996a. Geophysical evidence for lithospheric delamination beneath the Alboran Sea and Rif-Betics mountains. Nature 379, 785–790.
Serrano, I., Hearn, T.M., Morales, J., Torcal, F., 2005. Seismic anisotropy and velocity structure beneath the southern half of the Iberian peninsula. Phys. Earth Planet. Inter. 150 (4), 317–330.
Sieminski, A., Liu, Q., Trampert, J., Tromp, J., 2007. Finite-frequency sensitivity of body waves to anisotropy based upon adjoint methods. Geophys. J. Int. 171, 368–389. doi:10.1111/j.1363-246X.2007.03528.x.
Silver, P.G., Chan, W.W., 1988. Implications for continental structure and evolution from seismic anisotropy. Nature 335, 34–39.
Silver, P.G., Chan, W.W., 1991. Shear wave splitting and subcontinental mantle deformation. J. Geophys. Res., 96, 16429–16454.
Silver, P.G., Savage, M., 1994. The interpretation of shear-wave splitting parameters in the presence of two anisotropic layers. Geophys. J. Int. 119, 949–963.
Simancas, J.F., Carbonell, R., Gonzalez Lodeiro, F., Perez Estaun, A., Juhlin, C., Ayarza, P., Kashubin, A., Azor, A., Martınez Poyatos, D., Almodovar, G.R., Pascual, E., Saez, R., Exposito, I., 2003. Crustal structure of the transpressional Variscan orogen of SW Iberia: SW Iberia deep seismic reflection profile (IBERSEIS). Tectonics 22 (6), 1062. Stich, D., Ammon, C.J., Morales, J., 2003. Moment tensor solutions for small and moderate earthquakes in the Ibero-Maghreb region. J. Geophys. Res. 108, 2148. doi:10.1029/2002JB002057.
Stich, D., Mancilla, F., Morales, J., 2005. Crust–mantle coupling in the Gulf of Cadiz (SW-Iberia). Geophys. Res. Lett. 2, L13306.doi:10.1029/2005GL023098.
Stich, D., Serpelloni, E., Mancilla, F., Morales, J., 2006. Kinematics of the Iberia-Maghreb plate contact from seismic moment tensors and GPS observations. Tectonophysics 426, 295–317.
Turner, S.P., Platt, J.P., George, R.M.M., Kelley, S.P., Pearson, D.G., Nowell, G.M., 1999. Magmatism associated with orogenic collapse of the Betic-Alboran Domain. SE Spain. J. Petrol. 40, 1011–1036.
Vauchez, A., Nicolas, A., 1991. Mountain building: strike parallel motion and mantle anisotropy. Tectonophysics 185, 183–201.
Vauchez, A., Garrido, C., 2001. Seismic properties of an asthenospherized lithospheric mantle: constraints from lattice preferred orientations in peridotite from the Ronda Massif. Earth Planet. Sci. Lett. 192, 245–259.
Vinnik, L.P., Makeyeva, L.I., Milev, A., Usenko, A.Yu., 1992. Global patterns of azimuthal anisotropy and deformations in the continental mantle. Geophys. J. Int. 111, 433–447. Walker, K.T., Bokelmann, G.H.R., Klemperer, S.L., Bock, G., 2005. Shear-wave splitting around the Eifel hotspot: evidence for a mantle upwelling. Geophys. J. Int., 163, 962–980.
Walker, K.T., Bokelmann, G.H.R., Klemperer, S.L., Bock, G., the Eifel plume team, 2007. Seismic anisotropy in the asthenosphere beneath the Eifel region. In: Ritter, J.R.R., Christensen, U.R. (Eds.), Mantle plumes— a multidisciplinary approach. Springer-Verlag, VIII, pp. 439–464.
Wessel, P., Smith, H.F., 1995. New version of the Generic Mapping Tools released. EOS, Trans. Am. Geophys. Un. 76, 329.
Wortel, M.J.R., Spakman, W., 2000. Subduction and slab detachment in the Mediterranean–Carpathian region. Science 290, 1910–1917.
Wüstefeld, A., Bokelmann, G.H.R., 2007. Null detection in shear-wave splitting measurements. Bull. Seismol. Soc. Am. 97 (4), 1204–1211.
Wüstefeld, A., Bokelmann, G.H.R., Zaroli, C., Barruol, G., 2008. SplitLab: a shear-wave splitting environment in Matlab. Comput. Geosci.doi:10.1016/j.cageo.2007.1008.1002. Zeck, H.P., 1996. Betic-Rif orogeny:subduction of Mesozoic Tethys lithosphere under eastward drifting Iberia, slab detachment shortly before 22 Ma, and subsequent uplift and extensional tectonics. Tectonophysics 254, 1–16.
Zeck, H.P., Kristensen, A.B., Williams, I.S., 1998. Post-collisional volcanism in a sinking slab setting-crustal anatectic origin of pyroxene-andesite magma, Caldear Volcanic Group, Neogene Alborán volcanic Province, southeastern Spain. Lithos 45, 499–522.