HAL Id: hal-00304127
https://hal.archives-ouvertes.fr/hal-00304127
Submitted on 22 Apr 2008HAL is a multi-disciplinary open access
archive for the deposit and dissemination of sci-entific research documents, whether they are pub-lished or not. The documents may come from teaching and research institutions in France or abroad, or from public or private research centers.
L’archive ouverte pluridisciplinaire HAL, est destinée au dépôt et à la diffusion de documents scientifiques de niveau recherche, publiés ou non, émanant des établissements d’enseignement et de recherche français ou étrangers, des laboratoires publics ou privés.
Evaluation of the tropospheric flows to a major
Southern Hemisphere stratospheric warming event using
NCEP/NCAR Reanalysis data with a PSU/NCAR
nudging MM5V3 model
K. Wang
To cite this version:
K. Wang. Evaluation of the tropospheric flows to a major Southern Hemisphere stratospheric warming event using NCEP/NCAR Reanalysis data with a PSU/NCAR nudging MM5V3 model. Atmospheric Chemistry and Physics Discussions, European Geosciences Union, 2008, 8 (2), pp.7953-7976. �hal-00304127�
ACPD
8, 7953–7976, 2008 MM5V3 modeling of the 2002 SH stratosphere K. Wang Title Page Abstract Introduction Conclusions References Tables Figures ◭ ◮ ◭ ◮ Back Close Full Screen / Esc Printer-friendly VersionInteractive Discussion
Atmos. Chem. Phys. Discuss., 8, 7953–7976, 2008 www.atmos-chem-phys-discuss.net/8/7953/2008/ © Author(s) 2008. This work is distributed under the Creative Commons Attribution 3.0 License.
Atmospheric Chemistry and Physics Discussions
Evaluation of the tropospheric flows to a
major Southern Hemisphere stratospheric
warming event using NCEP/NCAR
Reanalysis data with a PSU/NCAR
nudging MM5V3 model
K. Wang
Department of Atmospheric Sciences, National Central University, Chung-Li, Taiwan Received: 12 February 2008 – Accepted: 26 March 2008 – Published: 22 April 2008 Correspondence to: K.-Y. Wang ([email protected])
ACPD
8, 7953–7976, 2008 MM5V3 modeling of the 2002 SH stratosphere K. Wang Title Page Abstract Introduction Conclusions References Tables Figures ◭ ◮ ◭ ◮ Back Close Full Screen / Esc Printer-friendly VersionInteractive Discussion
Abstract
Previous studies of the exceptional 2002 Southern Hemisphere (SH) stratospheric warming event lead to some uncertainty, namely the question of whether excessive heat fluxes in the upper troposphere and lower stratosphere are a symptom or cause of the 2002 SH warming event. In this work, we use a hemispheric version of the
5
MM5 model with nudging capability and we devised a novel approach to separately test the significance of the stratosphere and troposphere for this year. We paired the flow conditions from 2002 in the stratosphere and troposphere, respectively, against the conditions in 1998 (a year with displaced polar vortex) and in 1948 (a year with strong polar vortex that coincided with the geographical South Pole). Our experiments show
10
that the flow conditions from below determine the stratospheric flow features over the polar region. Regardless of the initial stratospheric conditions in 1998 or 1948, when we simulated these past stratospheres with the troposphere/lower stratosphere con-ditions constrained to 2002 levels, the simulated middle stratospheres resemble those observed in 2002 stratosphere over the polar region. On the other hand, when the 2002
15
stratosphere was integrated with the troposphere/lower stratosphere conductions con-strained to 1948 and 1998, respectively, the simulated middle stratospheric conditions over the polar region shift toward those of 1948 and 1998. Thus, our experiments further support the wave-forcing theory as the cause of the 2002 SH warming event.
1 Introduction
20
Prior to September 2002, occasional general circulation model experiments were con-sidered to have defects in the models when they showed warming in the SH strato-sphere (Baldwin et al., 2003; Scaife et al., 2005). As such, the unprecedented warming of the 2002 Antarctic winter stratosphere was a truly extraordinary event (WMO, 2002; Varotsos, 2003, and the references therein; Baldwin et al., 2003). Since no major
25
ACPD
8, 7953–7976, 2008 MM5V3 modeling of the 2002 SH stratosphere K. Wang Title Page Abstract Introduction Conclusions References Tables Figures ◭ ◮ ◭ ◮ Back Close Full Screen / Esc Printer-friendly VersionInteractive Discussion
began in 1957 (Andrews et al., 1987; Shepherd et al., 2005), this dramatic event pro-vided an excellent opportunity to explore the mechanism linking the troposphere and stratosphere.
It has been argued that the 2002 SH warming event was rooted in the troposphere. For example, from an analysis of a global model forecasts of the 2002 SH
warm-5
ing, Allen et al. (2006) argued that large amounts of upward energy propagation from 500 hPa, at a region of strong blocking over the South Atlantic, caused extremely large heat fluxes at 100 hPa that in turn led to the SH warming; Nishii and Nakamura (2004) argued that blocking over the South Atlantic troposphere caused the 2002 SH event; Scaife et al. (2005) countered that the 2002 SH warming event could be explained
10
as a response to more vigorous planetary waves near the tropopause; Manney et al. 2005) showed that strong forcing at 100-hPa could be viewed as the primary cause of the warming, and that the stratospheric flow was largely determined by the 100 hPa geopotential heights; Kushner and Polvani (2005) demonstrated that a very simple model of the SH stratosphere, forced only by tropospheric baroclinic eddies, could
pro-15
duce SH stratospheric warming characteristically similar to the observed 2002 event. It has been shown that numerical weather prediction models were able to predict the 2002 SH warming events in advance (Simmons et al., 2005; Allen et al., 2006); that idealized model experiments qualitatively reproduced the SH stratospheric warming re-sults when the tropospheric baroclinic wave forcing eddies were present (Kushner and
20
Polvani, 2005); and that the 2002 SH vortex splitting could be reproduced through the resonant growth of the planetary waves in the stratosphere to the forcing frequency of the troposphere (Esler et al., 2006).
Most of these studies used the excessive heat flux diagnosed in the upper tropo-sphere, which had pressures measuring 100 hPa to 200 hPa, as evidence that strong
25
tropospheric wave forcing caused this event (e.g., Newman and Nash, 2005). But Charlton et al. (2005) countered that the exceptional heat flux may be a symptom of the exceptional stratospheric warming rather than the cause. Charlton et al. (2005) concluded that because the variance in geopotential height at 60◦S occurred in the
ACPD
8, 7953–7976, 2008 MM5V3 modeling of the 2002 SH stratosphere K. Wang Title Page Abstract Introduction Conclusions References Tables Figures ◭ ◮ ◭ ◮ Back Close Full Screen / Esc Printer-friendly VersionInteractive Discussion
troposphere and stratosphere simultaneously in the spring of 2002, the forcing did not necessarily come from below. Using a general circulation model, with a lower bound-ary at 10 hPa (∼30 km) and an upper boundbound-ary of 500 km and forced by the 2002 National Center for Environmental Prediction (NCEP) reanalysis, Liu and Roble (2005) argued that the 2002 SH warming event was caused by a downward propagation of
5
wind and temperatures changes that occurred in the mesosphere. Notably, Liu and Roble (2005)’s experiments were forced by the 2002 NCEP reanalysis at the 30 km lower boundary. It is unclear whether downward propagation of wave disturbance from the mesosphere to the stratosphere could result if not forced by the 2002 reanalysis at 30 km.
10
With all this in mind, we must still ask: were tropospheric flows critical to the occur-rence of the dramatic 2002 SH stratospheric warming? To answer this question, we developed a novel approach to test the importance of the 2002 stratospheric and tropo-spheric flows, respectively. Since previous works analyzed the tropotropo-spheric and strato-spheric flow conductions as an integrated flow system, it was difficult to distinguish the
15
cause and effect issue raised by Charlton et al. (2005). In this work we attempt a dif-ferent approach. We actually break down the the tropospheric master/stratospheric slave model, as guided by Charlton et al. (2005), and test each flow regime sepa-rately. Here, we shall determine whether the exceptional 2002 SH stratospheric warm-ing event could be duplicated in experiments if the stratospheric flows from other years
20
were subjected to the same forcing of the 2002 troposphere. On the other hand, we ask if 2002 SH warming event could occur if the 2002 stratospheric flows were subjected to the tropospheric conditions from other years?
ACPD
8, 7953–7976, 2008 MM5V3 modeling of the 2002 SH stratosphere K. Wang Title Page Abstract Introduction Conclusions References Tables Figures ◭ ◮ ◭ ◮ Back Close Full Screen / Esc Printer-friendly VersionInteractive Discussion
2 Data and models
2.1 NCEP/NCAR reanalysis data
This work relies on the three-dimensional NCEP/ National Center for Atmospheric Research (NCAR) Reanalysis data obtained from the Climate Diagnostic Center (CDC)/National Oceanic and Atmospheric Administration (NOAA) (Kalnay et al., 1996;
5
Kistler et al., 2000). NCEP/NCAR Reanalysis is one of the most widely used atmo-spheric dataset (e.g., Kalnay and Cai, 2003). Two important characteristics distinguish NCEP/NCAR Reanalysis dataset from other datasets: its longterm coverage (1948-present), and its open accessibility. In the absence of these two factors, this research would not have been possible. We used NCEP/NCAR Reanalysis data as (i) initial
con-10
ditions and boundary conditions for the MM5V3 simulations; and (ii) gridded analysis data for the four dimensional data nudging simulations.
2.2 A hemispheric PSU/NCAR MM5V3 model
The fifth-generation Pennsylvania State University/National Center for Atmospheric Re-search Mesoscale Model (PSU/NCAR MM5) is a reRe-search tool supported by NCAR for
15
community numerical weather prediction and mesoscale modeling research (e.g., Dud-hia and Bresch, 2002, and the references therein). The PSU/NCAR MM5 is a proven, state-of-the-art creation and has had numerous applications since its initial inception by Anthes and Warner (1978).
In order to understand the process that produced this extraordinary 2002 Antarctic
20
vortex split, we will perform a series of direct simulations of the stratospheric flow of September 2002. Figure1shows the horizontal domain used in the three-dimensional modeling experiments. Dudhia and Brech (2002) developed a global version of the PSU/NCAR Mesoscale Model that combines two polar stereographic projections, one of the Northern Hemisphere and one of the Southern Hemisphere, to form a global
25
ACPD
8, 7953–7976, 2008 MM5V3 modeling of the 2002 SH stratosphere K. Wang Title Page Abstract Introduction Conclusions References Tables Figures ◭ ◮ ◭ ◮ Back Close Full Screen / Esc Printer-friendly VersionInteractive Discussion
boundary conditions from the NCEP/NCAR Reanalysis dataset are used as boundary conditions for the regions outside the model domain.
For the purpose of this work, the distributed-memory version of the PSU/NCAR MM5V3 model is used (Wang et al., 2005). We apply the MM5V3 modeling system to direct simulations of the September 2002 stratosphere. We also apply the MM5V3
5
modeling system’s four-dimensional data nudging capability, and we conduct several nudging simulations to investigate the importance of tropospheric forcing. In this work, the model has 31 vertical levels, and a 140 km by 140 km horizontal resolution. The
σ values for the model levels are: 0, 0.005, 0.015, 0.025, 0.035, 0.045, 0.055, 0.065,
0.08, 0.1, 0.15, 0.2, 0.25, 0.30, 0.35, 0.4, 0.45, 0.50, 0.55, 0.6, 0.65, 0.7, 0.75, 0.8,
10
0.85, 0.89, 0.93, 0.96, 0.98, 0.99, and 1. The vertical σ coordinate is defined as σ=(p − pt)/(ps− pt). Here pt is the model’s top pressure, which is a constant 10 hPa;
ps is the terrain surface pressure, and p is the pressure atσ. The use of the 10 hPa
model top is an optimal choice under the current MM5V3 configuration, and has been used in several previous studies of the stratospheric flows. Allen (2003) used MM5 with
15
a model top at 10 hPa to study stratospheric turbulence. Allen et al. (2006) examined two 5-day forecasts of geopotential heights at 10 hPa during the 2002 SH warming event using an operational model with model top at 1 hPa and 0.005 hPa, respectively. They found that the distinctive warming high and the vortex with lobes from these two forecast simulations closely resembled each other. Simmons et al. (2005) found that
20
the forecasts using the 40-level model with a model top at 10 hPa were reasonably skillful but less accurate than the results using the 60-level model with to top at 0.1 hPa (∼65 km).
It would be ideal to set a model top higher than the 10 hPa, because the upper boundary of the model reflects vertically propagating wave activity. Boville and Chen
25
(1988) showed, using the climate of a 15-level general circulation model with a model top at 10 hPa (∼30 km) cimpared with a 26-level model with a model top at 0.1 hPa, that an upper boundary of 10 hPa showed the effects of stronger polar night jets and colder polar temperatures in the lower stratosphere. This result was due to more wave
ACPD
8, 7953–7976, 2008 MM5V3 modeling of the 2002 SH stratosphere K. Wang Title Page Abstract Introduction Conclusions References Tables Figures ◭ ◮ ◭ ◮ Back Close Full Screen / Esc Printer-friendly VersionInteractive Discussion
reflection, which leads to increasing wave amplitude, which leads to changing heat and momentum fluxes, which leads to an increase in the net westerly forcing to the zonal mean wind, which results in a much stronger polar night jet and the very cold lower stratosphere temperatures mentioned above. Another advantage of a higher model top boundary is that the effects of the upper stratosphere and the mesosphere can be
con-5
sidered, e.g. downward propagation of winds and temperatures from the mesosphere shown in Liu and Roble (2005). However, other uncertainties, such as the represen-tation of the upper boundary and the lack of explicit represenrepresen-tation of the effects of breaking gravity waves, require further development of the MM5V3 model if the model top is set at altitudes higher than 10 hPa. We have experimented with several MM5V3
10
models using model top above 10 hPa, but the instability, most likely resulting from the model being unable to control the strength of the polar vortex, prevented us from using a model top above 10 hPa. On the other hand, several previous works have shown that 10 hPa top models were capable of reproducing stratospheric warming events oc-curred before (e.g., see Andrews et al., 1987, and reference therein; Simmons et al.,
15
2005), indicating that the key mechanisms responsible for the stratospheric warming processes are largely self-contained in the flow regions below 10 hPa. Hence, we use the 10 hPa model top configuration not for its absolute accuracy but for its accurate simulation of dynamical processes compared to those delivered using a higher model top (e.g., Simmons et al., 2005).
20
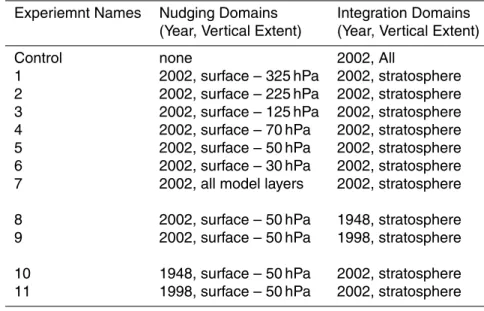
Table1 shows a list of the twelve MM5V3 experiments. Each experiment was ini-tialized at 12:00 UTC on 12 September. In the control run, there is no nudging of the analysis data. Experiments 1 through 7 show a series of nudging experiments, in which different vertical extents of the 2002 tropospheric flows were used as constraints of the analysis data, while the model stratospheric flows were left to evolve during each
288-25
h simulation. These experiments were designed to determine the minimum vertical extent (if a minimum existed) that would be required to reproduce the warming event. From these experiments, we found that if the atmospheric flows below 50 hPa (∼21 km) were constrained to the analysis data, then the model produced the 2002 SH warming
ACPD
8, 7953–7976, 2008 MM5V3 modeling of the 2002 SH stratosphere K. Wang Title Page Abstract Introduction Conclusions References Tables Figures ◭ ◮ ◭ ◮ Back Close Full Screen / Esc Printer-friendly VersionInteractive Discussion
and the vortex splitting similar to actual observations. Thus we identified the 50 hPa pressure level as the upper boundary for the influence of flows from below.
Experiments 8 and 9, used 1948 and 1998 simulations, respectively, and each model was run for 312 h with the flows below 50 hPa constrained to the 2002 conditions while the flows above 50 hPa were left to evolve. These experiments were designed to test
5
the robustness of the 2002 flows, from the surface up to 50 hPa. In experiments 10 and 11, the model was run for two sets of the 312-h simulations. Experiment 10 was run with the flow conditions below 50 hPa constrained to the 1948 conditions, and Experi-ment 11 was run with flow conditions below 50 hPa constrained to the 1998 conditions. These experiments were designed to test if the 2002 stratosphere could still produce
10
the 2002 SH warming event when flow conditions below 50 hPa from other years were used. These years were carefully selected. In 1998, the center of the Antarctic polar vortex was significantly displaced from the geographical South Pole. In contrary, the Antarctic polar vortex in 1948 showed a strongly symmetrical flow structure with the vortex center directly over the Pole.
15
3 Results
3.1 Direct simulations without nudging
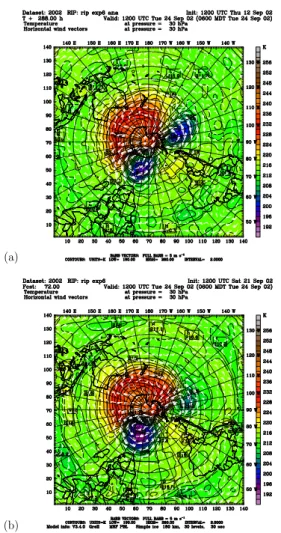
Figure 2a shows the 30-hPa temperature and wind analysis at 12:00 UTC on 24 September 2002. The split of the polar vortex and the warming of the Antarctic strato-sphere (with a maximum temperature of 243.7 K) are clearly present. The warming
20
area is accompanied by a well-defined anticyclonic circulation, along with two split vortices with low temperatures (196.2 K in the vortex located at about 10◦E–20◦E, and 198.4 K in the vortex located at about 110◦W) and their associated cyclonic cir-culations. These features satisfy the synoptic definition of a major stratospheric SH warming event (Andrews et al., 1987).
25
ACPD
8, 7953–7976, 2008 MM5V3 modeling of the 2002 SH stratosphere K. Wang Title Page Abstract Introduction Conclusions References Tables Figures ◭ ◮ ◭ ◮ Back Close Full Screen / Esc Printer-friendly VersionInteractive Discussion
September 2002. The model was initialized at 12:00 UTC 21 September 2002. The main features, including major stratospheric warming with the anticyclonic circulation, a split polar vortex, and associated cyclonic circulations, are reproduced by the model. However, the model predicts a stronger vortex at 20◦E with a lowest temperature of 194.5 K, a weaker vortex at 110◦
W with a minimum temperature of 204.5 K, and less
5
warming (a maximum temperature of 241.7 K) in the anticyclonic region than were actually observed. This 72-h simulation shows that the model configuration we used in this work is able to reproduce the main features of the 2002 SH warming event.
Figure 3a shows a 288-h simulation of temperature and wind at 12:00 UTC on 24 September 2002. The model produces a polar vortex displaced from the geographical
10
South Pole, with a lowest in-vortex temperature of 195 K, and less extensive warming over the Antarctic region. This 288-h forecast resembles previous Antarctic strato-sphere vorticies such as the one in 1998 (see discussion in the next section). This characteristically displaced vortex, unlike a splitting vortex from a longer (10-day) fore-cast, has been found in other simulations (e.g., Figs. 4 and 5 of Simmons et al., 2005;
15
Fig. 2 of Allen et al., 2006). Allen et al. (2006) supposed that model limitations for forecasting tropospheric blocking are the likely cause of less accurate longer forecasts. Based on the NCEP reanalysis, Niishi and Nakamura (2004) argued that the block-ing over the South Atlantic, forced by anomalous deep convection in the South Pacific Convergence Zone, was the source of the wavetrains that led to the 2002 SH warming.
20
3.2 Nudging simulations
In order to quantify the influence of tropospheric forcing to the development of the 2002 Antarctic SH warming event, we performed a series of model experiments to identify the region where the tropospheric forcing was significant to the warming event. The most important factor in these experiments was the introduction of the observed
25
(analyzed) tropospheric conditions into the model troposphere as the model integrates forward in time. Here we employed the nudging method developed in the PSU/NCAR MM5 modeling system (Grell et al., 1994) for these tropospheric forcing experiments.
ACPD
8, 7953–7976, 2008 MM5V3 modeling of the 2002 SH stratosphere K. Wang Title Page Abstract Introduction Conclusions References Tables Figures ◭ ◮ ◭ ◮ Back Close Full Screen / Esc Printer-friendly VersionInteractive Discussion
Notice that in the following discussions, the model has been integrated forward 288 h, so the results discussed in this section contain the same simulation length (288 h) as Fig.3a.
Figure3b shows the 30-hPa temperature and wind fields from a 288-h simulation run with nudging in the region below 325 hPa (an altitude of about 9 km). The simulation
5
was verified at 12:00 UTC on 24 September 2002. A comparison of Fig.3b with Fig.3a, clearly demonstrates the effect of tropospheric forcing on stratosphere flow. The char-acteristic warming of the polar region is reproduced by the model. Most importantly, the overlapping pattern of extensive anticyclonic flow with the major high temperature region can be clearly seen, indicating that the model replicated a major SH warming.
10
There are discrepancies between the nudging simulation and analysis. The highest temperature in the anticyclone (233 K) was lower than in the analysis (243 K), and the lowest temperature in the cyclone (189 K) was lower than the analysis (196 K).
While Fig.3b shows a displaced polar vortex at the geographical South Pole, the real situation was a split polar vortex. Hence, we systematically raised the upper
bound-15
aries of the nudging region, providing the model with more analysis data to see if the model was capable of producing a splitting polar vortex. Figure 3c shows a simula-tion in which upper boundary of the tropospheric nudging region has been raised to about 225 hPa (about 11 km height). Here we observe that, in addition to the com-mon features shown in Fig. 3c, an area of low temperatures gradually appears over
20
the 120◦
W–80◦
W region. This is the simulation’s first sign of an emerging splitting vortex. As the upper boundary of the tropospheric nudging region was raised further, to 125 hPa (about 15 km), Fig.3d, we see noticeable developments: the lowest tem-perature inside the polar vortex has increased to 193 K, warm temtem-peratures show a tendency to extend out from the pole, and an area of low temperatures steadily grows
25
over the 120◦W–80◦W region. When the upper boundary of the nudging region was raised to about 72 hPa (about 19 km height), the second vortex at 90◦
W is noticeable, Fig.4a.
ACPD
8, 7953–7976, 2008 MM5V3 modeling of the 2002 SH stratosphere K. Wang Title Page Abstract Introduction Conclusions References Tables Figures ◭ ◮ ◭ ◮ Back Close Full Screen / Esc Printer-friendly VersionInteractive Discussion
is raised to near 50 hPa (about 21 km height), Fig.4b. In this simulation the two lobes of the splitting polar vortex are separated by the advancing warm air. As we move the upper boundary of the nudging region even higher to 30 hPa (about 24 km), Fig. 4c, the results are completely constrained to the analysis. Fig. 4d shows results when the model domain is entirely integrated with the analysis, and produces the expected
5
nudging simulation identical to that of the analysis.
These simulations show that as the upper boundary of the nudging region is gradu-ally raised from 9 km to 21 km, the warming area over the South Antarctic stratosphere grows, the first emerging vortex becomes smaller, and the second emerging vortex gradually emerges. The second emerging vortex becomes identifiable in our
simula-10
tions when the nudging information from the lower stratosphere is used to constrain the simulation.
Here we demonstrate that the hypothesis of tropospheric forcing, as first formulated by Matsuno (1971), is useful in explaining the warming of the stratosphere by an ex-ternal forcing mechanism from the troposphere. From a 100-yr integration of a
sim-15
ple global circulation model, Taguchi and Yoden (2002) found that stratospheric flows showed little interannual variation in any seasons when the simulation was run without topography, and dynamically active stratospheric flows with large interannual varia-tions in any season run with topography included. The use of accurate tropospheric conditions can dramatically improve stratospheric forecasts as shown when comparing
20
Fig.3a with Fig.3b, a conclusion also reached by Allen et al. (2006). However, in order to reproduce the splitting vortex, more information is needed from the lower strato-sphere. As more and more layers are added in the lower stratosphere, the simulated flows bear closer resemblance to those observed. Apparently, the troposphere initiates the large scale disturbances in the stratosphere. However, to have an exceptional SH
25
warming event with a splitting polar vortex, the stratospheric flows in the lower strato-sphere must also be unique. Perhaps this combination – when the right tropospheric forcing meets the right lower stratospheric flows – is simply so unusual that major SH warming has not been observed before. Perhaps the weak tropospheric forcing in the
ACPD
8, 7953–7976, 2008 MM5V3 modeling of the 2002 SH stratosphere K. Wang Title Page Abstract Introduction Conclusions References Tables Figures ◭ ◮ ◭ ◮ Back Close Full Screen / Esc Printer-friendly VersionInteractive Discussion
Southern Hemisphere must wait for the right lower stratospheric conditions to magnify and/or resonate its effect (Andrews et al., 1987; Esler et al., 2006).
3.3 Test of the 2002 troposphere
In order to further investigate the importance and significance of the tropospheric and lower stratospheric conditions in 2002, we performed two completely different set of
5
experiments (Experiments 8 and 9 of Table 1) using the nudging method with differ-ent combinations of stratospheric and tropospheric flow conditions. Our first set of experiments tested what impact the 2002 tropospheric conditions would have if we put stratospheres from other years under the influence of the 2002 troposphere?
Figure5b shows the 30-hPa temperature and wind fields from a 312-h simulation of
10
the 2002 stratosphere, with the tropospheric nudging using data from 2002. The model was verified against the analysis at 12:00 UTC on 25 September 2002, Fig.5a. When the 1948 stratospheric conditions were modeled with the 2002 tropospheric conditions, Fig.5c shows a 312-h simulation of the 30-hPa temperature and wind fields verified at 12:00 UTC on 25 September 1948. The result clearly shows that the original strong
15
polar vortex of 1948 (Fig. 6c) has been replaced by the warming temperatures over the polar region. The polar vortex is no longer a recognizable shape when viewed with the temperature contours, and the spatial distribution of the high temperature region is characteristically similar to the 2002 SH warming region.
We subjected the 1998 stratosphere to the 2002 tropospheric conditions, and the
re-20
sults are shown in Fig.5d. As in Fig.5c, we observed the warming of the polar region, the advancing of high temperatures across the pole, and discernible anticyclonic flow patterns over the high temperature region. Figure 6d shows the 30 hPa temperature and wind analysis at 12:00 UTC 25 September 1998, indicating a significant high tem-perature area in a location similar to the 2002 SH warming event. Though this high
25
temperature area pushes the polar vortex off the geographical South Pole, the polar vortex maintains its well-defined temperature and cyclonic wind structures and shows no occurrence of a splitting polar vortex. Actually, this situation more closely resembles
ACPD
8, 7953–7976, 2008 MM5V3 modeling of the 2002 SH stratosphere K. Wang Title Page Abstract Introduction Conclusions References Tables Figures ◭ ◮ ◭ ◮ Back Close Full Screen / Esc Printer-friendly VersionInteractive Discussion
the one we see in Fig. 3b, where only the tropospheric domain of data (below 9 km) is used in the nudging simulation. Thus it is likely that the 1998 Antarctic stratosphere was also subjected to strong forcing from the troposphere.
These simulations show that the warming in the anticyclonic area is a combined effect of tropospheric forcing and lower stratospheric flow, but the formation of a splitting
5
vortex and their associated cyclonic flows requires the contributions from higher up altitudes (e.g., Charton et al., 2005; Liu and Roble, 2006). There are areas with well-defined high temperatures as seen in Figs. 5 c and d, which are characteristically similar to those observed in 2002. However, none of the above experiments is capable of producing well-defined anticyclonic flow patterns over the high temperature region,
10
along with a splitting polar vortex. Therefore the middle to upper stratosphere should play an important role in the forming of the splitting vortex.
3.4 Test of the 2002 stratosphere
Our second set of experiments (Experiments 10 and 11 of Table1) test the strength of the 2002 stratospheric conditions against tropospheric conditions from other years.
15
Figure6a shows the 30 hPa temperature and wind fields from a 312-h simulation us-ing the 2002 stratosphere with the tropospheric nudgus-ing usus-ing data from 1948. The model is verified against the analysis at 12:00 UTC on 25 September 2002, Fig. 5a. The resulting simulated 2002 stratosphere shows no similarities to the analysis. For example, the polar vortex remains firmly over the polar region, showing no sign of
dis-20
tortion, elongation, or being pushed off the geographical South Pole. In fact, the polar stratosphere in this simulation looks more like the one that occurred in 1948, Fig.6c.
Figure 6b shows another simulation with the tropospheric nudging using data from 1998. This simulation shows a more disturbed polar vortex; a significantly larger warm-ing region; and a displaced polar vortex resemblwarm-ing the displaced vortex that occurred
25
in 1998, Fig.5d. Hence, these experiments demonstrate that the stratospheric flow in 2002 can be nudged toward the 1948/1998 conditions if the 1948/1998 tropospheric flows are used.
ACPD
8, 7953–7976, 2008 MM5V3 modeling of the 2002 SH stratosphere K. Wang Title Page Abstract Introduction Conclusions References Tables Figures ◭ ◮ ◭ ◮ Back Close Full Screen / Esc Printer-friendly VersionInteractive Discussion
The above experiments also reveal more wave activity over latitudes outside polar region occurred in the warming experiments than in the non-warming experiments. For example, compare the 1948 stratosphere, Fig. 6c, in which no major warming was found over the polar region, with Fig.5c, in which a major warming was produced us-ing the 2002 troposphere, the warmus-ing experiment shows more wave activity than in
5
the non-warming experiment. Similarly, more wave activity appears outside the polar latitudes appear in the 1998 warming experiment, Fig.5d, than in the non-warming experiment, Fig.6d. As for 2002, we found more wave activity outside polar latitudes in the warming experiment, Fig.5b, than in the non-warming experiment, Fig.6a. This phenomenon in our experiment is consistent with previous findings, i.e., a more
res-10
onating stratosphere with respect to a more rigorous forcing from the troposphere.
4 Discussion and summary
Though Charlton et al. (2005) questioned the validity of the tropospheric mas-ter/stratospheric slave model as an explanation of the 2002 SH warming event, and despite Liu and Robel (2006), who showed preconditioning and downward
propaga-15
tion of winds and temperatures from the mesosphere to the stratosphere in their 30– 500 km stratosphere-mesosphere-ionosphere simulation, our experiments support a picture which is consistent with previous findings, namely, that forcing from surface, through the troposphere, to the lower stratosphere was the main cause of the 2002 SH warming event. Using the powerful modeling and nudging capabilities of the MM5
20
model, we have run several experiments to test on the factors that might have led to the 2002 SH warming event. We also designed two specific sets of experiments to test the robustness of the 2002 troposphere and stratosphere against the troposphere-stratosphere flow conditions of 1948 and 1998, respectively.
We found that the flow conditions from below determine the stratospheric flow
fea-25
tures over the polar region. Regardless of the initial conditions from either 1998 or 1948, when these conditions were simulated with the troposphere/lower stratosphere
ACPD
8, 7953–7976, 2008 MM5V3 modeling of the 2002 SH stratosphere K. Wang Title Page Abstract Introduction Conclusions References Tables Figures ◭ ◮ ◭ ◮ Back Close Full Screen / Esc Printer-friendly VersionInteractive Discussion
conditions from 2002, middle stratospheric flows also resembled those observed in 2002 over the polar region. On the other hand, when the 2002 stratosphere was in-tegrated with the troposphere/lower stratosphere conditions from 1948 and 1998, re-spectively, the resulting middle stratospheric conditions over the polar region veered toward those of 1948 and 1998. When comparing middle stratosphere from the
warm-5
ing experiment with non-warming experiment, more wave activity was found outside the polar region in the warming experiment than in the non-warming experiment. These experiments confirm the wave-forcing theory to explain the 2002 SH warming event (e.g., Andrews et al., 1987).
Though we have demonstrated the uniqueness of the 2002 troposphere/lower
strato-10
sphere compared to conditions in 1998 and 1948, it is still unclear exactly what trig-gered the 2002 SH warming event from below. Some have pointed to blocking in the troposphere over the Southern Atlantic as the root cause (Nishii and Nakamura, 2004; Allen et al., 2006), but it is unclear exactly how this blocking was unique enough to trig-ger the great 2002 SH warming event. Given the fact that blocking occurs frequently
15
in the SH (e.g., Trenberth and Mo, 1985; Damiao et al., 2006), more modeling tests are needed before we can confidently state the exact source of the 2002 SH warming event. We suggested that the proposed mechanism should be tested not only with the 2002 flow conditions but also with flows from other years. The MM5 nudging technique developed in this work will be useful for conducting these experiments.
20
Acknowledgements. The author is very grateful to P. Hadjinicolaou (Frederick Institute of
Tech-nology, Cyprus) for his review and comments on the manuscript. We are very grateful to UCAR/NCAR for the original MM5V3 model, NCEP for the reanalysis data (1948-present), and CDC/NOAA for its outstanding on-line data services and plotting utilities. This work was supported by the National Science Council (NSC), Taiwan, under grants 94-2111-M-008-004
25
and 93-2111-M-007. We would like thank W. Ebisuzaki, M. T. Stoelinga, B. E. Doty, and M. Ha-ley for data management and data visualization tools. The author is very grateful to J. A. Pyle and D. E. Shallcross for their continuous support. These simulations were performed on the DOBSON Cluster, developed in the Atmospheric Chemistry Modelling Laboratory at National Central University.
ACPD
8, 7953–7976, 2008 MM5V3 modeling of the 2002 SH stratosphere K. Wang Title Page Abstract Introduction Conclusions References Tables Figures ◭ ◮ ◭ ◮ Back Close Full Screen / Esc Printer-friendly VersionInteractive Discussion
References
Allen, D. R., Coy, L., Eckermann, S. D., McCormack, J. P., Manney, G. L., Hogan, T. F., and Kim, Y.-J.: NOGAPS-ALPHA simulations of the 2002 Southern Hemisphere stratospheric major warming, Mon. Weather Rev., 134, 498–518, 2006.
Allen, M. S.: Evaluation of the mountain wave forecast model’s stratospheric turbulence
simu-5
lations, M.S. thesis, 70 pp., Air University, Ohio, 2003.
Andrews, D. G., Holton, J. R., and Leovy, C. B.: Middle atmosphere dynamics, Academic Press, Inc., 489 pp., 1987.
Anthes, R. A. and Warner T. T.: Development of hydrodynamical models suitable for air pollution and other mesometeorological studies, Mon. Weather Rev., 106, 1045–1078, 1978.
10
Baldwin, M., Hirooka, T., O’Neil, A., and Yoden, S.: Major stratospheric warming in the Southern Hemisphere in 2002: Dynamical aspects of the ozone hole split, SPARC Newsletter, 20, 24– 26, 2003.
Charlton, A. J.,O’Neil, A., Lahoz, W. A., and Berrisford, P.: The splitting of the stratospheric polar vortex in the Southern Hemisphere, September 2002: Dynamical evolution, J. Atmos.
15
Sci., 62, 590–602, 2005.
Damiao, M. C., Trigo, R. M., DaCamara, C. C., and Cavalcanti, I. F. A.: A comparison of blocking climatologies for Southern Hemisphere between NCEP-NCAR reanalysis and Hadley Centre model, in Proceedings of 8 ICSHMO, 547–552, Foz do Iguacu, Brazil, April 24–28, 2006. Dudhia, J. and Bresch, J. F.: A global version of the PSU-NCAR mesoscale model, Mon.
20
Weather Rev., 130, 2989–3007, 2003.
Esler, J. G., Polvani, L. M., and Scott, R. K.: The Antarctic stratospheric
sud-dent warming of 2002: A self-tuned resonance?, Geophys. Res. Lett., 33, L12804, doi:10.1029/2006GL026034, 2006.
Grell, G. A., Dudhia, J., and Stauffer, D. R.: A description of the fifth-generation Penn
25
State/NCAR Mesoscale Model (MM5), NCAR/TN-398 + STR, NCAR Technical Note, 121 pp., 1994.
Kalnay, E., Kanamitsu, M., Kistler, R., et al.: The NCEP/NCAR 40-year reanalysis project, Bull. Am. Meteorol. Soc., 77, 437–471, 1996.
Kalnay, E. and Cai, M.: Impact of urbanization and land-use change on climate, Nature, 423,
30
528–531, 2003.
ACPD
8, 7953–7976, 2008 MM5V3 modeling of the 2002 SH stratosphere K. Wang Title Page Abstract Introduction Conclusions References Tables Figures ◭ ◮ ◭ ◮ Back Close Full Screen / Esc Printer-friendly VersionInteractive Discussion
CD-ROM and documentations, Bull. Am. Meteorol. Soc., 82, 247–267, 2000.
Kushner, P. J. and Polvani, L. M.: A very large spontaneous stratospheric sudden warming in a simple AGCM: A prototype for the Southern Hemisphere warming of 2002?, J. Atmos. Sci., 62, 890–897, 2005.
Liu, H.-L. and Robel R. G.: Dynamical coupling of the stratosphere and mesosphere in the
5
2002 Southern Hemisphere major stratospheirc warming, Geophys. Res. Lett., 32, L13804, doi:10.1029/2005GL022939, 2005.
Manney, G. L., Sabutis, J. L., Allen, D. R., et al.: Simulations of dynamics and transport during the September 2002 Antarctic major warming, J. Atmos. Sci., 62, 690–707, 2005.
Matsuno, T.: A dynamical model of the stratospheric sudden warming, J. Atmos. Sci., 28,
10
1479–1494, 1971.
Newman, P. A. and Nash, E. R.: The unusual Southern Hemisphere winter of 2002, J. Atmos. Sci., 62, 614–628, 2005.
Nielsen, J. E., Rood, R. B., Douglass, A. R., Cerniglia, M. C., Allen, D. J., and Rosenfield, J. E.: Tracer evolution in winds generated by a global spectral mechanistic model, J. Geophys.
15
Res., 99, D3, 5399–5420, 1994.
Nishii, K. and Nakamura, H.: Tropospheric influence on the dimished Antarctic ozone hole in September 2002, Geophys. Res. Lett., 31, L16103, doi:10.1029/2004GL019532, 2004. Scaife, A. A., Jackson, D. R., Swinbank, R., Butchart, N., Thornton, H. E., Keil, M., and
Hen-derson, L.: Stratospheric vacillations and the major warming over Antarctic 2002, J. Atmos.
20
Sci., 62, 629–639, 2005.
Shepherd, T., Plumb, R. A., and Wofsy, S. C.: Preface, J. Atmos. Sci., 62, 565–566, 2005. Simmons, A., Hortal, M., Kelly, G., McNally, A., Untch, A., and Uppala, S.: ECMWF analyses
and forecasts of stratospheric winter polar vortex breakup: September 2002 in the Southern Hemisphere and related events, J. Atmos. Sci., 62, 668–689, 2005.
25
Taguchi, M. and Yoden, S.: Internal interannual variability of the troposphere-stratosphere cou-pled system in a simple global circulation model. Part I: Parameter seep experiment, J. At-mos. Sci., 59, 3021–3036, 2002.
Varotsos, C.: Why did a ”No-oznehole” episode occur in Antarctica?, EOS, 84, 183, 2003. Wang, K.-Y., Shallcross, D. E., Hall, S. M., Lo, Y.-H., Chou, C., and Chen, D.: DOBSON: A
30
Pentium-Based SMP Linux PC Beowulf for distributed-memory high resolution environment modelling, Environmental Modelling and Software, 20, 1299–1306, 2005.
ACPD
8, 7953–7976, 2008 MM5V3 modeling of the 2002 SH stratosphere K. Wang Title Page Abstract Introduction Conclusions References Tables Figures ◭ ◮ ◭ ◮ Back Close Full Screen / Esc Printer-friendly VersionInteractive Discussion
Table 1. Experiment names, nudging domains, and integration domains for this work.
Experiemnt Names Nudging Domains Integration Domains
(Year, Vertical Extent) (Year, Vertical Extent)
Control none 2002, All
1 2002, surface – 325 hPa 2002, stratosphere
2 2002, surface – 225 hPa 2002, stratosphere
3 2002, surface – 125 hPa 2002, stratosphere
4 2002, surface – 70 hPa 2002, stratosphere
5 2002, surface – 50 hPa 2002, stratosphere
6 2002, surface – 30 hPa 2002, stratosphere
7 2002, all model layers 2002, stratosphere
8 2002, surface – 50 hPa 1948, stratosphere
9 2002, surface – 50 hPa 1998, stratosphere
10 1948, surface – 50 hPa 2002, stratosphere
ACPD
8, 7953–7976, 2008 MM5V3 modeling of the 2002 SH stratosphere K. Wang Title Page Abstract Introduction Conclusions References Tables Figures ◭ ◮ ◭ ◮ Back Close Full Screen / Esc Printer-friendly VersionInteractive Discussion
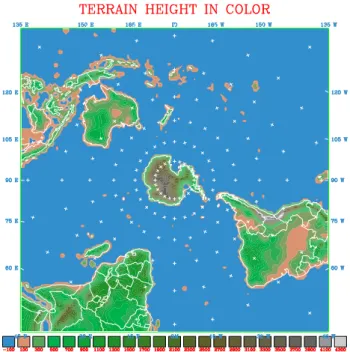
Fig. 1. Southern hemispheric domain showing topography with a 140-km grid size (see also
ACPD
8, 7953–7976, 2008 MM5V3 modeling of the 2002 SH stratosphere K. Wang Title Page Abstract Introduction Conclusions References Tables Figures ◭ ◮ ◭ ◮ Back Close Full Screen / Esc Printer-friendly VersionInteractive Discussion
(a)
(b)
Fig. 2. Temperature and winds on the 30 hPa surface at 12:00 UTC on 24 September 2002
ACPD
8, 7953–7976, 2008 MM5V3 modeling of the 2002 SH stratosphere K. Wang Title Page Abstract Introduction Conclusions References Tables Figures ◭ ◮ ◭ ◮ Back Close Full Screen / Esc Printer-friendly VersionInteractive Discussion
(a) (c)
(b) (d)
Fig. 3. Temperatures and winds on the 30 hPa surface from 288-h forecast simulations: (a)
without nudging of analysis data; with nudging of analysis data below (b) 325 hPa, (c) 225 hPa, and (d) 125 hPa surface, respectively. The forecast is verified at 12:00 UTC on 24 September 2002.
ACPD
8, 7953–7976, 2008 MM5V3 modeling of the 2002 SH stratosphere K. Wang Title Page Abstract Introduction Conclusions References Tables Figures ◭ ◮ ◭ ◮ Back Close Full Screen / Esc Printer-friendly VersionInteractive Discussion
(a) (c)
(b) (d)
Fig. 4. The same as in Fig.3but for nudging of analysis data below (a) 70 hPa, (b) 50 hPa, (c) 30 hPa, and (d) all model layers.
ACPD
8, 7953–7976, 2008 MM5V3 modeling of the 2002 SH stratosphere K. Wang Title Page Abstract Introduction Conclusions References Tables Figures ◭ ◮ ◭ ◮ Back Close Full Screen / Esc Printer-friendly VersionInteractive Discussion
(a) (c)
(b) (d)
Fig. 5. Test of the 2002 troposphere, where it was used to constrained the tropospheric
condi-tions of three 312-h integracondi-tions for (b) 2002, (c) 1948, and (d 1998, respectively. Temperatures and winds on the 30 hPa surface are validated at 12:00 UTC on 25 September of each year. Analysis for the 2002 stratospheric conditions is shown in (a).
ACPD
8, 7953–7976, 2008 MM5V3 modeling of the 2002 SH stratosphere K. Wang Title Page Abstract Introduction Conclusions References Tables Figures ◭ ◮ ◭ ◮ Back Close Full Screen / Esc Printer-friendly VersionInteractive Discussion
(a) (c)
(b) (d)
Fig. 6. Test of the 2002 stratosphere, where it was integrated for two 312-h simulations with the
troposphere constrained to the (a) 1948 and (b) 1998 conditions, respectively. Temperatures and winds on the 30 hPa surface are validated at 12:00 UTC on 25 September 2006. Analysis for 25 September of (c) 1948 and (d) 1998 are shown for reference.