HAL Id: hal-00295954
https://hal.archives-ouvertes.fr/hal-00295954
Submitted on 29 Jun 2006
HAL is a multi-disciplinary open access
archive for the deposit and dissemination of
sci-entific research documents, whether they are
pub-lished or not. The documents may come from
teaching and research institutions in France or
abroad, or from public or private research centers.
L’archive ouverte pluridisciplinaire HAL, est
destinée au dépôt et à la diffusion de documents
scientifiques de niveau recherche, publiés ou non,
émanant des établissements d’enseignement et de
recherche français ou étrangers, des laboratoires
publics ou privés.
in MOZAIC and SPURT
H.-W. Pätz, A. Volz-Thomas, M. I. Hegglin, D. Brunner, H. Fischer, U.
Schmidt
To cite this version:
H.-W. Pätz, A. Volz-Thomas, M. I. Hegglin, D. Brunner, H. Fischer, et al.. In-situ comparison of
the NO>sub>y instruments flown in MOZAIC and SPURT. Atmospheric Chemistry and Physics,
European Geosciences Union, 2006, 6 (9), pp.2401-2410. �hal-00295954�
Atmos. Chem. Phys., 6, 2401–2410, 2006 www.atmos-chem-phys.net/6/2401/2006/ © Author(s) 2006. This work is licensed under a Creative Commons License.
Atmospheric
Chemistry
and Physics
In-situ comparison of the NO
y
instruments flown in MOZAIC and
SPURT
H.-W. P¨atz1, A. Volz-Thomas1, M. I. Hegglin2, D. Brunner2, H. Fischer3, and U. Schmidt4
1Institut f¨ur Chemie und Dynamik der Geosph¨are II: Troposph¨are, Forschungszentrum J¨ulich, Germany 2Institute for Atmospheric and Climate Science, ETH-Z¨urich, Switzerland
3Max Planck Institute for Chemistry, Mainz, Germany
4Institut f¨ur Atmosph¨are und Umwelt, Johann Wolfgang Goethe-Universit¨at, Frankfurt, Germany
Received: 31 October 2005 – Published in Atmos. Chem. Phys. Discuss.: 18 January 2006 Revised: 5 May 2006 – Accepted: 16 May 2006 – Published: 29 June 2006
Abstract. Two aircraft instruments for the measurement of total odd nitrogen (NOy) were compared side by side
aboard a Learjet A35 in April 2003 during a campaign of the AFO2000 project SPURT (Spurengastransport in der Tropopausenregion). The instruments albeit employing the same measurement principle (gold converter and chemilu-minescence) had different inlet configurations. The ECO-Physics instrument operated by ETH-Z¨urich in SPURT had the gold converter mounted outside the aircraft, whereas the instrument operated by FZ-J¨ulich in the European project MOZAIC III (Measurements of ozone, water vapour, car-bon monoxide and nitrogen oxides aboard Airbus A340 in-service aircraft) employed a Rosemount probe with 80 cm of FEP-tubing connecting the inlet to the gold converter. The NOyconcentrations during the flight ranged between 0.3 and
3 ppb. The two data sets were compared in a blind fashion and each team followed its normal operating procedures. On average, the measurements agreed within 7%, i.e. within the combined uncertainty of the two instruments. This puts an upper limit on potential losses of HNO3 in the Rosemount
inlet of the MOZAIC instrument. Larger transient deviations were observed during periods after calibrations and when the aircraft entered the stratosphere. The time lag of the MOZAIC instrument observed in these instances is in ac-cordance with the time constant of the MOZAIC inlet line determined in the laboratory for HNO3.
1 Introduction
Airborne measurements are the only means of obtaining highly resolved information on the distribution of reactive ni-trogen compounds in the upper troposphere and lower strato-sphere. NO and NO2 are key in controlling the
concentra-Correspondence to: A. Volz-Thomas
tion of the OH radical and ozone formation (Crutzen, 1979), whereas measurements of total odd-nitrogen (NOy, i.e., the
sum of NO and its atmospheric oxidation products) have proven useful for studying transport processes and the budget of odd-nitrogen in the troposphere and stratosphere (Keim et al., 1997, and references therein). The measurement tech-nique for NOy(i.e., catalytic reduction to NO on a hot gold
surface followed by chemiluminescence detection of the NO) was pioneered by Bollinger et al. (1983); Fahey et al. (1985). Since then, a large number of ground-based and airborne data sets have been collected. In the course of the interpretation of such measurements, the quality of NOymeasurements using
different kinds of catalytic converters operated under differ-ent conditions was called into question (cf. Crosley, 1996; Brough et al., 2003, and references therein). Potential prob-lems were found with interferences by non-NOycompounds,
e.g. HCN and CH3CN, and with the inlet configuration in
terms of time response or memory, the sampling efficiency for aerosol, and the transmission of HNO3 (cf. Ryerson et
al., 1999), which constitutes the major fraction of NOy in
the lower stratosphere (Neuman et al., 2001). Regular instru-ment comparisons are therefore indispensable for assessing the data quality.
Such comparisons are even more important for the NOy
-instrument deployed in MOZAIC aboard an in-service air-craft of Deutsche Lufthansa in autonomous operation since 2001 (Volz-Thomas et al., 2005). Meanwhile, this instru-ment has been deployed on more than 2000 long-haul flights collecting more than 15 000 h of NOy data. In order to
as-sess the data quality of the MOZAIC instrument and to iden-tify potential problems with the inlet configuration, which is sub-optimal because of the certification requirements on pas-senger aircraft, a blind comparison was conducted between the MOZAIC instrument and a research instrument operated by ETH-Z¨urich (ETHZ) aboard a research aircraft during the last six of eight measurements campaigns in the framework of the German SPURT project (Engel et al., 2006). The
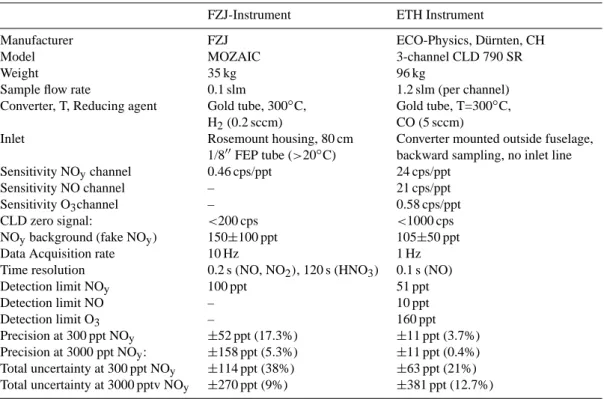
Table 1. Summary of the main characteristics and performance of the two instruments. All errors and detection limits are 2 σ .
FZJ-Instrument ETH Instrument
Manufacturer FZJ ECO-Physics, D¨urnten, CH
Model MOZAIC 3-channel CLD 790 SR
Weight 35 kg 96 kg
Sample flow rate 0.1 slm 1.2 slm (per channel)
Converter, T, Reducing agent Gold tube, 300◦C, Gold tube, T=300◦C,
H2(0.2 sccm) CO (5 sccm)
Inlet Rosemount housing, 80 cm Converter mounted outside fuselage,
1/800FEP tube (>20◦C) backward sampling, no inlet line
Sensitivity NOychannel 0.46 cps/ppt 24 cps/ppt
Sensitivity NO channel – 21 cps/ppt
Sensitivity O3channel – 0.58 cps/ppt
CLD zero signal: <200 cps <1000 cps
NOybackground (fake NOy) 150±100 ppt 105±50 ppt
Data Acquisition rate 10 Hz 1 Hz
Time resolution 0.2 s (NO, NO2), 120 s (HNO3) 0.1 s (NO)
Detection limit NOy 100 ppt 51 ppt Detection limit NO – 10 ppt Detection limit O3 – 160 ppt Precision at 300 ppt NOy ±52 ppt (17.3%) ±11 ppt (3.7%) Precision at 3000 ppt NOy: ±158 ppt (5.3%) ±11 ppt (0.4%) Total uncertainty at 300 ppt NOy ±114 ppt (38%) ±63 ppt (21%) Total uncertainty at 3000 pptv NOy ±270 ppt (9%) ±381 ppt (12.7%)
previous version of the ETH-instrument, which was used during the first two missions, is described in Hegglin et al. (2004). The improved sensitivity and the optimal inlet configuration of the new instrument deployed during SPURT allow for a critical evaluation of the performance of the MOZAIC instrument, including potential losses of HNO3in
the inlet.
2 The instruments
A summary of the main characteristics and performance of the two instruments is given in Table 1.
2.1 The MOZAIC NOy-instrument of FZJ
The MOZAIC NOy-instrument is described in detail by
Volz-Thomas et al. (2005). Briefly, the measurement principle is chemiluminescence of NO with O3 and catalytic reduction
of the different NOycompounds to NO with H2(0.2 sccm)
on a hot gold surface (300◦C). Because of the limitations in gas supply, in particular of H2, for long-term operation (4–
7 weeks), the instrument employs a very low sample flow (90 sccm) and thus has a comparably low sensitivity of 0.4– 0.7 cps/ppt. During MOZAIC operation, the gold converter usually had a conversion efficiency of >95% for NO2 and
HNO3. Other than for the ETHZ instrument (see Sect. 2.2),
the conversion efficiency of the MOZAIC converter is
in-dependent of pressure. This was verified in the laboratory, both for NO2and HNO3, in the pressure range 150–1000 hPa
(Volz-Thomas et al., 2005) and is due to the fact that the con-verter is longer than theoretically required for the flow rate applied. Interferences by N2O, NH3, CH3CN are negligible,
whereas HCN is converted at almost 100% efficiency (Volz-Thomas et al., 2005). The converter is mounted inside the instrument and is connected via 80 cm FEP tubing (1/800OD) to a Rosemount Probe, which provides positive ram pressure and serves as a virtual impactor for separation of atmospheric particles. The inlet line is kept above 20◦C by a heating wire. The inlet configuration during the intercomparison flight was exactly the same as in MOZAIC operation.
2.1.1 Calibration
The instrument was calibrated before and after the flight by diluting the FZJ master calibration standard (10 ppm NO in high purity N2, Air Liquide) with NOy-free zero air (Linde).
The flow rates were measured volumetrically with an auto-matic soap film flow meter (Gillibrator, Gillian USA). The sensitivity for NO remained constant at 460±18 cps/ppb and the conversion efficiency for NO2, as determined by gas
phase titration of the NO by O3was 92±4% (2 sigma), which
is somewhat lower than normally observed in MOZAIC. The overall uncertainty of the calibration from errors in the flow measurements (3%) and the uncertainty of the conver-sion efficiency was UCAL=±6.5% (2 sigma). The conversion
H.-W. P¨atz et al.: NOyinstrument comparison 2403
efficiency for HNO3 was determined before and after the
campaign to 92±5%. During flight, the NOy-background (often denoted as fake NOy) was determined by flushing the
inlet with an excess O2-flow, in the same way as during
MOZAIC operation, whereas calibrations with NO and NO2
were not made during the flight in order to save time for the comparison.
2.1.2 Data treatment and uncertainty assessment
The data were analysed in the same way as during routine op-eration in MOZAIC by interpolation of the automatic zeros of the NO detector. In addition, the average background sig-nal for NOydetermined from the zero air measurements (fake
NOy) was subtracted. The latter was 150±30 ppt (2 sigma)
before the flight. The background determinations during the flight suffered from memory effects of the gold converter due to the long tail of the memory curve for HNO3(Volz-Thomas
et al., 2005). The memory manifested itself by the fact that the background signals were still decreasing at the end of the zeroing intervals and that the remaining signals (370 to 620 ppt) were correlated with the ambient NOy
concentra-tion measured before the zero was initiated. After the flight, the background was 200±35 ppt. The memory for HNO3
leads to a potential overestimation of the instrument’s real background unless the zero air is applied for much longer times than the 5 min employed during the comparison flight. Therefore, the background value of 150 ppt as determined before the flight was used in the data reduction, because this value was assumed to being least affected by memory. The uncertainty of this background value was estimated to
±100 ppt (±67% of the background used as 2 sigma uncer-tainty as in MOZAIC data analysis).
The statistical (2 sigma) precision of an individual 1 s data point was PA=±50 ppt at the detection limit and PR=±5% at the highest NOy concentrations observed. The overall
(2 sigma) uncertainty DNOY (in units of ppt) of an
individ-ual 1 s NOy-measurement was estimated by error
propaga-tion (Eq. 1), including the uncertainties in calibrapropaga-tion and conversion efficiency, UCAL=±6.5% and in the
instrumen-tal background, UB=±100 ppt (all 2 sigma) to
DNOY= ± sqrt((PR2+UCAL2 ) × MNOY2 +PA2+UB2) (1) with MNOY being the NOy mixing ratio in ppt (cf.,
Volz-Thomas et al., 2005). Values for DNOYare given in Table 1
for NOy ambient mixing ratios of 300 and 3000 ppt.
Ex-cept for the highest mixing ratios, the overall uncertainty is dominated by the uncertainty in the background. Potential errors of 2% in the absolute value of the master NO stan-dard are neglected for the instrument comparison because of the excellent agreement with the master standard of ETHZ (<0.5%). We like to note that the performance of the in-strument in terms of sensitivity, background signal and con-version efficiency was comparable to that achieved during routine operation in MOZAIC.
2.2 NOy-, NO-, and O3-measurements by ETH Zurich
2.2.1 The ECO instrument
A commercial 3-channel chemiluminescence detector (790 SR, ECO Physics, Switzerland) for the measurements of total reactive nitrogen (NOy), nitrogen monoxide (NO),
and ozone (O3) was implemented by ETHZ aboard the
Learjet 35A aircraft for the SPURT project. A detailed description of the experimental setup can be found in Hegglin (2004). The measurement principle is based on chemiluminescence between NO and O3. Prior to detection,
the NOy-species are reduced to NO using a heated
gold-converter, controlled at a temperature of 300◦C and using CO (5 sccm, 99.997%, PanGas, Switzerland) as reducing agent (Fahey et al., 1985). The converter is externally mounted on a window blank (Lange et al., 2002). This set-up ensures that the sampled air directly enters the heated gold tube in order to avoid losses of NOycomponents in the
inlet or other potential sampling artefacts. The NOy inlet is facing backwards. NO and O3 are sampled through a
forward facing inlet with a diameter of 6 mm mounted below the converter on the same window blank.
2.2.2 Quality assurance
Instrument sensitivities were determined before and after the flight by mixing known amounts of NO (5 sccm of 10 ppm NO in N2)with synthetic air (1400 sccm, purity 5.0,
Sauer-stoffwerk Lenzburg, Switzerland). In order to maximize the overall measurement time available for comparing the two instruments, no additional in-flight calibrations were carried out. This seemed appropriate since previous SPURT cam-paigns showed that the sensitivity changed only by 1–3% during single flights. Nevertheless, the determination of the sensitivity added a major uncertainty to the ETHZ NOy
-measurements. The NO calibration gas used during the cam-paigns as working standard showed an uncertainty of ±3.7% (2 sigma) to the master standard used in the laboratory. This uncertainty originated from the applied calibration proce-dure. The NO calibration gas was added upstream of the con-verter and, therefore, NOy-species potentially present in the
working standard were also measured and contributed to the derived sensitivity. The additional signal produced by these NOy-species, however, was detected and quantified only
af-ter the campaign leading to the high uncertainty in the con-centration of the used working standard.
The efficiency of the NOy-converter was determined by
gas phase titration of NO with O3before and after the
cam-paign. The conversion efficiency did not change significantly over a time of 7 days and was about 98% at ambient pressures of 960 hPa. The reduction of the efficiency at low pressures during flight is described in the next section.
The O3-channel was calibrated against a commercial
ozone calibrator (Advanced Pollution Instrumentation (API)
Lab calibrations July and August 2003
Lab calibration January 2004
Fit applied to all SPURT data
pressure at converter exit (hPa)
Conver sion effi ci enc y
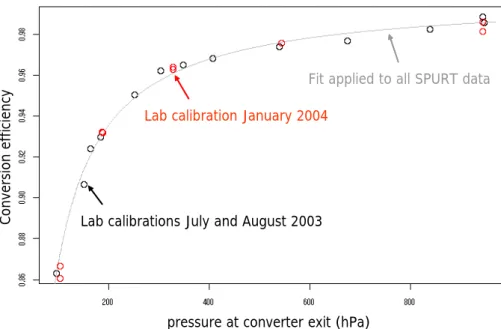
Fig. 1. Conversion efficiency of the ETHZ gold converter for NO2as a function of pressure.
UV photometric ozone calibrator) at the beginning and at the end of the campaign.
2.2.3 Data treatment and uncertainty assessment
The data were processed by linearly interpolating the val-ues of the sensitivities and conversion efficiencies obtained by the calibrations of the instrument before and after the flight to each measurement point. The mean sensitivities of the NOy-, NO-, and O3-channel were 24.0±0.12 cps ppt−1,
22.4±0.2 cps ppt−1, and 580±10 cps ppb−1, respectively.
Besides the zero signal of the CLDs, which is regularly de-termined and subtracted in all three channels, an additional background of 105±50 ppt was subtracted from the NOy
measurement to account for a “fake NOysignal”, most
prob-ably produced by impurities in the CO reduction agent (Fa-hey et al., 1985). This fake NOysignal was determined in
the field before the mission flights using zero air produced by a pure air generator. The in-flight background calibra-tions suffered from a memory effect similar to the MOZAIC instrument and could therefore not be used for these evalua-tions.
The converter exhibits a slight dependence of the conver-sion efficiency on ambient pressure as reported by Lange et al. (2002). We have repeated these experiments by vary-ing the inlet pressure in the laboratory between about 1000 and 100 hPa. As shown in Fig. 1, the conversion efficiency decreases from about 98% at sea level to 92% at a pres-sure of 170 hPa, in agreement with the results by Lange et al. (2002) obtained from in-flight-calibrations. The results were used to determine a pressure dependent correction fac-tor fc for the conversion efficiency ε(p)=fc(p)×ε0, where
fc(p)=1/(0.983+15.323/p−91.0481/p2)as obtained from a
second order polynomial fit of the inverse pressure to the in-verse efficiency shown in the Fig. 1, ε0is the conversion
effi-ciency at 1000 hPa, and p is the pressure inside the converter. At cruise speed this pressure is about 15 hPa lower than the static air pressure due to reverse sampling. The pressure de-pendence of the conversion efficiency can also be derived by using the analytical solution provided by Murphy and Fahey (1987), taking into account the specific converter character-istics.
We like to note that the initial data set submitted after the campaign to the referee (see Sect. 3) had been calcu-lated with an erroneous pressure dependence of the conver-sion efficiency, that had been obtained with an inappropriate experimental setup and showed an apparent drop of the con-version efficiency from 98% at 1000 hPa to 70% at 170 hPa, thus leading to an overestimation of the ETHZ NOydata by
about 25% at the highest altitudes. In the following, we only show the revised data which were calculated with the correct efficiency as shown in Fig. 1.
The conversion efficiency for HNO3 was determined in
laboratory experiments by Lange et al. (2002) using the same converter to be approximately the same as for NO2.
Unfor-tunately the reproducibility of the HNO3experiments using
the ETH system turned out to be much lower than for NO2
mainly due to difficulties in the experimental setup of the HNO3 source. The determination of the HNO3 conversion
efficiency therefore represents the largest uncertainty in the NOymeasurements.
Interferences for HCN, CH3CN, and NH3were analysed
by Lange et al. (2002) for the same type of converter and inlet configuration. Interferences from these species were found to be no larger than 5% resulting in an artefact of probably
H.-W. P¨atz et al.: NOyinstrument comparison 2405 side view: Learjet 35A Spurt_Anordnung SPURT01.DWG 29.01.01 enviscope GmbH Arnoldshainer Str. 5 60489 Frankfurt/Main #7 #6 #8 #5 FISH GHOST II ECO TE49C-E Gase LICOR Gase TRISTAR PC Met Avionik DC / AC Pumpe #11 #14 #13 #12
MOZAIC
ETH
side view: Learjet 35A Spurt_Anordnung SPURT01.DWG 29.01.01 enviscope GmbH Arnoldshainer Str. 5 60489 Frankfurt/Main #7 #6 #8 #5 FISH GHOST II ECO TE49C-E Gase LICOR Gase TRISTAR PC Met Avionik DC / AC Pumpe #11 #14 #13 #12MOZAIC
ETH
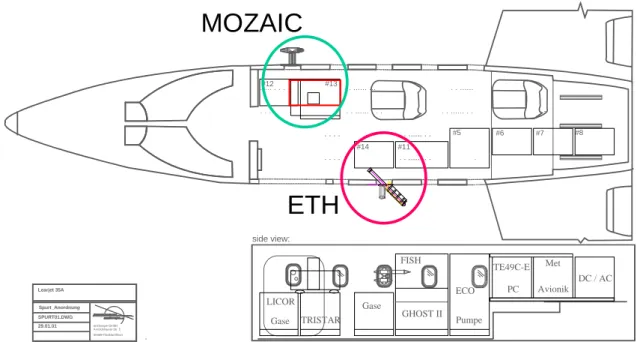
Fig. 2. Installation of the instruments aboard the Learjet during the intercomparison flight within SPURT.
less than 10 ppt in the background troposphere and the low-ermost stratosphere. Interferences to N2O are expected to be
negligible at a converter temperature of 300◦C.
The precision of the NOy-, NO- and O3-channels is less
than 11, 9, and 149 ppt, respectively (2-sigma, 1s averages) at the mixing ratios encountered. The accuracy for the NO channel is determined by uncertainties in the NO calibration gas (4%) and the mass flows of the calibration gas and the synthetic air used for dilution (2%). The accuracy of the NOy-channel contains additional uncertainties in the used
calibration gas introduced by additionally converted NOy
species (3.7%, see explanation above), in the conversion ef-ficiency for different species (in particular for HNO3, 10%),
the reproducibility of the conversion efficiency experiments (3%) and the pressure correction (4%). The total uncertainty of the NOy calibration is UCAL=±12.6%. The overall
2-sigma uncertainty DNOYis given by Eq. (2)
DNOY= ± sqrt(U2CAL×M2NOY+PA2+UB2) (2) with MNOY being the mixing ratio of NOy and with
UCAL=±12.6%, PA=±11 ppt, and UB=±50 ppt. Values for
DNOYare given in Table 1 for NOymixing ratios of 300 and
3000 ppt.
Equation (2) is also used for calculation of the overall uncertainty in the other channels: for NO: UCAL=±4.5%,
PA=±9 ppt; for O3: UCAL=±5%, PA=±149 ppt. 2.3 Installation
The instrument comparison was conducted aboard a Lear-jet 35A operated by GFD for the German AFO2000 project SPURT. Figure 2 gives a schematic view of the instruments
inside the aircraft. The ETHZ instrument was installed at the port side of the Learjet with the NOy-converter mounted
out-side the fuselage of the aircraft. The inlet for the NO and O3
measurements was mounted below the gold converter. The MOZAIC instrument was installed in the front part of the cabin at the starboard side of the aircraft. The Rosemount probe was mounted on a window blank. The configuration of the instrument was exactly the same as in MOZAIC, in-cluding the inlet line.
3 Procedures
The comparison was organised in a blind fashion with Ul-rich Schmidt, University of Frankfurt, acting as an indepen-dent referee. Both groups followed their normal data cali-bration and evaluation procedures, i.e. those applied by FZJ for MOZAIC operation (Volz-Thomas et al., 2005) and by ETHZ during the SPURT project (Hegglin et al., 2006). The primary NO calibration standards of ETHZ and FZJ had been compared before the campaign and disagreed by less than 0.5%. No further exchange of standards took place during the campaign.
The analysed NOy-data were submitted to the referee
be-fore information was exchanged between the two groups. For the first delivery of the data to the referee, the ETHZ NOy-measurements had been calculated with a preliminary pres-sure dependence of the conversion efficiency, which led to an overcorrection of about 25% at the highest altitudes as compared to the correct pressure dependence (Fig. 1) deter-mined by the subsequent laboratory tests. In addition, the sensitivity of the ETH-CLD was corrected by −3.7%, based
Fig. 3. Flight track of the Learjet itinerary and potential vorticity
(PV) on the 220 hPa surface.
Fig. 4. Height profile of the flight and vertical PV-field interpolated
in space and time along the flight track.
on the final evaluation of the working standards used dur-ing the campaign against the ETH master standard that had been compared with that of FZJ. These changes were accom-panied by written statements explaining the reasons and the implications for the data.
4 Results
The comparison flight took place on 29 April 2003 at the end of the 7th SPURT campaign. As shown in Fig. 3, the aircraft flew from Hohn-Airbase near Rendsburg in Northern Ger-many towards Kiruna in Northern Sweden reaching 66◦N, where it turned around at about 03:00 p.m. and flew back to Hohn. The flight profile is shown in Fig. 4 overlaid on a vertical cross section of potential vorticity (PV) calculated from ECMWF data and temporally and spatially interpolated along the flight path. Judging from PV levels, the aircraft en-tered the stratosphere during the first level flight. Thereafter, it descended into the troposphere for 20 min and entered the stratosphere again where it remained until the final descent to Hohn.
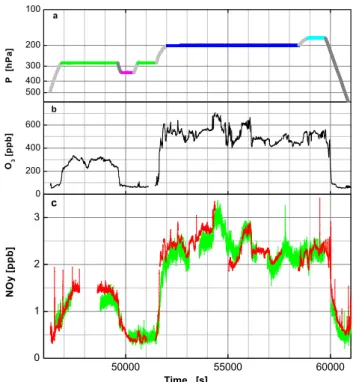
Fig. 5. NOymixing ratios measured by ETHZ (red) and by FZJ
(green) during the intercomparison flight (panel c). Panel (b) shows the ozone mixing ratios measured by ETHZ and panel (a) the pres-sure during the flight. The different colours are used to identify different flight levels as well as ascent and descent.
Figure 5 shows the NOy mixing ratios measured by the
two instruments together with pressure and the mixing ratios of O3measured by ETHZ. The colour coding in the pressure
trace (panel a) identifies flight segments that should contain comparable data in terms of level flights or vertical profiles. This colour coding is used in the following figures to identify data ensembles.
At first sight, both NOy-instruments track quite well, both
for the large changes during transitions between troposphere and stratosphere and for smaller structures. The noise of the MOZAIC instrument is about 5 times larger than that of the ECO Physics instrument, which is in line with the different sensitivities. Also seen is the good correlation between NOy
and O3in the lower stratosphere as observed in other
cam-paigns (cf., Murphy et al., 1993).
Exceptions from the good agreement are seen during the ascend into the stratosphere at 51 500 s, where the MOZAIC instrument significantly lags the ETHZ instrument, which shows a much faster increase in good correspondence with the increase in O3. Interestingly, the corresponding time lag
between MOZAIC and ETHZ is not seen during the final de-scent at 60 000 s.
There are a few further deviations to be noted:
The MOZAIC instrument exhibits a reduced sensitivity af-ter 48 750 s. This is due to the fact that the instrument had
H.-W. P¨atz et al.: NOyinstrument comparison 2407
Fig. 6. Correlation between the NOy-data by ETHZ and FZJ (1 s averages). The colour coding corresponds to the flight segments highlighted
in Fig. 5. Panel (a) shows all data. Panel (b) includes only data that are least affected by memory by excluding profiles (grey points) and the first 5 min after background determinations (black and red points in panel a). The dotted lines indicate the one to one correspondence and the solid lines are linear fits to the data including errors in x and y. The fit for all data (panel a) yields:
FZJ−NOy=(0.94 ± 0.002) ETHZ−NOy + (17 ± 2) ppt; R=0.969 The fit for the data in panel (b) yields:
FZJ−NOy=(0.93 ± 0.001) ETHZ−NOy + (43 ± 3) ppt; R=0.983.
been turned off and restarted several times for unknown rea-sons, possibly by a malfunction of the gear-compressed sig-nal which was simulated by an extersig-nal switch for the com-parison flight. As was seen in the housekeeping data after the flight, the MOZAIC data acquisition system had switched the instrument several times into standby mode, in which the gold converter is being back-flushed to prevent contamina-tion during landing in automatic operacontamina-tion.
Furthermore, both instruments exhibit slightly reduced re-sponses after background determinations, i.e., after periods when the inlets and gold converters were exposed to zero air (ETHZ) or oxygen (MOZAIC) for several minutes.
Figure 6 shows a scatter diagram of the simultaneous NOy
measurements (1 s averages) made by the two instruments. The colour coding refers to the different flight sections indi-cated in Fig. 5a. Data obtained after periods of zero air mea-surements are marked black for MOZAIC and red for ETHZ. A linear fit to all data (panel a) considering errors in both axis gives a slope (FZJ/ETHZ) of (0.940±0.001), an intercept of (17±2 ppt), and a correlation coefficient of R=0.969. The
scatter is dominated by the random noise of the MOZAIC in-strument. Figure 6b shows the same scatter plot for the data remaining after excluding flight sections where the aircraft changed altitude (grey data points) and the data from the first 5 min after zero air measurements in either instrument (black and blue data points). As seen from the linear fit, the thus selected data set exhibits a better correlation (R=0.983). The slope becomes slightly lower (0.93±0.001) and the intercept larger (43±3 ppt).
The average deviation of 6–7% from a slope of unity is within the combined 1 sigma uncertainty in the calibration of the two instruments (±7%). As already noted in Fig. 5, however, larger deviations are observed for the ensembles collected after periods of zero air application to either instru-ment and during the third ascent when the aircraft enters the stratosphere. Here, the MOZAIC instrument lags the ECO instrument significantly, a fact which manifests itself in the light-grey data points in Fig. 6a, which are significantly be-low the regression line. This section of the flight is high-lighted in Fig. 7. While a comparison in form of vertical
profiles, as shown in the left panel, would have suggested very large deviations between the two instruments, the right panel clearly identifies the deviation as caused by the mem-ory of the MOZAIC instrument. The time lag of approxi-mately 120 s corresponds almost exactly to the memory of the MOZAIC inlet line for HNO3that had been determined
before in laboratory tests (Volz-Thomas, 2005).
It is also noted (see Fig. 5), however, that the correspon-dence between the two instruments is much better for the subsequent changes in NOy. It may thus be argued that the
memory is stronger for the first increase in HNO3from the
troposphere with higher humidity (100 ppm, Schiller private communication) and lower HNO3levels, than for changes in
HNO3 occurring in the stratosphere at lower water vapour
mixing ratios (20 ppm).
5 Discussion and conclusions
During the comparison flight, different air masses of tro-pospheric and stratospheric origin were probed covering a broad range of NOymixing ratios for the testing of both
in-struments’ dynamical range. When considering only data from flight sections at constant pressure level and neglect-ing the first 5 min after background determinations, in or-der to exclude data affected by memory of either instrument, the average deviation between the two instruments is 6–7% (ETHZ-FZJ) with an offset of 43 ppt in the FZJ-instrument (Fig. 6b). The significance of this deviation can be judged against the stated uncertainties in calibration and conversion efficiency (the precision term vanishes by averaging over a large ensemble of data pairs). As stated in Sect. 2, these uncertainties are 6.5% for FZJ and 12.6% for ETHZ, yield-ing a combined 2 sigma uncertainty of 14%. Therefore, the average disagreement between the two instruments is equal to the 1 sigma uncertainty of the calibration. Even, when neglecting the 10% uncertainty estimated by ETHZ for the uncertainty in HNO3conversion, because this error term is
actually asymmetric (the efficiency cannot be >100%) and hence would tend to go into the wrong direction, the com-bined 1 sigma uncertainty in calibration would still be 5%.
While this leaves very little room for speculations about the reasons for the deviation, there are a few points to be made:
The discrepancy between the two instruments in the strato-sphere, where 90% of NOy is in the form of HNO3
(Neu-man et al., 2001), limits the possibility for losses of HNO3in
the Rosemount inlet of the MOZAIC instrument to 10% or less. This finding is important because, as discussed in Volz-Thomas et al. (2005), the use of a Rosemount housing as an inlet for NOyis not undisputed in the literature. Obviously,
the design chosen for the Rosemount inlet in MOZAIC has no or very small drawbacks for the sampling efficiency for NOy.
While the memory of the MOZAIC instrument is clearly confirmed by the comparison with the much faster increase in NOyof the ETHZ instruments during the ascent into the
stratosphere (Fig. 7), there is no corresponding time lag be-tween the two instruments during the final descent. One rea-son for this behaviour is that the MOZAIC instrument was measuring zero air during the first part of the descent. How-ever, from the comparison with O3it is suggested that
dur-ing descent the ETHZ instrument suffered from a similar memory as the MOZAIC instrument, because the decrease in ETHZ NOyoccurs much more slowly than the decrease in
O3, whereas during ascent, ETHZ-NOy increases
simultane-ously with O3.
A similar behaviour of the SPURT gold converter has been observed by Lange et al. (2002). A possible explanation is that the memory is only established after the converter has been exposed to high HNO3mixing ratios for some time. A
possible, albeit speculative, explanation is that HNO3is
ad-sorbed at the outer surface of the tip of the gold tube or at the stainless steel surface of the converter housing. While the corresponding effect may not be significant during the fast ascent, it may show up during descent because of the large amount of HNO3that has been absorbed on the outer walls of
the converter during the long time spent in the stratosphere. Consequently, the effect would depend on the time the air-craft has spent in the stratosphere and on the HNO3
concen-trations encountered. It would be quite difficult to quantify this in the laboratory, but would require further dedicated in-flight comparisons.
Both instruments exhibit reduced sensitivities after peri-ods of background determination, i.e., zero air addition to the inlet. The most likely explanation for this behaviour is a memory effect, possibly enhanced by the fact that the zero air contains less water vapour than the ambient air. This effect was only seen because of the otherwise excellent comparison between the two instruments and because both instruments had been operated on the same aircraft so that atmospheric inhomogeneities or time lags between the data sets could be ruled out as possible explanations.
Interferences by HCN, CH3CN and NH3have been found
to be negligible (<5%) for the SPURT converter (Lange et al., 2002). In the MOZAIC converter, NH3and CH3CN are
not converted either (<2%), whereas HCN is quantitatively converted (Volz-Thomas et al., 2005). Singh et al. (2003) found HCN mixing ratios in background air on the order of 100 ppt. Although this concentration is similar to the uncer-tainty arising from the NOybackground in both instruments
(100 ppt for MOZAIC and 50 ppt for ETHZ), the small offset of 43 ppt found in the correlation between the two datasets (see Fig. 6b) could actually be indicative of the different re-sponse of the two instruments to HCN. Aerosol nitrate should not be detected by either instrument as both sampling inlets act as virtual impactors. The ETHZ inlet designed by MPI Mainz discriminates particles with diameters >1 µm (Lange et al., 2002).
H.-W. P¨atz et al.: NOyinstrument comparison 2409
Fig. 7. Blow up of the ascent into and descent from the lower stratosphere between flight levels 380 and 270 (red: ETHZ-NOy, green:
FZJ-NOy). Ozone (black) and NO (blue) are shown for comparison. The left panel shows the ascent data as vertical profiles.
Interference by atmospheric N2O was found to be less
than 3 ppt for the MOZAIC instrument. Although not ex-plicitly investigated for the SPURT converter, it can be con-cluded from the comparison that N2O is unlikely to
consti-tute a significant interference at the converter temperature of 300◦C. Because of its nearly constant mixing ratio, N
2O
would rather produce a constant offset than the observed rel-ative deviation.
In conclusion, the comparison between the two NOy
in-struments led to helpful insight in possible artefacts of the applied measurement systems, which have to be explored in future laboratory and field studies. The generally good agree-ment between the two instruagree-ments, however, shows that the data obtained with both measurement systems provide repre-sentative information about atmospheric composition within the stated uncertainties.
The intercomparison flight covered a large fraction of the dynamic range of NOy mixing ratios encountered in
MOZAIC. On average, 9% of the MOZAIC NOydata are
below 300 ppt and 1.5% above 3.5 ppb, the lowest and high-est concentrations encountered during the intercomparison.
An important finding is the reduced response after zero determination. It requires the discrimination of somewhat longer periods (ca. 5 min) than originally estimated.
The memory for HNO3 as discussed in Volz-Thomas et
al. (2005) was confirmed. The effect will lead to a slight un-derestimation of the NOymixing ratio during transitions into
the stratosphere and a corresponding underestimation during transitions from the stratosphere into the troposphere, thus leading to some reduction in spatial resolution but without bias. The behaviour of the SPURT converter, if confirmed by
future tests, would lead to a small overestimation of tropo-spheric NOy, depending on the time the aircraft has spent in
the stratosphere before descending into the troposphere.
Acknowledgements. We gratefully acknowledge funding for MOZAIC by the European Commission, DG Research and for SPURT by the German Ministry for Education and Research (BMBF) as part of the AFO2000 programme. The ETH contribu-tion to SPURT was funded by a research grant of ETH-Z¨urich and by the Swiss National Science Foundation (SNF). We also kindly acknowledge the expert assistance of the staff of “enviscope” and “GFD” during integration of the instruments and flight operation. Last not least, thanks are due to U. Weers und U. Parchatka for their invaluable technical support during the design and operation of the ETH NOy-instrument, as well as N. Spelten and C. Schiller for information on their H2O measurements during the
intercom-parison flight. Edited by: U. P¨oschl
References
Bollinger, M. J., Sievers, R. E., Fahey, D. W., and Fehsenfeld, F. C.: Conversion of Nitrogen Dioxide, Nitric Acid, and n-Propyl Ni-trate to Nitric Oxide by Gold-Catalyzed Reduction with Carbon Monoxide, Analytical Chemistry, 55, 1980–1986, 1983. Brough, N., Reeves, C. E., Penkett, S. A., Dewey, K., Kent, J.,
Barjat, H., Monks, P. S., Ziereis, H., Stock, P., Huntrieser, H., and Schlager, H.: Intercomparison of aircraft instruments on board the C-130 and Falcon 20 over southern Germany dur-ing EXPORT 2000, Atmos. Chem. Phys., 3, 2127–2138, 2003, http://www.atmos-chem-phys.net/3/2127/2003/.
Crosley, D. R.: NOy Blue Ribbon Panel, J. Geophys. Res., 101, 2049–2052, 1996.
Crutzen, P. J.: The Role of NO and NO2in the Chemistry of the Troposphere and Stratosphere, Ann. Rev. Earth Planet. Sci., 7, 443–472, 1979.
Engel, A., B¨onisch, H., Brunner, D., Fischer, H., Franke, H., G¨unther, G., Gurk, C., Hegglin, M. I., Hoor, P., K¨onigstedt, R., Krebsbach, M., Maser, R., Parchatka, U., Peter, T., Schell, D., Schiller, C., Schmidt, U., Spelten, N., Szabo, T., Weers, U., Wernli, H., Wetter, T., and Wirth, V.: Highly resolved observations of trace gases in the lowermost stratosphere and upper troposphere from the Spurt project: an overview, At-mos. Chem. Phys., 6, 283–301, 2006, http://www.atmos-chem-phys.net/6/283/2006/.
Fahey, D. W., Eubank, C. S., H¨ubler, G., and Fehsenfeld, F. C.: Evaluation of a Catalytic Reduction Technique for the Measure-ment of Total Reactive Odd-Nitrogen NOy in the Atmosphere, J. Atmos. Chem., 3, 435–468, 1985.
Hegglin, M. I.: Airborne NOy-, NO- and O3-measurements dur-ing SPURT: Implications for atmospheric transport, ETH Zurich, Ph.D.-Thesis, 2004.
Hegglin, M. I., Brunner, D., Wernli, H., Schwierz, C., Martius, O., Hoor, P., Fischer, H., Parchatka, U., Spelten, N., Schiller, C., Krebsbach, M., Weers, U., Staehelin, J., and Peter, T.: Trac-ing troposphere-to-stratosphere transport above a mid-latitude deep convective system, Atmos. Chem. Phys., 4, 741–756, 2004, http://www.atmos-chem-phys.net/4/741/2004/.
Hegglin, M. I., Brunner, D., Peter, Th., Fischer, H., Staehelin, J., Krebsbach, M., Schiller, C., Parchatka, U., and Weers, U.: Mea-surements of NO, NOy, N2O, and O3during SPURT:
Implica-tions for transport and chemistry in the lowermost stratosphere, Atmos. Chem. Phys., 6, 1331–1350, 2006, http://www.atmos-chem-phys.net/6/1331/2006/.
Keim, E. R., Loewenstein, M., Podolske, J. R., Fahey, D. W., Gao, R. S., Woodbridge, E. L., Wamsley, R. C., Donnelly, S. G., Del-negro, L. A., Nevison, C. D., Solomon, S., Rosenlof, K. H., Scott, C. J., Ko, M. K. W., Weisenstein, D., and Chan, K. R.: Measurements of the NOy – N2O correlation in the lower
strato-sphere: Latitudinal and seasonal changes and model compar-isons, J. Geophys. Res., 102, 13 193–13 212, 1997.
Lange, L., Fischer, H., Parchatka, U., Gurk, C., and Zenker, T.: Characterization and application of an externally mounted cat-alytic converter for aircraft measurements of NOy, Rev. Sci. In-str., 73, 3051–3057, 2002.
Murphy, D. M. and Fahey, D. W.: Mathematical Treatment of the Wall Loss of a Trace Species in Denuder and Catalytic Converter Tubes, Analytical Chemistry, 59(23), 2753–2759, 1987. Murphy, D. M., Fahey, D. H., Proffitt, M. H., Liu, S. C., Chan, K. R.,
Eubank, C. S., Kawa, S. R., and Kelly, K. K.: Reactive Nitrogen and its Correlation With Ozone in the Lower Stratosphere and Upper Troposhere, J. Geophys. Res., 98, 8751–8773, 1993. Neuman, J. A., Gao, R. S., Fahey, D. W., Holecek, J. C., Ridley,
B. A., Walega, J. G., Grahek, F. E., Richard, E. C., McElroy, C. T., Thompson, T. L., Elkins, J. W., Moore, F. L., and Ray, E. A.: In situ measurements of HNO3, NOy, NO, and O3in the
lower stratosphere and upper troposphere, Atmos. Environ., 35, 5789–5797, 2001.
Ryerson, T. B., Huey, L. G., Knapp, K., Neuman, J. A., Parrish, D. D., Sueper, D. T., and Fehsenfeld, F. C.: Design and initial char-acterization of an inlet for gas-phase NOy measurements from aircraft, J. Geophys. Res., 104, 5483–5492, 1999.
Singh, H. B., Salas, L., Herlth, D., Kolyer, R., Czech, E., Viezee, W., Li, Q., Jacob, D. J., Blake, D., Sachse, G., Harward, C. N., Fuelberg, H., Kiley, C. M., Zhao, Y., and Kondo, Y.: In situ mea-surements of HCN and CH3CN over the Pacific Ocean: Sources,
sinks, and budgets, J. Geophys. Res., 108, 8795 (GTE 16-1–16-14), 2003.
Volz-Thomas, A., Berg, M., Heil, T., Houben, N., Lerner, A., Pet-rick, W., Raak, D., and P¨atz, H.-W.: Measurements of total odd nitrogen (NOy) aboard MOZAIC in-service aircraft: instrument design, operation and performance, Atmos. Chem. Phys., 5, 583– 595, 2005, http://www.atmos-chem-phys.net/5/583/2005/.