HAL Id: hal-00295370
https://hal.archives-ouvertes.fr/hal-00295370
Submitted on 3 Dec 2003
HAL is a multi-disciplinary open access
archive for the deposit and dissemination of
sci-entific research documents, whether they are
pub-lished or not. The documents may come from
teaching and research institutions in France or
abroad, or from public or private research centers.
L’archive ouverte pluridisciplinaire HAL, est
destinée au dépôt et à la diffusion de documents
scientifiques de niveau recherche, publiés ou non,
émanant des établissements d’enseignement et de
recherche français ou étrangers, des laboratoires
publics ou privés.
Intercomparison of aircraft instruments on board the
C-130 and Falcon 20 over southern Germany during
EXPORT 2000
N. Brough, C. E. Reeves, S. A. Penkett, D. J. Stewart, K. Dewey, J. Kent, H.
Barjat, P. S. Monks, H. Ziereis, P. Stock, et al.
To cite this version:
N. Brough, C. E. Reeves, S. A. Penkett, D. J. Stewart, K. Dewey, et al.. Intercomparison of
air-craft instruments on board the C-130 and Falcon 20 over southern Germany during EXPORT 2000.
Atmospheric Chemistry and Physics, European Geosciences Union, 2003, 3 (6), pp.2127-2138.
�hal-00295370�
www.atmos-chem-phys.org/acp/3/2127/
Chemistry
and Physics
Intercomparison of aircraft instruments on board the C-130 and
Falcon 20 over southern Germany during EXPORT 2000
N. Brough1, C. E. Reeves1, S. A. Penkett1, D. J. Stewart1, K. Dewey2, J. Kent2, H. Barjat2, P. S. Monks3, H. Ziereis4, P. Stock4, H. Huntrieser4, and H. Schlager4
1School of Environmental Sciences, University of East Anglia, Norwich, UK
2Meteorological Research Flight (MRF), Atmospheric Chemistry Group, UK Meteorological Office, Bracknell, UK 3Department of Chemistry, University of Leicester, Leicester, UK
4Institute f¨ur Physik der Atmosph¨are, Deutsches Zentrum f¨ur Luft- und Raumfahrt (DLR), Oberpfaffenhofen, Germany
Received: 17 June 2003 – Published in Atmos. Chem. Phys. Discuss.: 15 July 2003
Revised: 28 November 2003 – Accepted: 28 November 2003 – Published: 3 December 2003
Abstract. In the summer 2000 EXPORT aircraft campaign
(European eXport of Precursors and Ozone by long-Range Transport), two comprehensively instrumented research air-craft measuring a variety of chemical species flew wing tip to wing tip for a period of one and a quarter hours. During this interval a comparison was undertaken of the measure-ments of nitrogen oxide (NO), odd nitrogen species (NOy),
carbon monoxide (CO) and ozone (O3). The comparison was
performed at two different flight levels, which provided a 10-fold variation in the concentrations of both NO (10 to 1000 parts per trillion by volume (pptv)) and NOy (200 to over
2500 pptv). Large peaks of NO and NOyobserved from the
Falcon 20, which were at first thought to be from the exhaust of the C-130, were also detected on the 4 channel NOxy
in-strument aboard the C-130. These peaks were a good indica-tion that both aircraft were in the same air mass and that the Falcon 20 was not in the exhaust plume of the C-130. Corre-lations and statistical analysis are presented between the in-struments used on the two separate aircraft platforms. These were found to be in good agreement giving a high degree of correlation for the ambient air studied. Any deviations from the correlations are accounted for in the estimated inaccura-cies of the instruments. These results help to establish that the instruments aboard the separate aircraft are reliably able to measure the corresponding chemical species in the range of conditions sampled and that data collected by both aircraft can be co-ordinated for purposes of interpretation.
1 Introduction
Atmospheric chemistry instruments have improved in the last ten years, moving towards better detection limits of single
Correspondence to: C. E. Reeves
(c.reeves@uea.ac.uk)
parts per trillion by volume (pptv) levels in measurements of compounds such as nitrogen oxides (NO+NO2=NOx) and
the sum of reactive nitrogen compounds (NOy) (Ridley et
al., 2000). Aircraft platforms have added another dimen-sion to the overall chemical picture of the atmosphere but bring with them additional technical and chemical challenges such as inlets, pressure, temperature effects, humidity and in-strument warm up periods. Consequently, inin-strument perfor-mance can often be downgraded on an aircraft platform and it is therefore necessary to qualitatively assess the performance of instruments on such platforms. One way of testing ment performance is by comparison with a similar instru-ment whilst measuring the same air mass. Such comparisons are necessary to establish reliability of instruments allowing quantitative estimates of the accuracy and precision.
Various comparison exercises have been undertaken dur-ing ground-based campaigns, involvdur-ing a range of instru-ments, (e.g. Williams et al., 1998; Fehsenfeld et al., 1990; Zenker et al., 1998) at various sites throughout the world. Aircraft comparisons on the other hand, have been performed far less frequently (e.g. Ridley et al., 1988; Ziereis et al., 1990) and have involved atmospheric instruments that
mea-sure NO, NOy, carbon monoxide (CO) and ozone (O3).
Although aircraft campaigns over the last 20 years have increased in frequency, instrument performance especially when considering a NOxy instrument, is found to be poorer
than similar ground based field deployment owing in the main to the short period (4 h or less) of instrument warm-up and therefore stabilisation. Many aircraft campaigns have therefore taken place without knowing the true precision, ac-curacy and capabilities of the instrument on the particular flight. The more instruments involved in comparisons the better the instrument integration, as can be clearly seen in the ground-based study by Williams et al. (1998) in which seven NOyinstruments were compared.
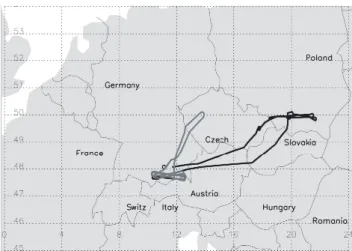
Fig. 1. Flight paths of the DLR Falcon 20 (light grey) and the MRF
C-130 (dark grey) on 10 August 2000. The intercomparison legs
were flown along a straight track between 47.97◦N, 12.67◦W and
47.63◦N, 12.39◦W.
To obtain a good instrument comparison it is advisable that the mixing ratios of the compounds to be measured are not consistently near to the detection limits of the instruments, as this can result in erroneous statistical analysis. However, it is important to test instrument behaviour through intercompar-ison exercises at both high and low ambient mixing ratios. A variety of structures within the air mass to be measured are preferred to ensure that there is a high degree of dynamic variability giving large changes in concentration on all instru-ments. On the ground, changes in the wind direction help to vary the air parcel concentrations and assist in obtaining a large dynamic concentration range. In an aircraft, this can usually be achieved by changing the aircraft altitude since much of the troposphere is very stratified with narrow lay-ers of different chemical composition, in particular the wa-ter vapour concentration (Newell et al., 1996; Penkett et al., 1995). The work in this paper describes the comparison of five different instruments onboard two different aircraft dur-ing the EXPORT campaign of August 2000.
2 Experimental
Aircraft measurements of important atmospheric
con-stituents namely, CO, NO, NOy and O3 were measured
in-situ and simultaneously onboard two separate aircraft Deutsches Zentrum f¨ur Luft- und Raumfahrt (DLR) Falcon 20 and the Meteorological Research Flight (MRF) C-130). The aircraft were based at the DLR, Oberpfaffenhofen air-port in southern Germany during August 2000 and took part in the EXPORT (European eXport of Precursors and Ozone by long-Range Transport), project. The EXPORT program consisted of a series of flights under a range of synoptic con-ditions designed to characterise the chemical composition of air over Europe and to quantify the potential of
precur-sors exported from Europe to produce O3downwind.
Stan-dard instrumentation such as the meteorological parameters (static pressure, wind direction and speed, air temperature, dew point temperature, total water content, etc) were mea-sured on the MRF C-130 as detailed by Hov et al. (2000). The comparison flight took place on 10 August 2000 and the flight details are shown in Fig. 1.
Most instruments were similar in their methods of
detec-tion. NO and NOy used detection by chemiluminescence
of NO and O3, CO by vacuum-UV resonance fluorescence
(Gerbig et al., 1996, 1999) and O3was measured by UV
ab-sorption.
On the ground, pre-flight calibration comparisons were
performed for the two NO and NOy instruments.
Calibra-tions were first performed with individual compressed gas NO standards and then these were cross-referenced with each other’s standard. The calibration gases varied in concen-tration and were described by the manufacturers (see later) to be 1.01±0.01 parts per million by volume (ppmv) and 3.5±0.2 ppmv. It was found that the accuracy of the instru-ments to the different calibration gases was within 3%, show-ing that on the ground at least, the instruments were able to measure the same mixing ratios. Since the C-130 NOxy can
only operate up to an altitude of 9000 m before sample flow problems (Bauguitte, 2000) are encountered the intercom-parison portion of the flight was therefore carried out at alti-tudes of ca. 8000 and ca. 6000 m with the assumption that we would obtain air of different compositions during this period. Rendezvous of the two aircraft was at the higher altitude and at a position over southern Germany (47◦N, 12◦E). The two aircraft flew as close to each other as safety permitted. The horizontal and vertical separation was estimated to be of the order of 70 and 5 m respectively and was held for a period of 1.25 h at an indicated aircraft speed (IAS) of 180 knots moving through 410 km of air (dependent on wind speed and direction). At the conclusion of the first leg at the pressure altitude of 8000 m (40 min), the aircraft was manoeuvred into a slow descent to an altitude of ca. 600 m. This lower flight level was maintained for a further 30 min until both aircraft broke from the formation. The intercomparison legs were flown along a straight track between 47.97◦N, 12.67◦W and 47.63◦N, 12.39◦W with three turns and time was allowed at specified periods throughout each leg for the relevant in-strument zeros and calibrations. During the comparison no clouds were encountered at the relevant flight levels; broken stratocumulus was observed beneath the aircraft and the sky was clear above. All instruments that were involved with the intercomparison appeared to function correctly and there was no verbal in-flight discussion of concentration profiles.
2.1 NO, NOymeasurements by the University of East
An-glia (UEA) on the C-130
Measurements of the oxides of nitrogen on the C-130 were obtained by chemiluminescence pioneered by Kley and
Mc-Farland (1980) and the light produced measured by a cooled, red sensitive photomultiplier tube (PMT) (H¨ubler et al.,
1992; Drummond et al., 1988). Detection of NO was
achieved by sampling air at 1 L min−1 at standard temper-ature and pressure (STP) from a rear facing stainless steel tube (to help exclude aerosols of radius >1 µm) lined with 1/400(6 mm outside diameter) PFA (Perfluoroalkoxy) which was outside the pressure boundary of the aircraft layer and forward of the propellers. The sampled air was mixed with humidified O3 on entering the gold plated reaction vessel.
NOydetection was achieved by reducing it to NO using CO
as a catalyst (0.3% v/v) in gold tubes which were 35 cm in length with an inner diameter of 5 mm and maintained at 300◦C (Fahey et al., 1985). The sampling inlet used for NOymeasurements was made of perfluroalkoxy (PFA) teflon
and enclosed in a tear drop shaped assembly connected to the aircraft skin situated perpendicular to the direction of flight. The inlet and its orientation was specifically designed
to minimise NOy loss and consequently had a low-volume
permitting fast sampling (Ryerson et al., 1999). It was heated to 75◦C which also helped to reduce potential HNO3 wall
losses (Neuman et al., 1999) before the 1 L min−1STP sam-pled air reached the heated converter. The response speed of the converters was faster than 1 cps (counts per second). All overflow and calibration gases entering the NOysystem
passed through the inlet.
Four calibrations of the two detectors were performed, one each, pre and post flight as well as two in-flight using a stan-dard concentration of NO in N2 (BOC specialty gases) of
1.01±0.01 ppmv. Stable air masses in which no clouds were present and NO and NOy varied little were sought over the
calibration period (10–15 min) and were often found in free tropospheric air above 4000 m. The NO standard was di-luted into the 1 L min−1STP sample air stream at a rate of 3 cm3min−1STP by means of a mass flow controller (Tylan) yielding a resulting mixing ratio of 3.3 ppbv NO. Linear in-terpolations between the in-flight calibrations were used to provide minimal error. NO2 calibrations on the NOy
con-verter were made by photolysing zero grade air, producing O3, which reacted with the NO calibration gas to obtain a
90% conversion to NO2. The sensitivity of the NO channel
was 6.1±0.1 cps pptv−1 and for the NO2sensitivity on the
NOychannel was 3.4±0.2 cps pptv−1. The conversion
effi-ciency of HNO3 to NO in the gold converters occurs with
an efficiency greater than 90% in the UEA instrument, under the same conditions there is no detectable conversion of N2O
to NO. Ammonia is converted with an efficiency of <5% in this system and the conversion of HCN occurs with an effi-ciency of 8% in totally dry air but these efficiencies decrease substantially with relative humidity. The DLR group have performed conversion efficiency tests on their NOyconverter
for HCN, N2O, CH3CN and NH3. Of these only HCN was a
possible source of interference of around 2% under the con-ditions of the intercomparison.
When zeroing, instead of the O3being added directly into
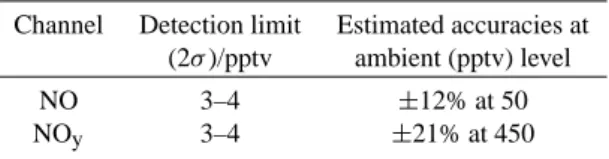
Table 1. Detection limits (2σ ) and estimated accuracies of the UEA
NOxysystem for 10 s data.
Channel Detection limit Estimated accuracies at
(2σ )/pptv ambient (pptv) level
NO 3–4 ±12% at 50
NOy 3–4 ±21% at 450
the reaction vessel as in the measurement mode, a relaxation volume (Pyrex bottle of 250 ml volume) was used. In this case, the O3was added to the sample matrix prior to
injec-tion into the gold plated reacinjec-tion chamber and NO2
chemilu-minescence occurs away from the photomultiplier tube. The resulting background or zero signal was a combination of the photomultiplier dark counts and interference from stray chemiluminescence of atmospheric species and catalysed re-actions on the chamber walls (Drummond et al., 1985). The background signal was found to be 400±7 cps for NO, and 280±9 cps for NOyand was performed at the beginning and
end of every flight level for a period dependant on the instru-ment performance but usually between 90 and 120 s.
Artifacts, which are the difference between the measured and zero signal mode when there is supposedly no nitro-gen oxide present were performed during take-off and land-ing by overflowland-ing the sample lines with 2 L min−1STP of
synthetic zero grade compressed air (BOC, British Oxygen
Company). These two measurements were averaged and
found to be of the order, 15±9 cps and 212±20 cps, for NO and NOyrespectively. Conversion efficiency of the NOy
con-verters using NO2as a surrogate were found to be >90% for
both in-flight measurements.
Detection limits (LOD) were estimated using the 1σ counting precision of the 1 cps zero background signal which was assumed to represent the detection limit (see Ridley et al., 1994) as there are no suitable invariant ambient data. Us-ing the correspondUs-ing NO2 sensitivities (NO sensitivity ×
conversion efficiency), the standard deviations of the zero data for the other channels (cps) were transformed to pptv and it can be assumed that when the data is averaged to 10 s the LOD would improve by√1
10. The 2σ detection limits are
shown in Table 1. Data were collected at 1˙cps intervals for all channels but were averaged to 10 s owing to other instrument parameters.
The major contributor to the inaccuracy for each detector was the instrument artifact signal. The sum of the inaccuracy and imprecision of a single measurement gives the overall uncertainty of the instrument. Estimated accuracies were ac-counted for as: (1) Uncertainties in the flow meter calibra-tions for the sample and calibration gas flows of 4% (a bub-ble flow meter was used to calibrate pre and post campaign). (2) Calibration of the gas standard uncertainty based upon the intercomparison with the DLR standard (3 ppmv NO in
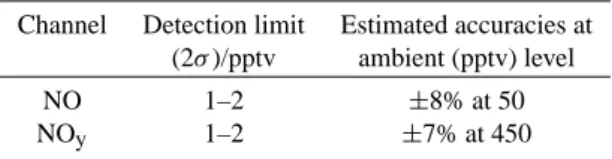
Table 2. Detection limits (2σ ) and estimated accuracies of the DLR
NO and NOysystem for 10 s data.
Channel Detection limit Estimated accuracies at
(2σ )/pptv ambient (pptv) level
NO 1–2 ±8% at 50
NOy 1–2 ±7% at 450
N2) of 3%. (3) Average measured artifact uncertainty for the
flight. The accuracy of the UEA instrument is comparable to the reported inaccuracies in similar instruments, for example Williams et al. (1997) quote estimated inaccuracies of 19% in NO and 15% in NOyand Parrish et al. (1993) quote an
inaccuracy of 15% in their NOydata. Using a similar
tech-nique with a molybdenum catalyst Stehr et al. (2000) report an inaccuracy in their NOymeasurements of 30% and Kondo
et al. (1997) quote an error of 12% in NO at 50 pptv and 27% in NOyat 100 pptv.
Variability of the sensitivities was shown on all UEA NOxy
channels during this flight and is known as the precision of the instrument. The scatter (1σ ) that was exhibited between the two in-flight sensitivities was 1.89% for NO (lower than that expected on the basis of instrument diagnostics) and 14.1% for NO2sensitivities on the NOychannel. These high
values for the NOychannel was mainly due to rapid changes
during calibration of the ambient NOylevels leading to
over-estimated calibration averages as well as systematic contam-ination owing to large pollution episodes experienced by the NOyconverter leading to a reduced sensitivity post flight.
2.2 NO and NOymeasurements by DLR instruments on the
Falcon 20
The technique for the measurement of NO and NOyon board
the Falcon 20 is quite similar to that one used on the C-130 as mentioned previously. A two-channel chemiluminescence detector for NO was used allowing the simultaneous detec-tion of NO and NOy. NOy was measured by the catalytic
conversion technique already mentioned above. There are
only a few differences between the NO and NOy
measure-ments on the two aircraft. The DLR chemiluminescence de-tector is operated with a sample flow of 1.5 L min−1at STP. Sampling occurs through a rear-facing inlet to avoid sam-pling of large aerosol particles onto the NOyconverter. All
sampling lines are made of PFA and are heated to about 30– 40◦C. The gold tube used on the NO
yconverter during
EX-PORT was 60 cm long with an inner diameter of 4 mm. A CO reducing agent was added upstream of the converter at 3 cm3min−1STP.
Sensitivity checks of the two NO detectors were deter-mined before and after each flight by adding a standard con-centration of NO in N2. The NO-standard was diluted into
the NO-free zero air by means of a mass flow controller. Usu-ally four different NO mixing ratios were used between 1 and 8 ppbv. The sensitivity of the two NO-channels was 21 and 18 cps pptv−1. The background signal of the two NO detec-tors were determined in a similar way as described previously on the C-130. The background signal was determined every 10 min for about 1 min. It was about 1000 cps in both chan-nels.
The conversion efficiency of the gold converter was checked before and after each flight by adding known amounts of NO2produced by gas phase reaction of NO with
O3. The conversion efficiency did not vary significantly
dur-ing the campaign and was close to 100%. Zero air artifacts were also determined, in a similar way as described for the UEA instrument, before and after each flight and also during the flights itself. The zero air artifacts for NO and NOywere
of the order of 3±1 pptv and 28±6 pptv, respectively. Owing to space limitations on the FALCON 20, which is a smaller aircraft, no sensitivity checks could be performed during the flights. The detection limits and estimated accuracies of the instrument are shown in Table 2.
2.3 Ozone measurements by UKMO on the C-130
A commercial instrument was used to measure O3(Thermo
Environmental Instruments Inc. model 49 U.V. Photomet-ric Ozone Analyser) on the C-130. It has been modified with the addition of a drier and separate pressure and tem-perature sensors. The inlet from the port air sample pipe is pumped via a buffer volume to maintain the inlet air at near surface pressure. All surfaces in contact with the sample in-cluding the pump are of Polytetrafluoroethylene (PTFE) or PFA. The instrument has a range of 0–2000 ppbv, a detec-tion limit of 1 ppbv and a linearity of 2% (as stated by the manufacturer). The data are sampled with a frequency of 1 cps then smoothed over a 5 s period. The calibration is car-ried out annually against a traceable standard from the Na-tional Physics Laboratory (NPL). Biannual checks are car-ried out locally against a transfer standard (DASIBI). The calibrations have consistently shown the repeatability of the instrumental method. No discernible drift (less than 2%) was found between calibrations. Hence an accuracy of 2% is expected from the calibration with an NPL guarantee of less than 1% on the precision. Laboratory experiments have shown no discernible loss of O3on inlet lines (i.e. less than
1%).
After the EXPORT campaign it was discovered that there was a problem with the recording of the temperature sensor data on the C-130 O3instrument. A total of 40 flights,
pre-EXPORT and post-pre-EXPORT, where temperature data was recorded, were analysed. The ozone temperature and pres-sure are recorded, in order to normalise for changes in sam-ple mass, as the samsam-ple is not kept at a constant pressure and temperature. The temperature was found to vary by only 12 K (1): from 304 to 316 K. A whole range of flights were
studied from winter to summer, from low level to high level, from the Azores to the Arctic, via, Tenerife, Greece, Austria, Germany and the UK. Most flight data taken as represen-tative of European summer conditions varied between 306 and 312 K. Hence, 309 K was chosen to represent the sample temperature for all of the EXPORT flights. With 309 K as the mid-point, it is most likely that the temperature will only vary by ±3 K during flight i.e. the O3precision and accuracy will
vary by ±1%. However, erring on the side of caution, if the temperature variation is equal to the largest range found (304 to 316 K) the error on the O3reading would be ±2%. Even if
the temperature varied from 309 K by ±12 K (i.e. from 297– 321 K), which is most unlikely, considering the existing good data, the error would still only be ±4%. Considering all pos-sible sources of error the O3data is good to within ±5% or
better.
2.4 Ozone measurements by DLR on the Falcon 20
O3was also measured using an UV absorption photometer
(Thermo-Environmental, Model 49). Sampling and detec-tion of O3occurs at ambient pressure through a rear-facing
inlet at a frequency of 0.25 cps. Inlet and inlet lines were made of PFA. Separate pressure and temperature sensors measured pressure and temperature inside the O3analyser.
The data were sampled at 1 cps but smoothed over a 4 s pe-riod.
The sensitivity of the UV absorption photometer was checked several times during the EXPORT campaign with an O3 standard source (Environment s.a. Model O3 41M).
No significant variation of the sensitivity of the O3
instru-ment was found during these calibrations. The O3standard
source was compared with O3UV absorption measurements
at the global watch station at Hohenpeißenberg, Germany. The analyser has a range of 0–1000 ppbv and a detection limit of about 1 ppbv. The major contributor to the uncer-tainty of the detector is the accuracy of the signal output of the instrument. As the accuracy of the signal output remains constant the uncertainty of the instrument increases with de-creasing pressure in the absorption cell. During the compari-son the overall uncertainty of the O3analyser was between 4
and 5%.
2.5 Carbon monoxide measurements by UKMO on the
C-130
A detailed description of the CO instrument on the C-130 can be found in Gerbig et al. (1999). It consists of three principle components: a resonance excitation source, an optical filter, and a sample fluorescence detection cell. The appropriate wavelength interval for the excitation light around 150 nm is selected in an N2purged optical filter consisting of two
di-electric coated mirrors in combination with two CaF2lenses,
which image the lamp into the fluorescence chamber.
Fluo-rescence of CO is detected with a PMT at right angles to the excitation radiation.
The sample gas is taken from the starboard air-sampling pipe (ASP) which is pressure regulated and allows operation at ambient pressures between 1013 and 175 mbar. The con-nection to the ASP is by a PFA tube with 1/800 OD and a length of about 15 m. The sampled air is dried by passing it over Drierite (CaSO4with humidity indicator) to avoid
inter-ference of atmospheric water vapour owing to absorption of the fluorescence radiation (a mixing ratio of 2% H2O causes
a decrease in the fluorescence signal of 10%).
In-situ calibration of the instrument is accomplished by injecting a known standard (515 ppbv of CO in air), at flow rates slightly higher than the sample flow rate, into the sam-pling line close to the control valve. For determination of the background signal, the calibration standard is passed through a Hopcalite scrubber, which quantitatively removes the CO to levels <1 ppbv. In-flight calibrations and zeros lasting roughly 4 min were performed approximately every 30 min. The sensitivity was found to be 31 cps ppbv−1, which is less than half the sensitivity for this instrument quoted by Hol-loway et al. (2000) (73 cps ppbv−1). The instrument back-ground was found to be 55 ppbv (in equivalent CO ppbv units). Hence, following the analysis of Gerbig et al. (1999), the instrument detection limit is smaller than 6 ppbv and the precision 1.5 ppbv. The instrument has also been shown to give a linear response from 0 to 100 ppmv and has a time resolution of 1 s. An aircraft instrument intercomparison has been conducted previously by Holloway et al. (2000), show-ing good agreement between the C-130 instrument and a VUV fluorescence instrument on board the US NOAA WP-3 aircraft.
2.6 Carbon monoxide measurements by DLR on the
Fal-con 20
The DLR CO instrument operated on the Falcon 20 is nearly identical to that one used on the C-130. There are only some minor differences in the two instruments. In the DLR CO in-strument the optical filter system is purged by argon instead of nitrogen and the instrument can be operated to less than 100 mbar. The sample gas is taken from an air inlet at the top of the fuselage and is passed through a sampling line made of stainless steel with 1/800OD and length of about 1 m. The sampled air is dried by a Perma Pure MD Gas Dryer™. In-flight calibration of the instrument is performed by injecting a known standard (∼1 ppmv) into the sampling line. Detec-tion limit, precision and time response is the same for both instruments. The DLR CO instrument has a linear response from 0 to 1000 ppmv.
1600 1400 1200 1000 800 600 400 200 0
DLR and UEA NO, NOy Mixing Ratios. pptv
13:15 10/08/00
13:30 13:45 14:00 14:15 14:30
Time (Greenwich Mean Time, GMT)
8000 6000 4000 2000 0 Altitude (Metres) DLR NOy DLR NO Altitude MRF (UEA) NO MRF(UEA) NOy 1 2 3 4
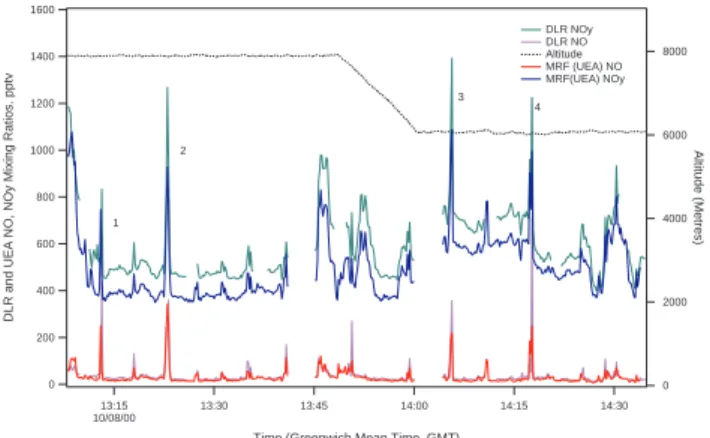
Fig. 2 The mixing ratios for NO and NO observed at altitudes between 6000 and 8000 m, during the
comparison on the 10/08/00 over southern Germany. The data sets have been averaged to 10 seconds from 1-s raw data and any gap1-s in the data are due to in1-strument zeroing or aircraft re-po1-sitioning.
y
Fig. 2. The mixing ratios for NO and NOyobserved at altitudes
between 6000 and 8000 m during the comparison on the 10 August 2000 over southern Germany. The data sets have been averaged to 10 s from 1 s raw data and any gaps in the data are due to instrument zeroing or aircraft re-positioning.
3 Results and discussion
3.1 NO and NOymeasurements
The data from the aircraft were placed on the databases at British Atmospheric Data Centre (BADC) and DLR for the UK and German contingents respectively. The C-130 and Falcon data sets (Fig. 2) were averaged to 10 s from 1 s raw data for both NO and NOy. The air mass encountered for
most of the time had little variation in the NO and NOy
con-centrations (less than 0.2% NOymixing ratio values greater
than 1000 pptv) although large increases were observed in
the NO and NOy instruments aboard both aircraft. These
large increases in mixing ratios are referred to as spikes and usually lasted from a second to tens of seconds.
Large changes in the NO and NOy mixing ratios were
recorded owing to the interception of polluted plumes almost certainly originating from aircraft. These large rapid changes were encountered four times and were observed on both the
DLR and UEA NO and NOy channels, two at each flight
level, giving half widths ranging from between 8 and 48 s. At an indicated aircraft speed of 180 knots this would give plumes widths of between 0.7 km and 4.3 km if flying into the plume at 90◦to the long axis of the plume. The sharp peaks (labelled 1 to 4 in Fig. 2) were between 400 and 1000 pptv (1 s data with background averages of 20 pptv) on the NO instruments and between 1000 pptv and 2600 pptv (1 s data with background averages of 500 pptv) on the NOy
instru-ments. Increases as large as 50 fold from the background air-mass mixing ratios were observed. The total increase in the NOyduring these episodes cannot be fully accounted for
by the increase in the NO mixing ratios. As the spikes oc-curred on both NOyinstruments as well as the NO channels
it can be assumed that they are elevated concentrations of NO as well as other NOyspecies and not an instrument
irregular-ity observed on one channel owing to either static discharge or cosmic rays.
DLR measurements, on average, gave systematically higher apparent values than those of UEA (26 pptv versus 20 pptv for NO and 555 pptv versus 467 pptv for NOy) for
10 s NO and NOy data. The scatterplots of NO and NOy
(Figs. 3.1 and 3.2) display the mixing ratios with and with-out the spikes present in the data sets. This includes all the prominent peaks labeled 1, 2, 3, 4 in Fig. 2 as well as other sharp peaks greater than 100 pptv. Linear least squares fit-ting was applied to the data using a weighted bivariate re-gression routine (Neri et al., 1989). The inverse of the un-certainty of each data point was used as the weighting factor and 2σ confidence limits are given with the regression co-efficients. Figures 3.1a and 3.2a show the scattergram plots without the spikes of the NO and NOy respectively with a
one to one line. Without the spikes the data sets for the NO instruments are highly correlated, a least squares fit corre-lation (r2) of 0.91 was observed. The slope was close to unity (1.10±0.10) signifying a 10% difference in the mixing ratios of the two separate instruments. This observation is because of the differing NO sensitivities between the instru-ments and falls within the 12% uncertainty (12% at 50 pptv) of the UEA NO instrument. An intercept on the y-axis of just 3.8±0.2 pptv suggests that there is a small systematic offset on the UEA technique and is most likely due to an instrument artifact problem. Examination of the NOydata sets with the
peaks removed showed a high correlation (r2) of 0.97 with a slope of 1.17±0.06. This 17% difference is well within the 22% combined uncertainty of the two instruments obtained by addition in quadrature. This suggests that no substantial unknown sources of error exist in either measurement. The intercept was again in the positive sector of the DLR data at 18.8±0.3 pptv, corresponding to 3–7% since most mea-surements were made in the 500–1000 pptv range. The tight correlation shown in both the NO and NOyplots (Figs. 3.1a
and 3.2a) suggests that the instruments are in good agreement over the comparison period.
When the peaks are present (Fig. 3.1b and 3.2b) there are a few points that are scattered far from the line of best fit and
r2was calculated as 0.81 for the NO data sets. A positive slope somewhat greater than unity (1.29±0.03) with a small positive systematic offset of 1.2±0.1 pptv was also found. This positive slope was about 19% greater than the NO data set with the peaks removed. Fitted slopes to the NOydata
were higher with the peaks present, 1.22±0.01 as compared to 1.17±0.06, and an intercept of −5.9±0.2 pptv as shown in Fig. 3.2b. The correlation of 0.96 was roughly the same as the “spike-less” data (0.97) and was closer to one than pre-viously obtained with the NO instruments indicating that the NOyspikes were in better agreement. The positive intercepts
on Figs. 3.1b and 3.2b were relatively small, showing good instrument correlations at low mixing ratios. This poorer comparison of the data including the spikes is more likely to be due to sampling slightly different air (aircraft spatial
400 300 200 100 0 DLR, NO Mixing Ratios, pptv 400 300 200 100 0
University of East Anglia, NO Mixing Ratios, pptv
b slope = 1.29 (± 0.03) intercept = 1.2 (± 0.1) pptv r2 = 0.81 100 80 60 40 20 0 DLR, NO Mixing Ratios, pptv 100 80 60 40 20 0
University of East Anglia, NO Mixing Ratios, pptv
a
slope = 1.10 (± 0.10) intercept = 3.8 (± 0.2) pptv r2 = 0.91
Fig. 3.1 Scattergram of all 10 second averaged NO mixing ratios, DLR versus UEA, (a) All spikes removed.
(b) All data. Solid black lines in each plot show the bivariate linear regression fit to the data. The dashed line in each plot gives the one to one correspondence.
Fig. 3. 1. Scattergram of all 10 s averaged NO mixing ratios, DLR versus UEA, (a) All spikes removed. (b) All data. Solid black lines in
each plot show the bivariate linear regression fit to the data. The dashed line in each plot gives the one to one correspondence.
1500
1000
500
0
DLR, NOy Mixing Ratios, pptv
1500 1000 500
0
University of East Anglia, NOy Mixing Ratios, pptv
b slope = 1.22 (± 0.01) intercept = -5.9 (± 0.2) pptv r2 = 0.96 1500 1000 500 0
DLR, NOy Mixing Ratios, pptv
1500 1000 500
0
University of East Anglia, NOy Mixing Ratios, pptv
a
slope = 1.17 (± 0.06) intercept = 18.8 (± 0.3) pptv r2 = 0.97
Fig. 3.2 Scattergram of all 10 second averaged NO mixing ratios, DLR versus UEA, (a) All spikes removed.
(b) All data. Solid black lines in each plot show the bivariate linear regression fit to the data. The dashed line in each plot gives the one to one correspondence.
y
Fig. 3.2. Scattergram of all 10 s averaged NOymixing ratios, DLR versus UEA, (a) All spikes removed. (b) All data. Solid black lines in
each plot show the bivariate linear regression fit to the data. The dashed line in each plot gives the one to one correspondence.
arrangement), or slightly different temporal resolution of the two instruments than to instrument performance, which on the ground has been shown to be in close agreement. The spikes are clearly real plumes and are narrow; thus the ob-served concentrations on the two aircraft are likely to be dif-ferent given their spatial arrangements.
Although the NOy measurements of the two instruments
are in agreement within the uncertainties of the measure-ments, the systematically higher values of the DLR instru-ment (∼90 pptv at 500 pptv) are such that care will have to be taken in using these measurements in the interpretation of “missing NOy” especially in light of the recent report of Day
et al. (2003).
3.2 CO and O3measurements
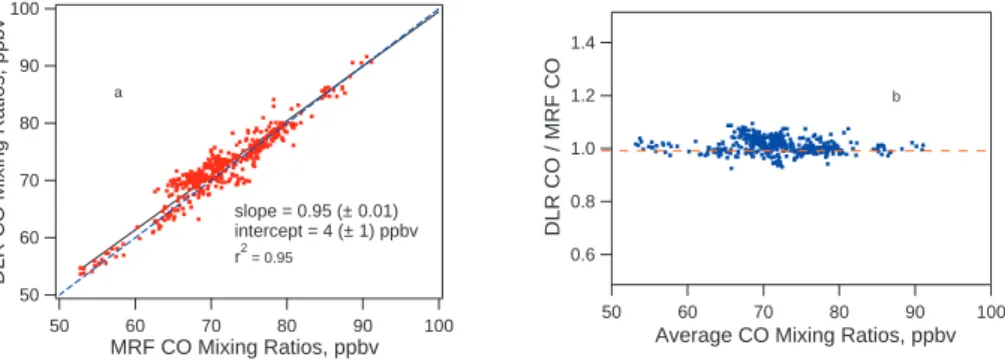
Only coincident data were used providing 433 points and corresponding to 90% coverage for the CO and 455 points and 89% coverage for the O3. The scattergram plot of the
CO instruments with a corresponding one to one line and a weighted bivariate linear regression line fit is displayed in Fig. 4a. As displayed most data points are clustered around the two lines indicating that the data sets are in close agree-ment. This close proximity of the data sets is further vali-dated by the high squared root correlation coefficient of 0.95. Although the CO data sets were in fairly close agreement and within their respective accuracies for the whole
com-parison period the slightly higher bivariate linear regression line at the lower concentration (50–70 ppbv) levels indicated that there was a systematic difference between the two in-struments. In particular, the MRF CO instrument revealed a significant increase in CO from 68 to 75 ppbv just after 13:33 GMT that persisted for ca. 3 min (Fig. 6). It was clearly not observed by the DLR instrument and would appear to in-dicate real variations in ambient CO since good agreement was obtained for the rest of the comparison period, although short term instability in one or other of the instruments can-not be fully ruled out during this period. Examination of the data sets for the first 30 min period gave a low slope gradient (0.68±0.01) and poor correlation; r2=0.76. Air mass sam-pling differences due to the spatial arrangement of the aircraft is the most likely cause since in the latter half of the compar-ison the data sets are in excellent agreement (r2=0.97). Low correlations (r2) over this initial 30 min period was also ob-served with the O3data sets, 0.44 as compared to 0.96, and
shall be discussed in more detail later. From the CO scatter-gram plot of Fig. 4a, the systematic difference is evident in the fitted line parameters, the associated uncertainties of the slope was 0.95±1 ppbv, which is about 5% from unity. This level of systematic difference was also found with the inter-comparison by Holloway et al. (2000) of a CO VUV fluo-rescence instruments and a TDLAS simultaneously operated and intercompared for CO on the NOAA WP-3 and the one used in this intercomparison aboard the MRF C-130 over the
100 90 80 70 60 50 DLR CO Mixing Ratios, ppbv 100 90 80 70 60 50 MRF CO Mixing Ratios, ppbv a slope = 0.95 (± 0.01) intercept = 4 (± 1) ppbv r2 = 0.95 1.4 1.2 1.0 0.8 0.6 DLR CO / MRF CO 100 90 80 70 60 50
Average CO Mixing Ratios, ppbv
b
Fig. 4 Scattergram of DLR versus MRF CO mixing ratios shown in (a) and ratios of the two instruments against
the average CO concentrations in (b). Below 50 ppbv no COmixing ratios were found. Solid black lines in the plot show the weighted bivariate linear least squares fit to the data. All data is averaged to 10 seconds. The dashed line gives the one to one correspondence.
Fig. 4. Scattergram of DLR versus MRF CO mixing ratios shown in (a) and ratios of the two instruments against the average CO
concentra-tions in (b). Below 50 ppbv no CO mixing ratios were found. Solid black lines in the plot show the weighted bivariate linear least squares fit to the data. All data is averaged to 10 s. The dashed line gives the one to one correspondence.
central Atlantic. Using bivariate linear regression analysis a slope of 0.96±0.01 was obtained with a correlation (r2) which was slightly higher and closer to unity than ours (0.96 as compared to 0.95). This reflects a small systematic differ-ence in the accuracy of one or both of the instruments and artifacts on either instrument cannot be ruled out. The sys-tematic offset on the other hand was found to be fairly high in comparison to the low mixing ratios encountered (roughly 5% of the average mixing ratio, 85 ppbv) with a positive in-tercept of 4±1 ppbv on the DLR axis. This high inin-tercept was most likely caused in the first 30 min at the higher level run in which poor agreement (r2=0.76), small dynamic range and large extrapolation from the main data set to the y-axis occurred.
In an attempt to further clarify the quantitative estimates of the precision and systematic differences another method is to use normalised difference versus the average data or the ratio of the two instruments against the overall average data. The ratio of the two CO measurements as a function of the aver-age CO are displayed in Fig. 4b. Most of the points are tightly clustered around the 1.0 ratio line with 87% within ±5% of the line. The standard deviation of the ratios of the measure-ments (1σ =2.2) is in close approximation to the square root of the sum of the squares of the precision (1σ =2.12) for each instrument suggesting that both instruments were measuring the same air-masses. Statistical analysis obtained a maxi-mum ratio of 1.09, a minimaxi-mum of 0.92 and an average ratio value of 1.01±0.02. The average ratio was found to be well within the systematic difference of 5%, which was previously obtained with the bivariate linear least squares fit indicating that there are no long-term systematic variations between the instruments. Although the two CO ratios are spread evenly on either side of unity, the DLR data indicates higher CO concentrations around 70 ppbv. This can be accounted for in the first 30 min of the comparison when the two instruments were sampling air with different CO mixing ratios owing to the spatial arrangement of the aircraft.
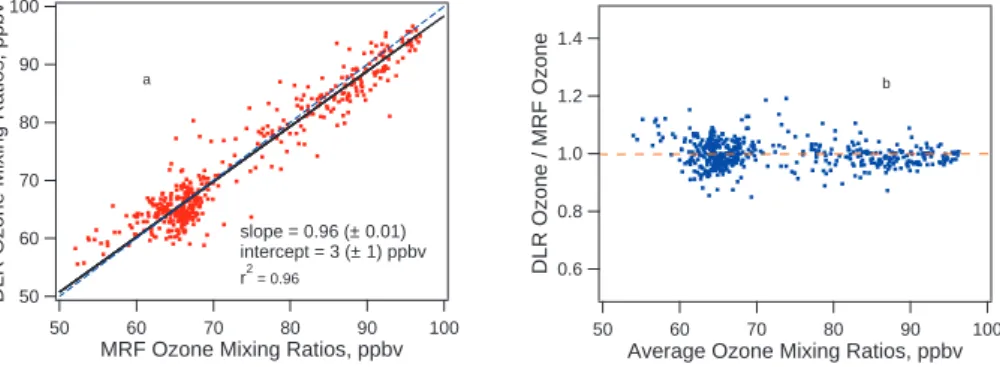
The scattergram plot of the O3 instruments with a
cor-responding one to one and a weighted bivariate linear
re-gression fit line are displayed in Fig. 5a. A very tight cor-relation of 0.96 was discovered between the data sets. A slope of 0.96±0.01 was obtained from the weighted linear least squares fit with a positive intercept on the DLR axis of 3±1 ppbv. Due to the small dynamic range (∼45 ppbv) and fairly large extrapolation from the main data spread to the y-axis, the systematic difference between the instruments we believe can be deemed as insignificant. As with the CO in-struments, O3showed poor correlations over the first 30 min
of the comparison period (Fig. 6). The data sets for this early period were poorly correlated (r2=0.44) owing to the man-ner in which the individual instruments collected the sampled air. The signal in the DLR data set was noisier compared to the MRF data owing to pressure variations which created a reduction in the ozone mixing ratios. The statistical fit-ted line parameters and associafit-ted uncertainties indicate that there are no significant systematic differences between the two O3instruments. A further indication of this is implied
with the ratio of the two O3 measurements as a function of
the average O3as shown in Fig. 5b. As with the CO
instru-ment most of the data points are clustered around the 1.0 ra-tio line with 65% within ±5% of the line. This is not as tight a relationship as with the CO instruments, primarily owing to the noisy O3mixing ratio signals in the DLR instrument
(first 30 min of the comparison), but the ratios are evenly dis-tributed around the one value line. The maximum ratio ob-tained by statistical analysis was 1.19, the lowest 0.85, and
the average value was 0.99±0.05. This DLR/MRF O3ratio
showed no significant trend with the average O3mixing
ra-tios and was within the systematic difference of 4%, which was indicated previously with the analysis by the bivariate linear least squares fit.
Carbon monoxide is a long lived tracer of human activ-ity with reasonably well quantified source relationships and
the covariance of O3 and CO has been used to constrain
the anthropogenic sources of O3 (Chin et al., 1994;
Par-rish et al., 1993). For example ozone and CO correlations have been used to estimate the export of anthropogenically-produced ozone in North America (Parrish et al., 1993)
1.4 1.2 1.0 0.8 0.6 DLR Ozone / MRF Ozone 100 90 80 70 60 50
Average Ozone Mixing Ratios, ppbv
b 100 90 80 70 60 50
DLR Ozone Mixing Ratios, ppbv
100 90 80 70 60 50
MRF Ozone Mixing Ratios, ppbv
a
slope = 0.96 (± 0.01) intercept = 3 (± 1) ppbv r2 = 0.96
Fig. 5 Scattergram of DLR versus MRF O mixing ratios shown in (a) and ratios of the two instruments
against the average O concentrations in (b). Below 50 ppbv no O mixing ratios were found. Solid black lines in the plot show the weighted bivariate linear least squares fit to the data. All data is averaged to 10 seconds. The dashed line gives the one to one correspondence.
3
3 3
Fig. 5. Scattergram of DLR versus MRF O3mixing ratios shown in (a) and ratios of the two instruments against the average O3
concentra-tions in (b). Below 50 ppbv no O3mixing ratios were found. Solid black lines in the plot show the weighted bivariate linear least squares fit
to the data. All data is averaged to 10 s. The dashed line gives the one to one correspondence.
where 1O3/1CO=0.3. Individual instrument comparisons
of the 10 s averaged CO and O3mixing ratios are shown in
Fig. 6. Four distinct periods can be identified: (1) The flight level at 8000 m until 13:40 GMT when the concentrations of CO and O3are reasonably constant with hardly any
fluc-tuations in the ambient mean mixing ratios of CO (C-130:
66±2, Falcon: 65±3 ppbv) and O3 (C-130: 70±3, Falcon:
71±2 ppbv). There appears to be no apparent correlation be-tween these two chemical species on this level. (2) The end of the flight level at 8000 m and the descent to 6000 m when layers with markedly different composition are intersected giving large, positively correlated, variations in the CO and O3concentrations (these lasted between 2 and 5.5 min
cov-ering a corresponding distance of between 6 and 30 km at an IAS of 180 knots). The 1O3/1CO ratio is greater than 1,
which is much larger than that found near the surface (0.30) (Parrish et al., 1993, 1998). This is typical of the upper tropo-sphere and is due in part to a greater O3production efficiency
compared to near the ground (Zahn et al., 2000, 2002). Fur-ther, the ratio is a function of air masses with differing origins and histories rather than simply a measure of photochemical O3production in a single air mass. (3) The flight level at
6000 m until 14:13 shows a distinct negative correlation be-tween O3and CO, suggesting some stratospheric influence.
Also the O3concentrations reach a maximum just above the
92 ppbv level (96.3 ppbv) defined, by Zahn et al. (2002), as the chemical tropopause over central Europe for this time of year. (4) The flight level at 6000 m from 14:13 onwards ex-hibits a similar positive correlation between O3 and CO as
found for the second period. It is almost certain that these layers of high CO and O3are due to long-range transport of
pollution from North America.
3.3 Interpretation of short-lived changes (spikes)
During the four prominent spike episodes of NO and NOy
displayed in Fig. 2, no significant concentration changes of CO were observed although a slight decrease in the O3
con-centration occurred indicating a fresh pollution episode.
Ta-100 90 80 70 60 50
DLR and MRF, CO and Ozone Mixing Ratios, ppbv
13:15 10/08/00
13:30 13:45 14:00 14:15 14:30
Time (Greenwich Mean Time, GMT)
8000 6000 4000 2000 0 Altitude (Metres) MRF Ozone DLR Ozone altitude DLR CO MRF CO
Fig. 6 Mixing ratios of O and CO for the MRF and DLR instruments between 6000 and 8000 metres on the
10/08/2000 during the intercomparison period from 13:10 to 14:36 (GMT). The data is averaged to 10 seconds and any gaps in the data are due to instrument zeroing or aircraft re-positioning.
3
Fig. 6. Mixing ratios of O3and CO for the MRF and DLR
instru-ments between 6000 and 8000 m on the 10 August 2000 during the intercomparison period from 13:10 to 14:36 GMT. The data is aver-aged to 10 s and any gaps in the data are due to instrument zeroing or aircraft re-positioning.
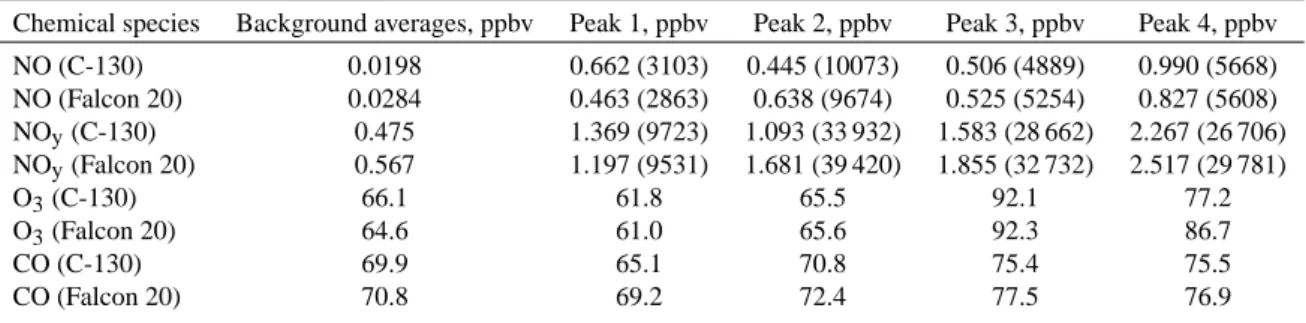
ble 3 below displays the mixing ratios of the 4 peaks of the various data sets as well as the peak areas (in brackets) for the
NO and NOymeasurements with neither instrument having
total peak precedence.
Comparison of the peak heights for the 1 s ratios gave the first and fourth NO peak higher on the UEA instrument sug-gesting that both instruments were measuring real concen-tration changes. Using the linear least squares fit on the 1 s ratios gave a slope of 1.03±0.08 for the NO and a slope of 0.76±0.11 for the NOyinstruments. Most of the NOypeaks
measured gave the DLR NOy higher by about 12%, apart
from peak one, which favoured the UEA NOyby about 2%.
This 2% higher value on the UEA NOywas also observed on
the UEA NO and was probably due to the different spatial ar-rangement of the aircraft, with the NO maximum occurring closer to the UEA inlets. Apart from the 1 s peak ratios the areas were integrated to y=0 (using a trapezoidal integration) and calculated from the ambient background signal. The four peak areas show closer agreement than the corresponding
Table 3. Aircraft instrument mixing ratios for the chemical species observed in spikes 1, 2, 3, and 4 for single point 1 s data. The mixing
ratios correspond to the highest single point during the spike period with those in brackets showing the peak area. Any missing points in the data were interpolated for the peak area integration.
Chemical species Background averages, ppbv Peak 1, ppbv Peak 2, ppbv Peak 3, ppbv Peak 4, ppbv
NO (C-130) 0.0198 0.662 (3103) 0.445 (10073) 0.506 (4889) 0.990 (5668) NO (Falcon 20) 0.0284 0.463 (2863) 0.638 (9674) 0.525 (5254) 0.827 (5608) NOy(C-130) 0.475 1.369 (9723) 1.093 (33 932) 1.583 (28 662) 2.267 (26 706) NOy(Falcon 20) 0.567 1.197 (9531) 1.681 (39 420) 1.855 (32 732) 2.517 (29 781) O3(C-130) 66.1 61.8 65.5 92.1 77.2 O3(Falcon 20) 64.6 61.0 65.6 92.3 86.7 CO (C-130) 69.9 65.1 70.8 75.4 75.5 CO (Falcon 20) 70.8 69.2 72.4 77.5 76.9
single peaks for the NO and NOy data sets. The NO peak
areas (C-130/Falcon 20) are all within 8% of each other indi-cating a close correlation between the instruments, especially at mixing ratios well above the detection limits of the instru-ments. The NOy peak area ratios on the other hand, often
varied, ranging from 0.86 to 1.02, with an average of 0.91 compared to 1.02 for the NO peak area ratios. This could either be due to individual instruments missing specific NOy
components such as HNO3or particulate nitrates or changes
in the concentration of the NOydue to the aircraft spatial
ar-rangement. The latter is a more conceivable reason as the least squares fit correlation coefficients shows close agree-ment between the instruagree-ments over the comparison period.
The spikes of predominantly NO are presumably due to exhaust plumes of commercial aircraft that have passed in the last few hours, examples of which have been measured pre-viously by Schlager et al. (1997) and Klemm et al. (1998). Lightning could conceivably be another source (Tie et al., 2001) of increased NO but there had been no positive indi-cation of lightning episode occurring over the previous few days. An estimation of the age of these spikes can usually be obtained by the NO/NOymixing ratios (Ridley et al., 1994).
Fresh aircraft emissions would be expected to have high NO content, since jet engines emit odd nitrogen mostly in the
form of NOx (Schumann, 1997), giving a higher NO/NOy
ratio than normally expected for this altitude. Over New Mexico (Ridley et al., 1994), and over the Northeast At-lantic (Klemm et al., 1998), NO/NOyratios greater than 0.6
were calculated in aircraft flight corridors. On this flight, no strong evidence of fresh aircraft emissions was obtained. The 4 major 1 s peak ratios after averaging were found to be 0.41±0.09 for the UEA instruments whilst the DLR ratios
were slightly lower at 0.34±0.06. Ratios of the NO/NOy
areas are a more accurate representation of the peaks and produced even lower averaged values, namely, 0.25±0.07 and 0.21±0.06 for the UEA and DLR instruments, respec-tively. It could well be that these peaks observed on both independent instruments were due to aircraft emissions but they have had considerable time to be diluted or age
pho-tochemically and give lower NO/NOyratios than expected.
The NO/NOyratios are 10-fold higher than the background
ratios of 0.04±0.02 for the UEA and 0.05±0.01 for the DLR instruments, indicating that some pollution episode had oc-curred.
4 Summary
In this paper we have shown that several of the chemical tracer instruments used on board the C-130 and Falcon 20 appear to be functioning correctly and are in good agree-ment with each other. Data for NO, NOy, O3, CO were
ob-tained from EXPORT aircraft measurements carried out over southern Germany on 10 August 2000 and correlations be-tween species on individual instruments were studied. The differences in the correlations between instruments allow an assessment of the measurement capabilities determined by the accuracy, precision and the possibility of ambient inter-ference on the instruments. The NO and NOycorrelations,
without the spikes, give a very clear indication of the close agreement, within statistical estimated instrument precision, of the two instruments and that both appear to be operat-ing satisfactory over a wide range of observed values (10–
1000 pptv). High mixing ratios well above the detection
limits and a large dynamic range of measurements on both instruments helped to provide clear correlation coefficients and the agreement over the air masses sampled demonstrates that significant interferences in the measurements are absent. Variations in mixing ratios between instruments appeared to be random and reflect real differences in air masses sampled and can be assumed to be due to spatial arrangements of the aircraft. The degree of agreement lends confidence to the accuracy of all observed measurements and indicates the ac-curacy to be within the uncertainties quoted in Tables 1 and 2.
Statistical analysis of the CO data was found to give tight correlation coefficients and low slope gradients with the dynamic range that was observed. Although the mixing
ratio differences during the first 30 min at the higher altitude has not been fully solved, the instruments appear to be both functioning correctly. It is very likely that the differences ob-served on both instruments were due to air with different CO mixing ratios being sampled than any instrument uncertain-ties. This is confirmed by the consistent agreement between the instruments within their estimated precision and indicates the absence of any major interference. Qualitative estimates of ambient CO concentrations can be derived from this inter-comparison between the two instruments.
O3was also found to give very close agreement
through-out the intercomparison period. The higher signal to noise ra-tios over the first 30 min of the intercomparison for the DLR O3instrument can be explained by the sampling method
em-ployed. A significantly higher noise was observed for the DLR O3 at a given O3 volume mixing ratio for pressures
lower than sea surface pressure resulting in a reduced num-ber of O3 molecules in the cell compared to the C-130 O3
measurement. Statistical analyses indicated that the data sets were closely correlated and well within the estimated preci-sion of the instruments. Errors that were initially found on the MRF instrument associated with the temperature sensor were corrected before final data submission.
The NO, NOy, O3 and CO datasets, from the different
aircraft, used during EXPORT, can now be combined with confidence. This provides greater coverage of data, for use in computer simulation or transport studies etc, and gives ’added value’ to both experiments. This particular form of comparison flight also lends credibility to composite stud-ies of airborne observations, for example the type detailed by Emmons et al. (2000). The discrepancies for the missing NOyare not significant within the combined uncertainties of
the two instruments. Additionally, differences in the inlet de-sign may result in different efficiencies of aerosol sampling by the two instruments leading to the sampling of different amounts of particulate nitrate, although slightly different air mass sampling cannot be totally ruled out.
Acknowledgements. MRF for the support and help in establishing
instruments on board the C-130 aircraft. S. Bauguitte for the
devel-opment of the NOx,yinstrument at the NOAA workshop in Boulder,
Colorado. Those at Boulder such as F. Fehsenfeld, M. Buhr, T. Ry-erson, D. Sueper and D. Parrish who helped with the building of the
NOx,y instrument and the statistical package for the bivariate
lin-ear regression analysis. UK Natural Environment Reslin-earch Council (NERC) for funding under grant number NER/A/S/1999/00082.
References
Baugiutte, S. J. B.: A study of tropospheric reactive nitrogen oxides in the North Atlantic Region, Phd. Thesis, UEA, Norwich, 2000. Chin, M., Jacob, D. J., Munger, J. W., Parrish, D. D., and Dod-dridge, B. G.: Relationship of ozone and carbon monoxide over North America, J. Geophys. Res., 99, 14 565–14 573, 1994. Day, D. A., Dillon, M. B., Wooldridge, P. J., Thornton, J. A.,
Rosen, R. S., Wood, E. C., and Cohen, R. C.: On alkyl nitrates,
O3, and the ”missing NOy”, J. Geophys. Res., 108 D16, 4501,
doi:10.1029/2003JD003685, 2003.
Drummond, J. W., Volz, A., and Ehhalt, D. H.: An optimized chemiluminescence detector for tropospheric NO measurements, J. Atmos. Chem., 2, 287–306, 1985.
Drummond, J. W., Volz, A., and Ehhalt, D. H.: Measurements of
nitric oxide between 0–12 km altitude and 67◦N to 60◦S
lati-tude obtained during STRATOZ III, J. Geophys. Res., 93, D12, 15 831–15 849,1988.
Emmons, L. K., Hauglustaine, D. A., M¨uller, J.-F., Carroll, M. A., Brasseur, G. P., Brunner, D., Staehelin, J., Thouret, V., and Marenco, A.: Data composites of airborne observations of tro-pospheric ozone and its precursors, J. Geophys. Res., 105, D16, 20 497–20 538, 2000.
Fahey, D. W., Eubank, C.S., H¨ubler, G., and Fehsenfeld, F. C.: Eval-uation of a catalytic reduction technique for the measurement
of total reactive odd nitrogen NOyin the atmosphere, J. Atmos.
Chem., 435–468, 1985.
Fehsenfeld, F.C., Drummond, J. W., Roychowdhury, U. K., Galvin, P. J., Williams, E. J., Buhr, M. P., Parrish, D. D., H¨ubler, G., Langford, A. O., Calvert, J. G., Ridley, B. A., Grahek, F., Heikes, B. G., Kok, G. L., Shetter, J. D., Walega, J. G., Elsworth, C. M., Norton, R. B., Fahey, D. W., Murphy, P. C., Hovermale, C., Mohnen, V. A., Demerjian, K. L., Mackay, G. I., and Schiff, H. I.:
Intercomparison of NO2measurements techniques, J. Geophys.
Res., 95, D4, 3579–3597, 1990.
Gerbig, C., Kley, D., Volz-Thomas, A., Dewey, K., and Haaks, D.: Fast-response resonance fluorescence CO measurements aboard the C-130: Instrument characterization and measurements made during North Atlantic Regional Experiment.: J. Geophys. Res., 101, D1, 1699–1704, 1996.
Gerbig, C., Schmitgen, S., Kley, D., Volz-Thomas, A., Dewey, K., and Haaks, D.: An improved fast-response vacuum-UV reso-nance fluorescence CO instrument, J. Geophys. Res., 104, D1, 1699–1704, 1999.
Holloway, J. S., Jacoubek, R. O., Parrish, D. D., Gerbig, C., Volz-Thomas, A., Schmitgen, S., Fried, A., Wert, B., Henry, B., and Drummond, J. R.: Airborne Intercomparison of Vacuum Ultra-violet Fluorescence and Tunable Diode Laser Absorption Mea-surements of Tropospheric Carbon Monoxide, J. Geophys. Res., 105, D19, 24 251–24 261, 2000.
Hov, O., Flatoy, F., Solberg, S., Schmidbauer, N., Dye, C., Foot, J. S., Dewey, K., Kent, J., Richter, H., Kaye, A., Kley, D., Schmit-gen, S., Penkett, S. A., Reeves, C., Bandy, B., Brough, N., Green, T., Mills, G., Law, K., Plantevin, P-H., Savage, N., Arnold, S., Lobb, M., Evans, M., O’Connor, F., Pyle, J., Beekmann, M., Kowol-Santen, J., Dugault, E., Monks, P. S., Edwards, G. D., and McQuaid, J.: Maximum Oxidation Rates in the Free Tropo-sphere (MAXOX), Final Report, 2–36, ENV4-CT97 0525, Brus-sels, EU, 2000.
H¨ubler, G., Fahey, D. W., Ridley, B. A., Gregory, G. L., and Fehsen-feld, F. C.: Airborne measurement of total reactive odd nitrogen
(NOy), J. Geophys. Res., 97, 9833–9850, 1992.
Klemm, O., Stockwell, W. R., Ziereis, H., and Schlager, H.: Mea-surements of nitrogen oxides from aircraft in the northeast At-lantic flight corridor, J. Geophys. Res., 103, D23, 31 217–31 229, 1998.
Kley, D. and McFarland, M.: Chemiluminescence detector for NO
Kondo, Y., Kawakami, S., Koike, M., Fahey, D. W., Nakajima, H., Zhao, Y., Toriyama, N., Kanada, M., Sachse, G. W., and Gregory, G. L.: Performance of an aircraft instrument for the measurement
of NOy, J. Geophys. Res., 102, D23, 28 663–28 671, 1997.
Neri, F. G., Saitta, G., and Chiofalo, S.: An accurate and straight-forward approach to line regression analysis of error-affected ex-perimental data, J. Phys. E Sci. Instrum., 22, 215–217, 1989. Neuman, J. A., Huey, L. G., Ryerson, T. B., and Fahey, D. W.: Study
of inlet materials for sampling atmospheric nitric acid, Environ. Sci. Technol., 33, 1133–1136, 1999.
Newell, R. E., Wu, Z.-X., Zhu, Y., Hu, W., Browell, E. V., Gregory, G. L., Sachse, G. W., Collins Jr, J. E., Kelly, K. K., and Liu, S. C.: Vertical fine-scale atmospheric structure measured from NASA DC-8 during PEM-West A, J. Geophys. Res., 101, 1943– 1960, 1996.
Parrish, D. D., Holloway, J. S., Trainer, M., Murphy, P. C., Forbes G. L., and Fehsenfeld, F. C.: Export of North American ozone pollution to the north Atlantic ocean, Science, 259, 1436–1439, 1993.
Parrish, D. D., Buhr, M. P., Trainer, M., Norton, R. B., Shimshock, J. P., Fehsenfeld, F. C., Anlauf, K. G., Bottenheim, J. W., Tang, Y. Z., Wiebe, H. A., Roberts, J. M., Tanner, R. L., Newman, L., Bowersox, V. C., Olszyna, K. J., Bailey, E. M., Rodgers, M. O., Wang, T., Berresheim, H., Roychowdhury, U. K., and Demerjian, K. L.: The total reactive oxidised nitrogen levels and the parti-tioning between the individual species at six rural sites in eastern North America. J. Geophys. Res. 98, D2, 2927–2939, 1993. Parrish, D. D., Trainer, M., Holloway, J. S., Yee, J. E., Warshawshy,
M. S., Fehsenfeld, F. C., Forbes G. L., and Moody, J. L.: Rela-tionships between ozone and carbon monoxide at surface sites in the North Atlantic region, J. Geophys. Res., 103, 13 357–13 376, 1998.
Penkett, S. A., Bandy, B. J., Reeves, C. E., McKenna, D., and Hignett, P.: Measurements of peroxides in the atmosphere and their relevance to the understanding of global tropospheric chem-istry, Faraday Discuss., 100, 155–174, 1995.
Ridley, B. A., Carroll, M. A., Torres, A. L., Condon, E. P., Sachse, G. W., Hill, G. F., and Gregory, G. L.: An intercomparison of results from ferrous sulphate and photolytic converter techniques
for measurements of NOxmade during the NASA GTE/CITE 1
aircraft program, J. Geophys. Res., 93, No. D12, 15 803–15 811, 1988.
Ridley, B. A., Walega, J. G., Dye, J. E., and Grahek, F. E.:
Distri-bution of NO, NOx, NOy, and O3to 12 km altitude during the
summer monsoon over New Mexico, J. Geophys. Res., 99, D12, 25 519–25 534, 1994.
Ridley, B. A., Walega, J., Montzka, D., Grahek, F., Atlas, E., Flocke, F., Stroud, V., Dreary, J., Gallant, A., Boudries, H., Bot-tenheim, J., Anlauf, K., Worthy, D., Sumner, A. L., Splawn, B., and Shepson, P.: Is the arctic surface layer a source and sink of
NOxin winter/spring? J. Atmos. Chem., 36, 1–22, 2000.
Ryerson, T. B., Huey, L. G., Knapp, K., Neuman, J. A., Parrish, D. D., Sueper D. T., and Fehsenfeld, F. C.: Design and initial
char-acterisation of an inlet for gas-phase NOymeasurements from
aircraft, J. Geophys. Res., 104, 5483–5492, 1999.
Schlager, H., Konopka, P., Schulte, P., Schumann, U., Ziereis, H., Arnold, F., Klemm, M. Hagen, D. E., Whitefield, P. D., and Ovar-lez, J.: In situ observations of air traffic emission signatures in the North Atlantic flight corridor, J. Geophys. Res., 102, 10 739– 10 750, 1997.
Schumann, U.: The impact of nitrogen oxides emissions from air-craft upon the atmosphere at flight altitudes – results from the aeronox project, Atmos. Environ., 31, 12, 1723–1733,1997. Stehr, J. W., Dickerson, R. R., Hallock-Waters, K. A., Doddridge,
B. G. and Kirk, D.: Observations of NOy, CO and SO2and the
origin of reactive nitrogen in the eastern United States, J. Geo-phys. Res., 105, D3, 3553–3563, 2000.
Tie, X., Zhang, R., Brasseur, G., Emmons, L., and Lei, W.: Effects of Lightening on reactive nitrogen and nitrogen reservoir species in the troposphere, J. Geophys. Res., 106, 3167–3178, 2001. Williams, E. J., Roberts, J. M., Baumann, K., Bertman, S. B.,
Buhr, S. Norton, R. B., and Fehsenfeld, F. C.: Variations in NOy
composition at Idaho Hill, Colarado, J. Geophys. Res. 102, D5, 6297–6314, 1997.
Williams, E. J., Baumann, K., Roberts, J. M., Bertmann, S. B., Nor-ton, R. B., Fehsenfeld, F. C., SpringsNor-ton, S. R., Nunnermacker, L. J., Newman, L., Olszyna, K., Meager, J., Hartsell, B., Edger-ton, E., Pearson, J. R., and Rodgers, M. O.: Intercomparison of
ground based NOymeasurement techniques. J. Geophys. Res.,
103, D17, 22 261–22 280, 1998.
Zahn, A., Brenninkmeijer, C. A. M., Maiss, M., Scharffe, D. H., Crutzen, P. J., Hermann, M., Heintzenberg, J., Wiedensohler, A., Gusten, H., Heinrich, G., Fischer, H., Cuijpers, J. W. M., and van Velthoven, P. F. J.: Identification of extratripical two-way troposphere-stratosphere mixing based on CARIBIC
measure-ments of O3, CO and ultrafine particles, J. Geophys. Res., 105,
1527–1535, 2000.
Zahn, A., Brenninkmeijer, C. A. M., Asman, W. A. H., Crutzen, P. J., Heinrich, G., Fischer, H., Cuijpers, J. W. M., and van
Velthoven, P. F. J.: Budgets of O3and CO in the upper
tropo-sphere: CARIBIC passenger aircraft results 1997–2001, J. Geo-phys. Res., 107, ACH 6, doi:10.1029/2001JD001529, 2002. Zenker, T., Fischer, H., Nikitas, C., Parchatka, U., Harris, G.
W., Mihelcic, D., M¨usgen, P., P¨atz, H. W., Schultz, M.. Volz-Thomas, A., Schmitt, R., Behmann, T., Weißenmayer, M., and
Burrows, J. P.: Intercomparison of NO, NO2, NOy, O3and ROx
measurements during the oxidising capacity f the tropospheric atmosphere (OCTA) campaign 1993 in Izana. J. Geophys. Res., 103, D11, 13 615–13 634, 1998.
Ziereis, H., Schlager, H., and Schulte, P.: NO, NOy, and O3
in-tercomparisons during POLINAT 2, in Pollution From Aircraft Emissions in the North Atlantic Flight Corridor (POLINAT 2), Air. Pollut. Res. Rep. 68, edited by Schumann, U., 55–63, Eur. Comm., Luxembourg, 1999.