HAL Id: hal-03120982
https://hal.archives-ouvertes.fr/hal-03120982
Submitted on 9 Feb 2021
HAL is a multi-disciplinary open access
archive for the deposit and dissemination of
sci-entific research documents, whether they are
pub-lished or not. The documents may come from
teaching and research institutions in France or
abroad, or from public or private research centers.
L’archive ouverte pluridisciplinaire HAL, est
destinée au dépôt et à la diffusion de documents
scientifiques de niveau recherche, publiés ou non,
émanant des établissements d’enseignement et de
recherche français ou étrangers, des laboratoires
publics ou privés.
Global observation of anthropogenic aerosols from
satellite
D. Tanré, F. Bréon, J. Deuzé, M. Herman, P. Goloub, F. Nadal, A. Marchand
To cite this version:
D. Tanré, F. Bréon, J. Deuzé, M. Herman, P. Goloub, et al.. Global observation of anthropogenic
aerosols from satellite. Geophysical Research Letters, American Geophysical Union, 2001, 28 (24),
pp.4555-4558. �10.1029/2001GL013036�. �hal-03120982�
GEOPHYSICAL RESEARCH LETTERS, VOL. 28, NO. 24, PAGES 4555-4558, DECEMBER 15, 2001
Global observation of anthropogenic
aerosols
from satellite
D. Tanr• 1, F.M. Br6on
•, J.L. Deuz61,
M. Herman
l, P. Goloub
1, F. Nadal
• and A. Marchand
I
Abstract. This paper provides the first climatology fromsatellite of aerosol loading, both over land and oceanic surfaces. Over land, aerosol loading is retrieved using a new
remote sensing technique based on the polarization signature of scattered solar radiances. The product is sensitive to
particles that are within the accumulation mode, smaller than
ß ,0.5/,em. Those are mainly produced by anthropogenic sources, like smoke and urban/industrial aerosols. A rough identification of aerosol origin is obtained from the concomitant detection of fires from spaceborne observations.
The combination of aerosol load and fire identification
suggests that biomass burning is the main source of small particles in the atmosphere and that, at the regional scale, other anthropogenic activities have a significant impact
limited to China and India.
1. Introduction
The largest uncertainty of the anthropogenic radiative forcing on climate results from the impact of atmospheric aerosols both through direct and indirect effects (Kiehl and Briegteb, 1993; Chaffson et at., 1992). There is a lack of
measurements on the aerosol sources and their transport
although aerosols are essential components of the geochemical cycles and atmospheric chemistry (Crutzen and Andreae, 1990). Global distribution of aerosol optical thickness is as yet limited to oceanic areas, with limited
information on aerosol type (Husar et at., 1997). Measurements by the Total Ozone Mapping Spectrometer (TOMS) instrument allow an estimate of aerosol loading over land and oceans (Herman et at., 1997). However, the derived
aerosol index is very much function of the particle absorption and of the altitude of the aerosol layer (Torres et at., 1998). If dust transport is well depicted from TOMS and some of the aerosol events due to biomass burning activities are detected, several regions which are known to be highly polluted do not show high aerosol indices (Chiapetto et al., 2000).
The POLDER instrument (POLarization and Directionnatity of Earth's Reflectances, Deschamps et al., 1994) provides a
new opportunity to identify aerosol presence both over land and ocean thank to its polarization capabilities (Deuz6 et at., 2000; Deuz6 et al., 2001). A rough identification of aerosol origin is also obtained from the concomitant detection of fires from ATSR2/ERS2 (Along-Track Scanning Radiometer/ Earth
Remote sensing Satellite) observations.
1 Laboratoire d'Optique Atmosph6rique, Villeneuve d'Ascq, France 2: Laboratoire des Sciences du Climat et de l'Environnement, Gif sur Yvette, France
Copyright 2001 by the American Geophysical Union.
Paper number 2001GL013036. 0094-8276/01/2001GL013036505.00
2. Method
Over land, the contribution of the surface to the radiance reflected at the top of the atmosphere is generally much larger
than that of the aerosols, which makes such measurements
difficult to use for aerosol monitoring. The polarization capabilities of POLDER provide an attractive alternative since the polarization of most aerosol types is much larger than that of natural land surfaces (Deuz6 et at., 2001). The polarized radiance is mostly generated by small particles, around a few
tenths of microns, and is directly related to the accumulation mode of the aerosol loading (Deu• et at., 2001), such as
aerosols resulting from biomass burning and industrial
emissions. On the other hand, dust, made of non-spherical
particles of size typically larger than l ptm., cannot be detected
since the polarization generated by such particles is very small. The retrieval of optical thickness is so based on a fixed aerosol model of small particles. This model represents a
typical accumulation mode size distribution with an effective radius of 0.18ptm and a refractive index of 1.4, resulting in an
}tngstr6m
exponent
{x of 1.4. These
values
are in good
agreement with the urban (Remer et al., 1998a) and smoke (Remer et al., 1998b) aerosol models. The algorithm retrieves an optical thickness that is valid for an aerosol that has similar polarization properties. Mie simulations have shown that polarization efficiency is related to the size of the aerosol and scales roughly with {x. Thus, our product is not an optical
thickness (x) but an aerosol index similar to the product x{x.
Over ocean, the surface contribution to the reflected
radiance is very small which makes the retrieval of aerosol
load easier than over land and allows the characterization of
the aerosol type (Deuz6 et al., 1999). The size of the particles
is roughly
quantified
by the }tngstr6m
exponent
{x, which
is
close to 0 for large particles and to 1 for the accumulation mode. Therefore, we compute an aerosol index, representative
of small particle loading as the product of the retrieved x and {x. This product yields small values in the presence of marine and
dust aerosols. It also reinforces the cloud screening (cloud
contamination is expected to have no spectral dependence); a problem apparent on most maps of aerosol load derived
radiance measurements.
The
inversion
algorithm
is different
over
land
and
ocean,
so
the continuity of the index at the land/sea boundaries is not granted. Nevertheless, our results indicate that such continuity is observed in most regions. Therefore, although our indexcannot be claimed as fully quantitative, the numerical values
have similar meanings over land and ocean and can be used to estimate the strengths of the sources and the resulting transport. One identified shortcoming is related to snow covered pixels. Snow generates more polarized light than vegetation that may be wrongly attributed to the presence of
aerosols. Therefore, caution is required over area/month when snow may cover the surface.
The eight monthly means have been computed with a
spatial resolution of 20 km, and binned at 0.5 degree resolution. Cloud cover may strongly reduce the temporal
4556 TANRE El' AL.: AEROSOL SOURCES AND TRANSPORT FROM POLDER coverage, in which case the mean is based on a limited number
of retrievals representative of cloud free conditions only.
3. Identification of the aerosol sources
Since smoke and urban/industrial aerosol models have
similar optical properties, it is difficult to identify the aerosol type from POLDER maps only. A fire atlas coupled with our aerosol index maps can partly remove the ambiguity since smoke aerosols are obviously related to the presence of fires.
In Fig. 1 the fire activity detected by ATSR-2/ERS-2 (Arino et
al., 1995) is reported as red ellipsis. These ellipsis are centred
on the barycentre of the fires located within the area, their orientation is adjusted on the main location of the fires and their surface is proportional to the total number of detected fires. An ellipse if shown if at least 50 fires have been detected
during the month in the area of interest. The largest aerosol indices in the tropics are clearly related to biomass burning
activity as already shown by Goloub and Arino (2000). We
have analyzed monthly mean maps of aerosol index and fire detection, together with wind fields at 950, 850 and 500 hpa. This analysis allows the identification of high aerosol load that are clearly related to concomitant fires, as well as plumes
of aerosol transport downwind of such areas. In some other
places, high aerosol load are detected that are clearly not part of identified biomass burning plumes. In such cases, we suggest that they are of a different origin. A complete identification of the aerosol species would require the use of a transport model but it is out of the scope of the present paper.
3.1. Biomass Burning Aerosol
The location of high smoke loads varies with the season.
Over Africa, such events are identified over Madagascar and Tanzania in November. Then, from December to February, the
largest index values are found in Western Africa, North of the Equator. In May and June, the maximum has moved South of the Equator. These temporal evolutions are consistent with the fire product as well as previous observations of biomass
burning activity (Hao and Liu, 1994). During July to
September, a period with no POLDER measurements, the potential area of biomass burning activity in Africa shifts
from West to East, South of the equator. The fires observed in Libya as well as around the Persian Gulf are due to oil industry
and do not result in large smoke emissions. In Central America, a strong signal is apparent in April and May, whereas
it is one month earlier in the Northern part of South America.
The strongest period of biomass activity in South America occurs during late August and September (Kaufman et al.,
1998), when no POLDER data is available. Nevertheless, one can depict some activity in November and December in North Brazil, again consistent with the period of fire activity in this
region. Except in February, it looks like fires over Paraguay
and North of Argentina are very intense and do not result in
large smoke plumes. In reality, there are many single fires scattered over the whole region, that do not result in a strong monthly signal. They are arbitrarily gathered due to our
present method of fire activity display. In Northern Australia, smoke aerosols are present in November and December. For
Western part of the Japan Islands. Previous observations show that yellow sand originating from the Eastern Asian desert can affect the region at that time of the year. However, several factors indicate that dust is not the major contributor to our aerosol index: (i)dust is composed of large non spherical
particles that have little effect on the polarization (Nakajima
et al., 1989), and therefore on the index, (ii) off the coast of East Asia, the Angstrom coefficient measured by POLDER (not shown; Deuz6 et at., 1999) indicates the presence of small aerosols rather than dust particles and (iii) the TOMS index, which is sensitive to dust, indicates also rather small, if any,
aerosol loading in this region. Thus, we conclude that the large aerosol index observed in this area results from anthropogenic
activities, although we cannot quantify the retative contribution of smoke and urban/industrial pollution.
3.2. Urban/Industrial Aerosol
Over the Eastern part of China, from November to March, no fire is detected when our index shows a high load of aerosols, which suggests urban/industrial origin. Further in the spring, fires are detected with a simultaneous increase of
the aerosol load. These observations indicate the presence of several aerosol types over Eastern China. Note that many fires are detected over Siberia, although the load is not quite as high
in this area as it is over China. A large aerosol load is observed along Ganges valley from November until February with a maximum in December and January. Few fire events have been
detected during the periods neither in this area nor upwind.
Thus, it can be attributed to biofuet and fossil fuel use, in coherence with previous analysis (Novakov et at., 2000). In
spring, the pollution is less severe because of the scavenging
by monsoon rain but significant aerosol load can still be observed all year long. In March, the number of detected fires increases and the aerosol load may be a mixture of both aerosol types. In June, the aerosol index is large again, with no
detected fire, which indicates a pollution origin. The Western part of North America does not show any significant aerosol
loading during our eight months of measurements. A small
signal can be observed on the Eastern part in June but much weaker than over the Asia continent. Again, due to the unexpected failure of ADEOS, the July and August months are missing in our data set when the pollution level is expected to be maximal in this region. Central Europe is also affected by pollution events with a maximum in April and May. The large
aerosol signal observed from January through March over the Eastern Europe as well as over Canada, may result from
pollution, but the index is here unreliable because snow may
contaminate the signal.
4. Transport
Over the oceans, aerosol loading is clearly influenced by the sources described in the previous section. Significant
values are observed downwind of the continents. Our results are
analyzed separately for the ocean basins.
4.1. Atlantic Ocean
the other months, the smoke emission is low compared to that The Noah Atlantic appears very clear during the winter. of other regions and do not result in large aerosol index values. Starting in April and increasing towards June, the influence of
Biomass burning also occurs in South-East Asia and Eastern North and Central America is apparent. In the Gulf of Mexico, India in early spring with a maximum in March, as it is clearly a very strong loading is observed in April and May, in apparent on the aerosol index maps. In April, May and June, coincidence with the sources of biomass burning in Central there are large aerosol indices over China and the South- America. The aerosols originating from Central and North
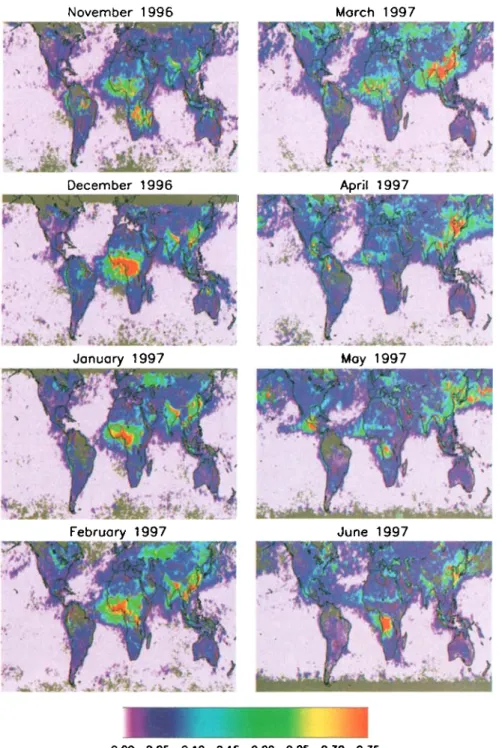
TANRE ET AL.: AEROSOL SOURCES AND TRANSPORT FROM POLDER 4557 November 1996 Morch 1997 December 1996 donuory 1997 Februory 1997 April 1997 Moy 1997 June 1997 0.00 0.05 0.10 0.15 0.20 0.25 0.30 0.35
Figure 1. Maps of the monthly mean aerosol index derived from POLDER space-borne measurements. Grey pixels over land indicate areas where permanent cloud cover prevented an estimate of the aerosol parameters. The fire activity is reported by the use of red ellipsis. They are centred on the barycentre of the fires located within the area, their orientation i s adjusted on the main location of the fires and their size is related to the total number of fires and their spatial extension. An ellipsis is drawn when more than 50 fires have been detected during the month.
America do not result in significant load over the coasts of Europe in our monthly averages although this result cannot rule out the occurrence of individual events. Aerosol loading appears small in the Eastern part of the basin, a result of the dominant winds from the West. The Tropical Atlantic is affected by both dust from Sahara and Sahel and biomass burning aerosols. During the spring and early summer, a plume is observed that crosses the Atlantic and reaches the Caribbean. Its location is fully consistent with previous studies on the dust transport from the Sahara. Nevertheless, because the Angstr6m coefficient of dust is close to zero, the relationship between our index and the load is highly
unreliable and rules out any further interpretation. On the
other hand, the high aerosol contents observed in winter time
offshore of West Africa, that are generally attributed to the
presence of dust, are clearly related to aerosols resulting from
biomass burning. The present study does not demonstrate that
dust is not present at all, but indicates that smoke is also a major contributor to the high aerosol loading in the area in winter. Further South, significant load observed in May and
June off the coast of Central Africa appears to result from
biomass burning in coincidence with the sources discussed in the previous section. However the transport is of shorter range than that of aerosols in the Equatorial and Tropical North
4558 TANRE El' AL.: AEROSOL SOURCF3 AND TRANSPORT FROM POLDER Atlantic. This is consistent with the smaller intensity of the
prevailing winds observed in that region. The November sources of Madagascar and Mozambique do not reach the
Atlantic Ocean. Most of the South Western Atlantic appears to
be very clean. In particular, no significant load is observed off
the coast of South America.
NASDA. The fire index is based on the ATSR-2/ERS-2 data managed
by the European Space Agency (ESA). The authors would like to acknowledge Anne Lifermann for her constant support. This study was
funded by the Centre National de la Recherche Scientifique (CNRS).
References
4.2. Indian Ocean
The South Indian Ocean is not influenced by African sources, except in the immediate South and East vicinity of Madagascar in November. This absence of contamination
results from the direction of the trade winds in this region that blow towards the continent. In the Eastern part of the Indian
ocean, the influence of Australia is apparent in November, which corresponds to the end of the biomass burning season in its Northern part. North Indian Ocean and the Bay of Bengal are widely affected by the sources in India. This influence is maximal in March, large from November to May, and decreases in June, in conjunction with the monsoon.
4.3. Pacific Ocean
The open Pacific ocean appears mostly clear all year long. Nevertheless, three regions are affected by continental
influence: (i) The North of Australia and Southern Indonesia in
November and June that correspond to the months when the fire activity is maximum. In addition, a stable aerosol layer can be observed over Malaysia and the Eastern part of Indonesia, during the eight months which may reflect anthropogenic activity other than biomass burning, (ii) The oceanic regions surrounding Central America in May et April due to biomass burning activities. The oceanic area that borders the South Western part of Mexico is always affected b y the presence of aerosol plume that can be attributed to pollution since no fire is reported in the vicinity, (iii) The North Pacific, East of Asia. Long range aerosol transport affects the region from March to June. It even can reach the shores of North America in April and May.
5. Conclusion
The present study indicates that at the global scale, biomass
burning activities is the main source of aerosol that are in the
fine mode. The relative importance of this contribution to the
total aerosol load has been underestimated in the past. At the
regional scale, the contribution of urban/industrial aerosols appears significant in China and India and, at a lower level,
over Central Europe, the Northern part of Central America and Eastern United States. The large aerosol pattern observed from satellite over the tropical Atlantic Ocean is usually attributed
to dust particles. Our results demonstrate that, although dust may provide the bulk of the aerosol load during the summer
months, biomass burning is a major contributor during the winter. These conclusions are based on eight months of measurements that exclude the summer period when pollution
may become more significant in Eastern United States and
Western Europe. Besides, this limited dataset also misses the
biomass burning season of South America and South Africa.
Arino O., J.M. Melinotte, Fire Index Atlas, Earth Observation Quaterly, 50, ESA publications, T.D Guyenne eds., 1995.
Charlson, R.J., S.E. Schwartz, J.M. Hales, R.D. Cess, J.A. Coackley, Jr., J.E. Hansen and D.J. Hofman, Climate forcing by anthropogenic aerosols, Science, 255, 423430, 1992.
Chiapello I., P. Goloub, D. Tanrt, J. Herman, O. Torres, A. Marchand,
Aerosol detection by TOMS and POLDER over oceanic regions, J. Geophys. Res., 105, 7133-7142, 2000.
Crutzen, P.J. and Andteac, MO., Biomass burning in the tropics: impact on atmospheric chemistry and biogeochemical cycles, Science, 250, 1669-1678, 1990.
Deschamps, P.Y, F.M. Br6on, M. Leroy, A. Podaire A. Bricaud, J.C.
Buriez, and G. S•ze, The POLDER mission: Instrument Characteristics and Scientific Objectives, IEEE Transactions on Geoscience and Remote Sensing, 32, 598-615, 1994.
Deuz6 J.L., M Herman, P. Goloub, D. Tanrt, A. Marchand, Characterization of aerosols over ocean from POLDER/ADEOS-1, Geophys. Res. Lett., 26, 1421-1424, 1999.
Deuz6 J.L., P. Goloub, M. Herman, A. Marchand, G. Perry, S. Susana, D. Tanrt, Estimate of the aerosol properties over the ocean with POLDER, J. Geophys. Res., 105, 15329-15346, 2000.
Deuz6 J.L., F.M. Br6on, C. Devaux, P. Goloub, M. Herman, B. Lafrance, F. Maignan, A. Marchand, G. Perry, D. Tanrt, Remote Sensing of aerosols over land surfaces from POLDER/ADEOS-1
polarized measurements, J. Geophys. Res., 106, 4913-4926, 2001.
Goloub, Ph., and O. Arino, Verification of the consistency .of the
POLDER aerosol index over land with ATSR-2/ERS-2 fire products,
Geophys. Res. Lett., 27, p. 899-902, 2000.
Hao, W.M., and M.-H. Liu, Spatial and temporal distribution of tropical biomass burning, Global Biochemical Cycles, 8, 495-503, 1994. Herman, J.R., P.K. Bhartia, O. Torres, C. Hsu, C. Seftor, and E. Seralier,
Global Distribution Of Absorbing Aerosols From Nimbus-7froms Data ,J. Geophys. Res., 102, 16911-16922, 1997.
Husar, I•B., J.M. Prospero, and L.L. Stowe, Characterization of tropospheric aerosols over the oceans with the NOAA advanced very high resolution radiometer optical thickness operational product, J. Geophys. Res., 102, 16889-16909, 1997.
Kaufman et al., The Smoke, Clouds and Radiation Experiment in Brazil
(SCAR-B), J. Geophys. Res., 103, 31783-31808, 1998.
Kiehl, J.T., and B.P. Briegleb, The relative roles of sulfate aerosols and
greenhouse gases in climate forcing, Science, 260, 311-314, 1993.
Nakajima, T., M. Tanaka, M. Yamano, M. Shiobara, K. Arao and Y. Nakanishi, Aerosol optical characteristics in the yellow sand events observed in May, 1982 at Nagasaki-Part 2 Models, J. Meteor. Soc. of Japan, 67, 279-291, 1989.
Novakov T., MO. Andteac, R. Gabriel, T.W. Kirchstetter, O.L. Mayol- Bracero and V. Ramanathan, Origin of caronaceous aerosols over the tropical Indian Ocean: Biomass burning or fossils fuels, Geophys. Res. Lett., 27, 4061-4064, 2000.
Remer, L.A., and Y.J. Kaufman, , Dynamical aerosol model:
Urban/industrial aerosol, J. Geophys. Res., 103, 13859-13871, 1998a.
Remer, L.A., Y.J. Kaufman, B.N. Holben, A.M. Thompson and D. McNamara, Tropical biomass burning smoke aerosol size distribution model, J. Geophys. Res., 103, 31879-31891, 1998b.
Torres, O. P.K. Bhartia., J. Herman, Z. Ahmad, and J. Gleason, , Derivation of aerosol properties from satellite measurements of backscattered ultraviolet radiation. Theoretical basis, J. Geophys. Res., 103, 17099-17110, 1998.
J.L. Deuz6, M. Herman, P. Goloub, A. Marchand, D. T anr6 Laboratoire d'Optique Atmosph6rique, CNRS, Bat. P5, U.S.T. de Lille, 59655- Villeneuve d'Ascq Cedex, France. (email: tanre@loa. univ-
Anolher
simil.ar
POLDER
instrument
i s scheduled
for launc
h lillel,fr)
onboard
ADEOS-II
in 2002 which may cover
the missing
F.M.
Br6on,
F. Nadal,
Labøratoire
des
SCienCes
du•climat
etde
period
and
allow
inter-annual
studies
l'Environnement,
Commissariat
h l'Energie
Atomique,
91191
- Gif sur
Yvette, France (email: fmbreon@cea. fr)
Acknowledgments. The results presented in this paper were obtained
using data from the POLDER instrument developed by the Centre (Received February 17,2001' revised june 27,2001' accepted july 17,