HAL Id: hal-02862330
https://hal.archives-ouvertes.fr/hal-02862330
Submitted on 9 Jun 2020
HAL is a multi-disciplinary open access archive for the deposit and dissemination of sci-entific research documents, whether they are pub-lished or not. The documents may come from teaching and research institutions in France or abroad, or from public or private research centers.
L’archive ouverte pluridisciplinaire HAL, est destinée au dépôt et à la diffusion de documents scientifiques de niveau recherche, publiés ou non, émanant des établissements d’enseignement et de recherche français ou étrangers, des laboratoires publics ou privés.
sediment- water interface in a diverticulum of the
Tethys Ocean during the Oceanic Anoxic Event 1a: The
French Vocontian Basin
Alexis Caillaud, Melesio Quijada, Bastien Huet, Jean-Yves Reynaud, Armelle
Riboulleau, Viviane Bout-Roumazeilles, François Baudin, Anthony Chappaz,
Thierry Adatte, Jean-Noël Ferry, et al.
To cite this version:
Alexis Caillaud, Melesio Quijada, Bastien Huet, Jean-Yves Reynaud, Armelle Riboulleau, et al.. Turbidite-induced re-oxygenation episodes of the sediment- water interface in a diverticulum of the Tethys Ocean during the Oceanic Anoxic Event 1a: The French Vocontian Basin. Depositional Record, Wiley, 2020, 6 (2), pp.352-382. �10.1002/dep2.102�. �hal-02862330�
352
|
wileyonlinelibrary.com/journal/dep2 Depositional Rec. 2020;6:352–382.O R I G I N A L R E S E A R C H A R T I C L E
Turbidite-induced re-oxygenation episodes of the
sediment-water interface in a diverticulum of the Tethys Ocean during the
Oceanic Anoxic Event 1a: The French Vocontian Basin
Alexis Caillaud
1|
Melesio Quijada
1|
Bastien Huet
1|
Jean-Yves Reynaud
1|
Armelle Riboulleau
1|
Viviane Bout-Roumazeilles
1|
François Baudin
2|
Anthony Chappaz
3|
Thierry Adatte
4|
Jean-Noël Ferry
5|
Nicolas Tribovillard
1This is an open access article under the terms of the Creative Commons Attribution License, which permits use, distribution and reproduction in any medium, provided the original work is properly cited.
© 2020 The Authors. The Depositional Record published by John Wiley & Sons Ltd on behalf of International Association of Sedimentologists. 1Laboratoire d'Océanologie et de
Géosciences, UMR 8187 LOG CNRS, Université de Lille-ULCO, Wimereux, France
2Sorbonne Université, UPMC Univ, CNRS,
ISTEP, Paris, France
3Department of Earth and Atmospheric
Sciences, Central Michigan University, Mount Pleasant, MI, USA
4Institute of Earth Sciences, University of
Lausanne, Lausanne, Switzerland
5TOTAL S.A, CSTJF, Pau, France
Correspondence
Nicolas Tribovillard, Laboratoire d'Océanologie et de Géosciences, UMR 8187 LOG CNRS-Université de Lille-ULCO, Wimereux, France.
Email: [email protected] Funding information
TOTAL S.A.
Abstract
Widespread anoxic events affected the Tethys Ocean during the Mesozoic. The Ocean Anoxic Event 1a (Early Aptian), expressed as the Selli Level or Goguel Level (GL) in European basins. The GL was deposited in the French Vocontian Basin, a semi-enclosed basin connected to the Tethys Ocean. This study presents an in-tegrated approach (Rock Eval, clay minerals, grain-size, inorganic geochemistry and molecular biomarkers), applied to four sections in the basin distributed along a proximal-distal transect. This study shows that the GL was perturbed by turbidites. In particular, the results demonstrate: (a) a homogeneous redox status of the basin that experienced oxic to suboxic conditions, according to trace element distributions and (b) low organic matter contents (total organic carbon ca 1 wt%) in the three sec-tions where turbiditic deposits are observed. The distal, condensed section exhibits the highest organic matter contents (total organic carbon >3 wt%). In addition, the presence of gammacerane and isorenieratene derivatives in the distal sections sug-gests that the water-column was intermittently stratified, with hypoxia developing in the photic zone. This stratification did not result from strong surface productivity but more likely from: (a) limited renewal of deep water in the basin; (b) reputedly high surface-water palaeotemperatures during the Early Aptian; and (c) the influx of waters, possibly depleted in free oxygen and in some dissolved trace elements, into the basin. The turbiditic inputs, in addition to organic matter dilution in the sediments and a brief rupture of the water-column stratification in the proximal areas of the basin, ventilated the sea floor and more specifically re-oxidized the sediment-water interface as well as underlying sediments. Such episodes of benthic re-ox-ygenation could have altered the long-term palaeoredox record, even in the distal sections where reducing conditions prevailed during deposition. In the area deprived of turbiditic input, sedimentary condensation, coupled with low oxygen conditions, furthered organic matter preservation and concentration.
1
|
INTRODUCTION
The Tethys Ocean was affected by widespread anoxia as demonstrated by the presence of organic carbon enriched horizons found world-wide (Schlanger and Jenkyns, 1976; Jenkyns, 2010). These Oceanic Anoxic Events (OAEs) were catastrophic environmental issues because the ab-sence of oxygen profoundly disturbed the whole marine ecosystem biota leading to mass extinctions. Nowadays, coastal areas are impacted by hypoxia (dead zones) and global OAEs might threaten our modern oceans as a con-sequence of climate changes and anthropogenic pressures on natural biogeochemical cycles (Baudin et al., 2017 and references therein). Although the sedimentary records of OAEs have been extensively studied over the past 40 years (Arthur and Schlanger, 1979; Summerhayes, 1981; Jacquin and Graciansky, 1988; Bréhéret, 1994; Leckie et al., 2002; Jenkyns, 2003; Emeis and Weissert, 2009), the controls governing OAE dynamics commonly taken into consider-ation remain simplistic, and involve only the usual parame-ters (i.e. the levels of organic productivity and oxygenation conditions) to characterize ancient redox conditions pre-vailing during OAEs. In this paper, the focus is placed on the OAE 1a event that unfolded during the early Aptian. The corresponding deposits have been termed Niveau Goguel, or Goguel Level (GL), in the Vocontian Basin of south-eastern France (Bréhéret, 1997), and Livello Selli, or Selli Level, in the Marche-Umbria Basin of Italy (Coccioni
et al., 1987). The Vocontian Basin is an ideal site for
ex-amining OAEs throughout the Mesozoic as it experienced a long-lasting phase of pelagic and hemipelagic sedimen-tation—markedly tuned to orbital Milankovitch-type cy-clicities—with low depositional energy, allowing subtle environmental variations to be recorded (Bréhéret, 1994; 1997). Recent investigations comparing the GL to its lat-eral equivalents in other settings or locations in the Tethys Ocean, such as Switzerland and Italy, were grounded on one or two sections only in the Vocontian Basin. Currently, integrated studies of the GL are still lacking, in particu-lar concerning its distribution and heterogeneity in the Vocontian Basin. Here, several contrasted records of the GL are examined, particularly where it is frequently re-worked or interbedded with turbidite deposits. The aim of the study is to assess the role of turbiditic activity in the enrichment and preservation of organic matter (OM). For this purpose, the GL was explored through four sections in the Vocontian Basin, using a multi-proxy approach: the or-ganic geochemistry is used to determine the abundance and
nature of OM, and, in addition to field observations, the inorganic geochemistry, grain-size of the non-carbonate fraction and clay-mineral assemblage identification allow the depositional conditions prevailing during the OAE 1a in this diverticulum of the Tethys Ocean to be defined.
2
|
GEOLOGICAL SETTING OF
THE VOCONTIAN BASIN DURING
THE APTIAN
During the Lower Cretaceous, the Vocontian Basin of south-eastern France corresponded to the slope of the northern margin of the Tethys Ocean (Friès and Parize, 2003, Figure 1). The platforms surrounding the basin were located in Provence to the south, Ardèche to the west, and the Chartreuse and Vercors mountains to the north (Figure 1). Thus, the Vocontian Basin was a diverticulum of the Tethys Ocean, only connected to the open ocean at its eastern end. The geometry of the Vocontian Basin was controlled by a system of extensive faults and tilted blocks inherited from Tethyan rifting, which occurred during Jurassic times (Graciansky and Lemoine, 1988). However, the Aptian and Albian stages were marked by a transition to an extensive–transtensive coupled tectonic system in the basin (Beaudoin et al., 1986; Friès, 1987; Graciansky and Lemoine, 1988; Joseph et al., 1989). The extensive tectonics may have been a consequence of the North Atlantic rifting (Graciansky and Lemoine, 1988), but the transtensive component indicates a more probable influence from the opening of the Bay of Biscay (Souquet, 1978; Ricou and Frizon de Lamotte, 1986; Joseph et al., 1989; Hibsch et al., 1992), as a consequence of anti-clock-wise rotation of the Iberian Plate (Ziegler, 1990; Stampfli
et al., 1998). The basin morphology and sedimentation
patterns were controlled by the tilted blocks (Friès and Parize, 2003). This structural control resulted in very dif-ferent thicknesses of sediments being deposited at differ-ent locations in the Vocontian Basin. At the Aptian–Albian transition, the Provence Platform was uplifted, which re-sulted in the emersion of the so-called Durancian Isthmus (Gignoux, 1925; Rubino, 1989; Hibsch et al., 1992; Masse
et al., 2000). On a larger scale, the first signs of
comsion have been dated as Cenomanian, based on the pres-ence of a significant unconformity in the Vocontian Basin (Friès, 1987; Hibsch et al., 1992), although a recent study has proposed that the closure of the Vocontian Basin could have started during the so-called ‘Austrian Event’ in
K E Y W O R D S
Clay minerals, Early Aptian, geochemistry, grain size, organic matter dilution, organic matter, palaeo-redox proxies, turbidites
Western Europe (Bénard et al., 1985; Ziegler, 1990) at the Aptian–Albian boundary (Ferry, 2017). Following this, the Vocontian Basin progressively closed, with the formation of the Pyrenees occurring during the Eocene and the Alps during the Miocene (Baudrimont and Dubois, 1977).
The Vocontian Basin recorded carbonate sedimentation during the Upper Jurassic and Early Cretaceous, but during the Aptian–Albian, terrigenous-dominated sedimentation took place (Friès, 1987; Rubino, 1989; Bréhéret, 1997), giving rise to the marl-dominated hemipelagic facies of the Marnes Bleues Formation that lies stratigraphically above the Barremian/Bedoulian carbonates in the deep part of the Vocontian Basin (Friès, 1987; the Bedoulian being a regional stratigraphic term, corresponding to part of the Lower Aptian). The Marnes Bleues Formation is mainly composed of dark grey marls with low OM content (0.5% on average), with several organic-rich levels (total organic carbon [TOC]>1.5 wt%) and some carbonate horizons (Tribovillard, 1989; Bréhéret, 1997). Numerous reworked deposits occur, such as slumps, massive sandstones, turbid-ites and debris flows, being mainly localized in the north-west part of the basin (Friès, 1987; Rubino, 1989; Friès and Parize, 2003). The thickness of the Marnes Bleues Formation is between ca 650 and 800 m (Friès, 1987; Bréhéret, 1997), and the Aptian sediments are 300 m thick. The biostratigraphic framework has been established based on ammonites and foraminifera (Friès, 1987; Bréhéret, 1997; Dauphin, 2002). According to the planktonic and benthic foraminifera biostratigraphy, and palaeodepth esti-mates deduced from reworked deposit geometries, the pa-laeobathymetry during the Aptian was estimated to reach
ca 100 m on the platforms (Arnaud-Vanneau and Arnaud,
1991), and between 500 and 1,500 m on the margin slopes (Beaudoin and Friès, 1984; Arnaud-Vanneau and Arnaud, 1991). During the Albian, the water depth decreased, while the deep part of the basin narrowed, due to the uplifted Provençal Platform as evoked above (Masse and Philip, 1976; Hibsch et al., 1992) coupled with uplift of the west-ern part of the basin (Dauphiné and Vivarais Platforms, Ferry, 2017).
3
|
THE OAE 1A AND ITS
EXPRESSION IN THE VOCONTIAN
BASIN
3.1
|
General considerations concerning the
Early Aptian OAE 1a
The Mesozoic was a time of several major perturbations of the ocean-atmosphere system (Schlanger and Jenkyns, 1976; Jenkyns, 2010). Lasting a relatively short (geological) time (several kyr to a few Myr), OAEs have been related to: (a) intense greenhouse climate conditions; (b) oxygen depletion (reaching anoxic–euxinic conditions) in marine intermediate and/or bottom water masses; and (c) deposition of organic-rich sediments (shales and black shales) in marine hemipe-lagic to pehemipe-lagic environments (Schlanger and Jenkyns, 1976;
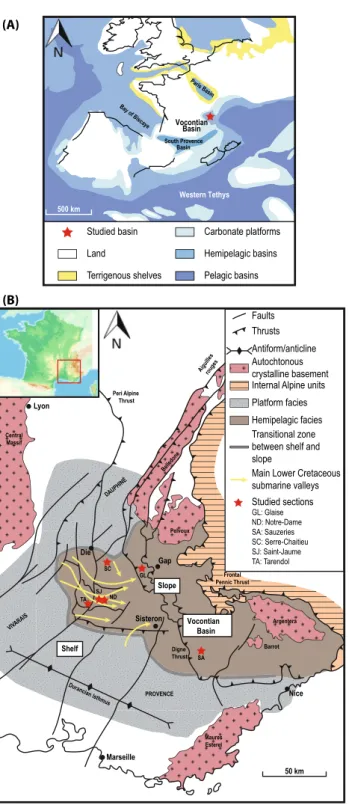
FIGURE 1 (A) Aptian palaeogeographical map of the western Tethys (in Stein et al., 2012, modified from Masse et al., 2000); (B) Map of the geological context of the Vocontian Basin during Aptian times. The regional settings, main platform limits, submarine valleys and studied sections are displayed (modified from Friès and Parize, 2003) Paris Ba sin South Provence Basin VocontianBasin 500 km Western Tethys Studied basin Land Terrigenous shelves Carbonate platforms Hemipelagic basins Pelagic basins Slope Vocontian Basin Argentera Pelvoux Central Massif Barrot Digne Thrust Maures Esterel Durancia n Isthmus Shelf Frontal Pennic Thrust Peri Alpine Thrust Aiguille s rouges Belledon e PROVENCE VIVARAI S DAUPHINÉ Nice Marseille Gap Sisteron Die Lyon 50 km Antiform/anticline Faults Thrusts Transitional zone between shelf and slope
Platform facies Internal Alpine units Autochtonous crystalline basement
Main Lower Cretaceous submarine valleys Hemipelagic facies (B) (A) Studied sections GL: Glaise ND: Notre-Dame SA: Sauzeries SC: Serre-Chaitieu SJ: Saint-Jaume TA: Tarendol GL ND SJ SA SC TA Bay of Biscaye
Arthur and Schlanger, 1979; Arthur et al., 1988; Bralower
et al., 1994; Jenkyns, 1999; 2010).
Sedimentation during the Early Aptian was disrupted by the OAE 1a also known as ‘the Selli Episode’ (Coccioni
et al., 1987; Arthur et al., 1990; Bralower et al., 1993; Föllmi,
2012). It is now accepted that short phases of exceptional-ly-intense volcanic activity, accompanying the Ontong Java Plateau Large Igneous Province emplacement in the Western Pacific Ocean, triggered a period of extreme global warming and initiated the OAE 1a (Arthur et al., 1985; Méhay et al., 2009; Tejada et al., 2009; Charbonnier and Föllmi, 2017). Significant biogeochemical changes accompanied the OAE 1a (Föllmi, 2012; Westermann et al., 2013). Prior to the onset of the event, the shallow-water environments on the Tethyan margins were marked by a progressive decline in carbonate production (Föllmi et al., 1994, 2006; Weissert et al., 1998; Huck et al., 2011; Masse and Fenerci-Masse, 2011; Pictet
et al., 2015) or by massive occurrences of microbialites
(Immenhauser et al., 2005; Huck et al., 2011; Bonin et al., 2016). Moreover, calcareous nannofossil data may indicate acidification of the ocean during the OAE 1a (Erba, 1994; Bralower et al., 1999; Erba et al., 2010; but, see Gibbs et al., 2011). On the other hand, ‘typical’ black shales (laminated, dark-coloured, OM-rich claystones) were deposited in hemi-pelagic and hemi-pelagic environments in numerous locations around the world (see synthesis in Föllmi, 2012). The unfold-ing of the OAE 1a was favoured by a globally transgressive sea level (Haq et al., 1987; Rubino, 1989; Bréhéret, 1997; Haq, 2014), although a short-lived sea-level fall during the OAE 1a has been proposed (Friès and Parize, 2003; Föllmi, 2012).
From the whole-rock δ13C record of the Cismon section
and borehole (central Italy), which is the reference site for OAE 1a deep-water deposits (Weissert et al., 1985; Erba, 1994), the Early Aptian isotope record has been divided into eight segments (C1–C8, Menegatti et al., 1998; Erba et al., 1999). The OAE 1a is characterized by a short negative δ13C
excursion (C3 segment, Menegatti et al., 1998), followed by a long, flat positive excursion (Weissert, 1981; Menegatti et al., 1998), supporting intensified volcanic activity as the main trigger of this global carbon cycle perturbation (Menegatti
et al., 1998; Méhay et al., 2009). The onset of OAE 1a has
been placed at the beginning of the decrease in δ13C, which
corresponds to a change in the marine flora and fauna (C4
p.p. segment to C6 p.p. segment, Bralower et al., 1999; Erba et al., 1999; Méhay et al., 2009; Föllmi, 2012). The
biostra-tigraphic data have been debated, particularly the ammonite biostratigraphy. In most studies, the negative and following positive δ13C excursion correspond to the Deshayesites de-shayesi ammonite zone (Bréhéret, 1997; Moullade et al.,
1998a; Föllmi, 2008, 2012; Masse and Fenerci-Masse, 2011) More recently, the oldest Deshayesites weissi ammonite zone (also called Deshayesites forbesi in Reboulet et al., 2014)
has been proposed as the datum for the onset of the OAE 1a (Moreno-Bedmar et al., 2009; Malkoc et al., 2010; Frau
et al., 2017). The biostratigraphy of OAE 1a is more precisely
identified by the Globigerinelloides blowi foraminiferal zone and the Chiastozygus litterarius nannofossil zone (Bréhéret, 1997). Recent astronomical calibrations have estimated the duration of OAE 1a as being between 1.1 Myr (Malinverno
et al., 2010, C4 p.p. segment to C6 p.p. segment of Menegatti et al., 1998, in the reference core of the Cismon borehole) and
1.4 Myr (Huang et al., 2010, in the Piobbico core, Central Italy).
3.2
|
Overview of the historical ‘GL’
through the literature
In the deeper parts of the Vocontian Basin (lower slope envi-ronment), the GL corresponds to an interval of dark, marly, laminated shales, interbedded with homogeneous, dark, marly shales to marls, dated as Lower Aptian (Bréhéret, 1997). In detail, it corresponds to six horizons of dark, marly, laminated shales (GO 1–GO 6, hereafter called ‘laminated horizons’), rich in OM (TOC up to 5 wt%), each laminated horizon being several centimetres to a metre thick (Bréhéret, 1997). In the literature, these laminated horizons are termed ‘black shales’ (Friès, 1987; Heimhofer et al., 2004; 2006; Okano et al., 2008; Ando et al., 2017) or ‘paper shales’ (Bréhéret, 1994). The GL is synchronous throughout the Vocontian Basin, and the laminated horizons are interbed-ded with gravity deposits at numerous locations (see below, and also Friès, 1987; Bréhéret, 1997; Friès and Parize, 2003). Recently, the GL was correlated to the OAE 1a based on chemostratigraphic data from the Serre-Chaitieu and Glaise sections (Heimhofer et al., 2004; Westermann et al., 2013). Moreover, the GL is transgressive over the underlying sedi-ments dated as Bedoulian (Lower Aptian pro parte; Rubino, 1989). A detailed framework of the GL, and of its six hori-zons (GO 1–GO 6), has been established within the complete, well-preserved Sauzeries section (Bréhéret, 1997, p. 43, and Figure 2). Few complete, entire, well-preserved successions are observed in the Vocontian Basin; however, the GO 5 ho-rizon is recognizable across all the sections (Bréhéret, 1997). The thickness of the GL can vary from 4.3 m in a section without gravity deposits (the Sauzeries section, Figure 2) to about 17 m when gravity deposits are present (turbidites and slumps in the Saint-Jaume section, Figure 1; Bréhéret, 1997; Friès and Parize, 2003). The sections cited below are shown on Figure 1.
In the proximal parts of the Vocontian Basin (proximal slope environment), the GL was deposited only on the west-ern border, interbedded with thin turbidites (Rubino, 1989; Bréhéret, 1997). On the platform, due to intensive currents (Cotillon, 2010), there is no sediment corresponding to the
FIGURE 2 (A) Sauzeries section with the well-preserved six horizons of the GL (GO 1–GO 6). (B) Sauzeries log-section (from Bréhéret, 1997). (C) Example of the lithology in one laminated horizon of the GL, the GO 4 level (picture from Bréhéret, 1997). (D) Example of the GL interbedded with thin turbidites, Dame section. (E) Tb and Tc members (sensu Bouma, 1962) of a thin turbidite within the GL in the Notre-Dame section, showing a normal grading with the gradual transition between planar and convolute laminations, pencil = 15 cm. (F) HI-Tmax diagram showing the typology of the OM in the GL (diagram from Espitalié et al., 1985; data from Bréhéret, 1997)
2 m Lower part of the Goguel Level
interbedded with turbidites
Hydrogen index (mg HC/g
TO
C)
Oil window
Immature Gas window
Tmax (°C) 400 420 440 460 480 500 520 0 150 300 450 600 750
Data from Bréhéret (1997) >5 0–0.5 0.5–1 1–1.5 1.5–2 2–2.5 2.5–3 3–5 TOC (wt%) Massive marl
Faintly laminated black shales Laminated black shales Bedoulian carbonates (slump)
GO 1 CL 3 GO 2 GO 3 GO 4 GO 5 GO 6 1 m 2 cm CL 3 GO 1 GO 2 GO 3 GO 4 GO 5 GO 6 1 m (F) (D) (A) (B) (C) (E)
GL, and the OAE 1a has been interpreted as being repre-sented by a hiatus (Frau et al., 2017), with a few phosphatic remains of ammonites in the Nice area possibly recording the OAE 1a (Bréhéret, 1997). Near Marseille, the GL corre-sponds to homogeneous grey marls ca 10 m thick (Cassis-La Bédoule section, Moullade et al., 1998b; Stein et al., 2012).
The GL contains few macrofossils (rare ammonites and fish fragments), but is rich in foraminifera (Bréhéret, 1997). According to Bréhéret (1997 and references therein), the GL pertains to the D. deshayesi ammonite zone and the G. blowi planktonic foraminifera zone, although this time interval is poorly constrained in the Vocontian Basin. Moreover, the upper part of the GL is marked by the base of the Rhagodiscus
angustus calcareous nannofossil subzone (NC7A, Herrle and
Mutterlose, 2003) and by the top of the C. litterarius cal-careous nannofossil zone (NC6). With the exception of the laminated horizons, the sediments of the GL are intensely bioturbated by a low-diversity ichnofauna (dominated by
Chondrites with rare Planolites; Bréhéret, 1997). The
lam-inated horizons are rich in faecal pellets, with no benthic fauna (Bréhéret, 1997; Dauphin, 2002).
On average, the carbonate content in the Marnes Bleues Formation ranges between 25% and 35%. The lowest con-tents are in the GL, particularly in the marls hosting the lam-inated horizons (10%–15% after Bréhéret, 1997; 12%–36% after Heimhofer et al., 2004). The poor preservation of bio-clasts (calcareous nannofossils and foraminifera) and the low planktonic foraminifera content (compared to the rest of the Marnes Bleues Formation) likely account for the low car-bonate content. The decrease in carcar-bonate production in the Vocontian Basin has been attributed to a change in the oce-anic environment (Bréhéret, 1997).
The GL contains 30%–50% clay-sized grains (<2 μm, Bréhéret, 1997). The clay mineral distribution in the terrige-nous fraction is dominated by illite, smectite and illite–smec-tite mixed-layer minerals. According to various authors, the proportions of these clay minerals are variable, each repre-senting 20%–30% of the <2 μm fraction (Deconinck, 1984; Bréhéret, 1997; Ghirardi et al., 2014). Kaolinite and chlorite represent less than 10% each of the fine-grained fraction.
Redox-sensitive elements (Mo, U, Cr and Co; Westermann
et al., 2013) yield a very moderate enrichment relative to
the post-Archean average shale values in the Glaise section (Taylor and McLennan, 1985). Productivity proxies (Ni, Cu) also indicate a slight enrichment during the GL (Westermann
et al., 2013). Moreover, U-Mo covariations have been
inter-preted as corresponding to an unrestricted suboxic marine en-vironment. Furthermore, the discovery of a Ce anomaly (Ce/ Ce*) in the Glaise section supports low-oxygenation condi-tions during deposition of the GL (Bodin et al., 2013).
According to the literature (Tribovillard, 1989; Bréhéret, 1994; 1997; Heimhofer et al., 2004, 2006; Westermann et al., 2013; Ando et al., 2017), the TOC of the GL fluctuates between
0.5 and 5 wt%. For the laminated horizons (GO 1–GO 6), the contents range between 2 and 5 wt%. The Hydrogen Index (HI) reaches up to 500 mgHC/gTOC, ascribing the GL OM to Type-II kerogens (marine OM field) in a HI-Tmax diagram (Figure 2, Espitalié et al., 1985). The Tmax values of the GL samples vary (420–440°C, Bréhéret, 1997; Westermann
et al., 2013), but they indicate in a HI-Tmax diagram that
the OM is in an immature state (Figure 2). In the Cassis-La Bédoule section, the TOC values are very low (<0.5 wt%; Stein et al., 2012), and the OM is ascribed to Type-III ker-ogens (terrestrial OM field); because of the very low TOC, the HI cannot be taken into account in a HI-Tmax diagram (Espitalié et al., 1985). Molecular biomarker analysis of the GL OM from the Serre-Chaitieu section has indicated a sig-nificant contribution from marine algal-bacterial OM, based on the distribution of linear alkanes (n-alkanes) and tetra and pentacyclic terpanes (Heimhofer et al., 2004). These authors suggested a minor contribution of terrestrial OM based on the low abundance of long-chain n-alkanes. A study of the palynofacies of the Serre-Chaitieu section revealed that the GL was mainly composed of marine-derived OM (Heimhofer
et al., 2006). The kerogens of the laminated horizons are
con-stituted of approximately 95% highly fluorescing amorphous OM, while the host dark marls contain 70%–80% amorphous OM (Heimhofer et al., 2006). Phytoclasts represent 40% of the particulate OM, and abundant small (<20 μm), equidi-mensional phytoclasts, coupled with small, oxidized frag-ments and charcoal debris, indicate that terrestrial OM only slightly contributes to the total OM deposited in this quiet and distal environment (Heimhofer et al., 2006). These envi-ronmental observations are consistent with the predominance of dinoflagellate cysts in the kerogen extracts (Heimhofer
et al., 2006). Furthermore, the unchanged colour of the
paly-nomorphs, and the moderate to high UV fluorescence of the amorphous OM and palynomorphs, confirm the low maturity of the OM in the GL (Heimhofer et al., 2006).
According to numerous authors (Friès, 1987; Rubino, 1989; Bréhéret, 1997; Friès and Parize, 2003; Westermann
et al., 2013), the GL is partly reworked (slump ß of Friès,
1987; Friès and Parize, 2003), or is interbedded with mil-limetre to multi-centimetre thick turbidites (P1 turbidites of Rubino, 1989). Slump ß is 10 m thick over an area of 40 km2
(Friès and Parize, 2003). The P1 turbidites correspond to ‘classical’ turbidites (sensu Bouma, 1962), according to the study of Friès and Parize (2003) (Figure 2). They are mainly composed of Tb to Te members (Friès and Parize, 2003, Figure 2). The P1 turbidites are metre-thick packages and are distributed over 80 km along the ancient margin (Rubino, 1989; Friès and Parize, 2003). The submarine canyons filled by these turbidites had a width of a few hundred metres (Friès and Parize, 2003). The turbidites correspond to the destabili-zation of a small amount of sand stored on the platform during the global sea-level transgression associated with the OAE 1a
(Rubino, 1989; Bréhéret, 1997). For a long time the turbid-ites have been closely associated with the GL (Friès, 1987; Rubino, 1989; Bréhéret, 1994, 1997) and are interbedded within the homogeneous, dark, marly shales to marls, or lie just above the laminated horizons, but never at the base of, or within these laminated horizons (Bréhéret, 1997). Moreover, according to Bréhéret (1997): (a) the enrichment and quality of the OM observed in the sections is similar, with or with-out turbidites and (b) the laminated horizon GO 5, which is the most widely represented in the basin, has approximately the same expression and thickness at several basin locations, with or without turbidites. These observations suggest that the turbidites did not trigger the deposition or enrichment of the OM content of the GL (Bréhéret, 1997); it was only tur-bidity currents disturbing the settling of fine particles in this quiet pelagic environment (Bréhéret, 1997).
Previous studies allowed the depositional conditions to be constrained for the GL. Several parameters indicate suboxic to anoxic conditions for the laminated horizons: (a) the oc-currence of undisturbed laminations, and therefore the lack of bioturbation (Bréhéret, 1997); (b) the lack of a benthic fauna in the laminated horizons (Bréhéret, 1997); (c) an ich-nofauna dominated by Chondrites, characteristic of a quiet environment with low oxygenation (Bréhéret, 1997); (d) the distribution of redox-sensitive trace elements and a Ce anom-aly (Bodin et al., 2013; Westermann et al., 2013); (e) the good preservation of marine-derived OM, and the abundance of highly fluorescent amorphous OM in the palynofacies (Heimhofer et al., 2006).
In addition to the oxygenation conditions, OM enrichment of the GL could have been impacted by the sedimentation rate (SR). Thus, condensation seems to be one of the key factors responsible for OM enrichment during sedimentation of the GL (Bréhéret, 1994, 1997; Heimhofer et al., 2006). The role of condensation is highlighted by the high TOC correlated with: (a) peaks in carbonate content (indicating reduced influx of land-derived particles, Bréhéret, 1994); (b) peaks in palyno-morph abundances in the palynofacies (indicating weak hydro-dynamism in the transport of particulate OM, Heimhofer et al., 2006); and (c) low SRs (Westermann et al., 2013).
In summary, the sedimentation and preservation of OM in the GL are related to a global sea-level transgression (Haq et al., 1987; Haq, 2014; confirmed by regional stud-ies; Rubino, 1989; Bréhéret, 1997; Ferry, 2017), with gen-erally low oxygenation of the deep-water mass (Bréhéret, 1997; Heimhofer et al., 2006; Westermann et al., 2013), cou-pled with a significant period of sedimentary condensation (Bréhéret, 1997; Heimhofer et al., 2006).
Nevertheless, some problems limit the understanding of the depositional environments of the GL. First, what was the primary factor that induced OM enrichment in the GL? For some authors (Bréhéret, 1997; Heimhofer et al., 2006), primary productivity was not the key factor (it was instead
condensation coupled to anoxia), whereas Westermann et al. (2013) attributed a significant role to surface-water produc-tivity, especially as a precursor to the OAE 1a. Second, the impact of possible climate change on the Vocontian Basin is still under debate. Several studies agreed that higher tempera-tures and humidity existed during deposition of the GL (Stein
et al., 2012; Bodin et al., 2013; Westermann et al., 2013;
Ghirardi et al., 2014), involving increased runoff, although this seems to be inconsistent with the period of condensation observed in the basin. Contrarily, other studies have proposed that there was no major climate change during deposition of the GL (Bréhéret, 1997; Heimhofer et al., 2004). Although major climate change has been hypothesized for the Tethys Ocean during the Early Aptian OAE 1a (Föllmi, 2012 and references therein), its expression was perhaps less percepti-ble in the Vocontian Basin. Third, oxygenation conditions in the basin during the OAE 1a must be better defined. In order to improve the depositional model of the GL four sections, located in contrasting palaeo-settings in the Vocontian Basin, were analysed using a multi-proxy approach.
4
|
MATERIALS AND METHODS
4.1
|
Sampling and sections
For this study, 77 samples were analysed from six sections in the Marnes Bleues Formation. Thirty-two samples of the GL (ending with the suffix ‘-g’) were taken from four sections. These sections were situated at different locations in the Vocontian Basin: the Saint-Jaume and Notre-Dame sections are on the palaeo-upper slope, while the Glaise and Sauzeries sections correspond to the palaeo-lower slope of the basin (Figure 1). In order to facilitate interpretation and char-acterization of the GL, 45 samples of the so-called Aptian Hemipelagites (AHs; ending with ‘-h’) were collected. These hemipelagites correspond to the background sedimentation in the Vocontian Basin during the Aptian.
The Glaise section (Figure 1, WGS 84 coordinates: 44°34′07.2″N, 5°49′01.6″E) is located about 20 km west of the city of Gap, in Veynes town. There, the GL is represented by a 12.7 m thick interval, interbedded with centimetre-scale tur-biditic layers, underlying the marly limestone beds at the top of the section (Bréhéret, 1997). The Sauzeries section (Figure 1, 44°02′01.1″N, 6°21′28.4″E) is located in the town of Clumanc,
ca 10 km south-east of the city of Digne-les-Bains. There, the
GL is 4.3 m thick (Bréhéret, 1997). The Saint-Jaume section (Figure 1, 44°22′59.9″N, 5°26′17.9″E) is located ca 20 km east of the city of Nyons, in the town of Verclause. At the base of a thick marly section (>150 m), the GL is interbedded with nu-merous centimetre-scale turbiditic layers within slump ß, over a thickness of 17 m (Bréhéret, 1997; Friès and Parize, 2003). The Notre-Dame section (Figure 1, 44°23′30.7″N, 5°29’58.3″E) is
located in Saint-André-de-Rosans, ca 25 km west of the city of Serres; however, only the base of the GL was observed there, interbedded with centimetre-scale turbiditic layers (example on Figure 2; Friès and Parize, 2003). Because the GL thickness has not been determined, no SR has been calculated for this sec-tion; nevertheless, the thickness is at least greater than 5 m. The Serre-Chaitieu section (Figure 1, 44°35′24.0″N, 5°32′00.2″E) is located in Lesches-en-Diois ca 40 km west of the city of Gap, and the Tarendol section (Figure 1, 44°21′08.0″N, 5°20′44.4″E) is located in Bellecombe-Tarendol, ca 15 km east of the city of Nyons. Although the GL occurs in these sections, only the AHs were sampled.
For each sample, 500 g to 1 kg of rock were collected. To avoid contamination of the sediment by plastic or cardboard, the samples were stored in aluminium foil. Considering the SRs and duration of the GL (see below), each of these relatively thick samples correspond to several thousand years of sedi-mentation, contrary to existing highly accurate studies on the timing and environmental changes occurring during the OAE 1a (Menegatti et al., 1998; Erba et al., 1999, 2015; Heimhofer
et al., 2004; Bottini et al., 2015; Giraud et al., 2018).
4.2
|
Grain-size analysis
Grain-size analysis was performed on the carbonate-free fraction of 76 samples, using a Malvern Mastersizer 2000®
laser diffractometer, at the Laboratoire d’Océanologie et de Géosciences (LOG) of Lille University, following the classical protocol detailed in Trentesaux et al. (2001). The uncertainty in the values is ca 5% (Sperazza et al., 2004), and for the finest grain sizes—clay-sized particles of <5 μm—the apparatus slightly minimizes the abun-dance (by a few %) according to the manufacturer. The grain-size scale used is clay (<2 μm), fine or cohesive silt (2–10 μm), coarse or non-cohesive silt (10–63 μm) and sand (63–2,000 μm). According to McCave et al. (1995), silts (2–63 μm) should be separated based on the behaviour of the particles—if they are thinner than 10 μm, they be-have in a similar manner as clay (cohesive silts), whereas silts coarser than 10 μm (sortable silts) behave as single particles, influenced by hydrodynamic forces during ero-sion and deposition (non-cohesive particles). Coarser silts were used as current-strength indicators (McCave et al., 1995). Lastly, the fraction below 2 µm (and not 4 µm) was considered to be clay because the clay mineral assemblage determination was carried out on the <2 µm fraction.
4.3
|
Clay minerals
For the <2 μm terrigenous fraction, clay mineral assemblages were analysed in 77 samples using standard X-ray diffraction
protocol (Brucker D4 ENDEAVOUR apparatus in the LOG, Lille University) described in detail in Bout-Roumazeilles
et al. (1999). Semi-quantitative estimates of clay mineral
abun-dance, the Kübler Index (illite crystallinity) and the Esquevin Index (chemical weathering index) were all determined using MacDiff® 4.2.5 software, according the methodology
of Riboulleau et al. (2014). The Kübler Index is inversely proportional to the degree of metamorphism (Kübler, 1967; Kübler and Jaboyedoff, 2000). The Esquevin Index allows Al-rich illite to be differentiated from Mg-Al-rich illite (Dunoyer de Seconzac, 1969; Esquevin, 1969) and, therefore, may help to detect strong hydrolysis on an emerged source area that would favour the high proportion of magnesian illite mirrored by the high Esquevin Index. The relative margin of error for a semi-quantitative estimation was ±5% (Bout-Roumazeilles et al., 1999). In order to evaluate the possible relationship between the sedimentation of OM and the occurrence of clay minerals, the proportions of clay minerals in the sediments were esti-mated using the following formula:
4.4
|
Rock-Eval
Seventy seven samples were evaluated using Rock-Eval 6®
pyrolysis (see Behar et al., 2001 for details) at the Sorbonne Université (ISTeP, Paris). The TOC (wt%), HI (mg HC/g TOC), oxygen index (OI, mg CO2/g TOC) and Tmax
(°C, indicator of OM thermal maturity) were determined. According to Espitalié (1993), Rock-Eval pyrolysis param-eters allow the type and thermal maturity of bulk OM to be typified. Bearing in mind that the carbonate fraction of the Marnes Bleues Formation is mainly calcite (Bréhéret, 1997), the total carbonate content (CaCO3, in %) was calculated
from the Rock-Eval MinC (%), using the formula of Jiang
et al. (2017):
4.5
|
Elemental analysis
Major and trace element contents of the Glaise (p.p.) and Sauzeries sections (24 samples) were determined at the University of Lausanne (ISTE-UNIL laboratory) using X-ray fluorescence spectrometry, according to the protocol detailed in Montero-Serrano et al. (2015). The detection limits were <0.01 wt% for major elements, and between 1 and 5 ppm for trace elements. The accuracy of the analysis was checked by the analysis of standard reference materials.
Bulk % clay mineral
= (% clay mineral in terrigenous clay fraction)
×(100 − CaCO3(%)
× (% clay fraction (< 2𝜇m) in the terrigenous fraction)) .
For the Notre-Dame, Glaise (p.p.), Saint-Jaume, Serre-Chaitieu and Tarendol sections (45 samples), major and trace element analyses were performed at Central Michigan University in the STARLAB Laboratory, using inductively coupled plasma mass spectrometry, and external calibration. Analytical precision, based on replicate analyses, was better than 8%, and detection limits were <1 ppb for the major ele-ments and <40 ppt for the trace eleele-ments.
In order to compare the distributions of elements among sections, enrichment factors (EFs) were calculated:
where X and Al are the concentrations of element X and Al (wt%), EFs are normalised using the elemental upper crust con-centrations of McLennan (2001) and, to minimize the effects of dilution by carbonate or biogenic silica, Al normalisation is commonly used (see Tribovillard et al., 2006 for explanations and limits). Detectable enrichment of an element above average upper crustal concentrations corresponds to an EF > 3, while a moderate to strong enrichment represents an EF > 10 (Algeo and Tribovillard, 2009).
In addition, a chemical weathering index—the Index of Alteration (IA)—was calculated. The IA is equivalent to the Chemical Index of Alteration (CIA, Nesbitt and Young, 1982), but, in carbonate-rich sediments (>30% carbonates), the CIA can give misleading data (Goldberg and Humayun, 2010). Thus, a compositional linear trend, as proposed by Von Eynatten et al. (2003), can be used as a CIA equivalent (Montero-Serrano et al., 2015):
This index avoids uncertainties concerning the necessary corrections for non-silicate phases, in particular carbonate and phosphate phases (Von Eynatten et al., 2003). An increase in IA values can be interpreted as more intense chemical weath-ering within the sediment-supplying, emerged source areas.
4.6
|
Average SR and total organic carbon
mass accumulation rates
According to Heimhofer et al. (2004), because the SRs calculated by Kößler et al. (2001) ranged between 3.0 and 3.5 cm/kyr in the lower part of the Upper Aptian (re-gardless of compaction rates), the SRs of the GL (which corresponded to a period of condensation) were probably between 2.0 and 2.5 cm/kyr; however, the SRs calculated from the Glaise section (0.67–2.3 cm/kyr, Westermann
et al., 2013) were probably less than 2.0–2.5 cm/kyr. The
method of Westermann et al. (2013) was used to calculate the SRs of the Glaise section, using a combination of δ13C
chemostratigraphy and orbital calibrations; the other sec-tions studied do not have δ13C data. However, it was
pos-sible to calculate an average SR where the GL was entirely present in the outcrop (which is the case for the Glaise, Saint-Jaume and Sauzeries sections) using the orbital calibrations of Malinverno et al. (2010). The Early Aptian OAE 1a is estimated to have lasted for 1.11 ± 0.11 Myr (Malinverno
et al., 2010). The average SRs were calculated by:
where the thickness of GL was measured in centimetres and the duration of OAE 1a was estimated to be 1,110 kyr (Malinverno
et al., 2010). In the Serre-Chaitieu section, the average SR of
the AHs samples in the Fallot interval, which corresponds to numerous bundles of two or three horizons of dark marlstones in the Upper Aptian (Bréhéret, 1997; Dauphin, 2002), was cal-culated using the orbital calibrations of Huang et al. (2010).
In order to evaluate variations in organic carbon input, the TOC mass accumulation rate (TOC MAR) was calcu-lated following the approach developed by Westermann et al. (2013) for the Glaise section:
where the TOC values come from Rock Eval data, the rock den-sity is 2.3 and 2.4 g/cm3 for marlstones and siltstones,
respec-tively (Attewell and Farmer, 1976, marlstones if CaCO3 (%)>
35%), and the average SR was calculated using the previous formula. This useful accumulation rate was also calculated in the present study.
It is important to note that the intent of calculating these accumulation rates (average SR and TOC MARs) is to allow the sections to be compared amongst each other; any direct comparison with accumulation rates in modern environments, or other geological formations, is tricky because the compac-tion rate is not considered here in the average SR. In addicompac-tion, the duration of the GL was considered to be the same as the duration of the OAE 1a, because there is no precise dura-tion for the GL available in the literature (Westermann et al., 2013; Giraud et al., 2018).
4.7
|
Molecular biomarkers
Twenty-four samples were selected for biomarker analy-sis. Between 50 and 70 g of dry sediments were extracted using an azeotrope mixture of dichloromethane (DCM) and methanol (MeOH) 2:1 v/v, by means of a soxhlet extractor for 48 h. The resulting total extract was rotary-evaporated to dryness at a temperature not exceeding 50°C. The extracts were recovered with cyclohexane (maltenes), and separated
X
EF= (X∕Al)sample∕ (X∕Al)upper crust
IA = LN(Al2O3∕Na2O) , in molar proportions.
Average SR (cm∕kyr) = thickness of GL∕duration of OAE 1a,
TOC MAR (mg∕cm2∕kyr) = (TOC (wt%) × rock density (g∕cm3)
over an activated silica column, using cyclohexane (Cy) to recover the aliphatic fraction, a mixture of Cy/DCM 2:1 (v/v) to recover the aromatic fraction, and a mixture of DCM/MeOH 2:1 (v/v) to recover the most polar fraction.
Analyses were performed at the University of Lille, France (PC2A Laboratory UMR 8522 CNRS), by injecting 1 µl of extract into a gas chromatograph (Perkin Elmer 680) coupled with a mass spectrometer (Perkin Elmer 600C). The chromato-graphic conditions were: inlet heated to 250°C; DB5-MS-UI column initially at 40°C for 1 min, then heated to 320°C at 10°C/min, and maintained for 10 min at 320°C; and helium column flow of 1 ml/min, in split less mode. The mass spec-trometer conditions were: mass scan 45 e 500; scan time 0.2 s; interdelay scan 0.1 s; and ionization energy 70 eV. For the purpose of product semi-quantification, standard solu-tions of 2,2,4,4,6,8,8-heptamethylnonane, anthracene D10 and C29-nonadecanone (Dr. Ehrenstorfer-Shäfers, Augsbourg,
Germany) were used. The identification of compounds was based on comparison with the NIST mass spectra database and/ or comparison with retention times of standards and published data. Quantification was achieved by measuring the peak area of the compounds selected in several ion chromatograms.
5
|
RESULTS
All data are available upon request. Moreover, boxplots are used (Figure 3) in order to facilitate the comparison between the AHs and the GL.
5.1
|
Bulk organic matter
Rock Eval pyrolysis of the AHs display an average TOC of 0.6 wt% (ranging from 0.21 to 1.31 wt%), while the GL have a TOC ranging from 0.25 to 7.26 wt%, with an aver-age of 1.9 wt%. The moderate enrichment of OM in the GL, compared to the AHs, is also confirmed by the differ-ences in the S1 and S2 data: (a) 0.03–1.71 mg/g and 0.01– 0.10 mg/g respectively for S1; and (b) 0.21–37.76 mg/g and 0.16–1.99 mg/g respectively for S2. Moreover, the range of HI values in the GL (66–520 mgHC/gTOC, average of 275 mgHC/gTOC) are clearly higher than those of the AHs (27–209 mgHC/gTOC, average of 71 mgHC/gTOC), while the OI data are substantially higher in the AHs than in the GL (average of 63 mgCO2/gTOC and 23 mgCO2/gTOC,
respectively). The Tmax data of the GL (ranging from 425 to 441°C, average of 435°C) are slightly higher than those of the AHs (ranging from 425 to 436°C, average of 430°C). Because the majority of samples (76 out of 77) display a TOC > 0.3 wt%, the HI and OI parameters could be inter-preted in a HI-Tmax diagram (Figure 4, Espitalié et al., 1985). The AHs show predominantly Type-III kerogen
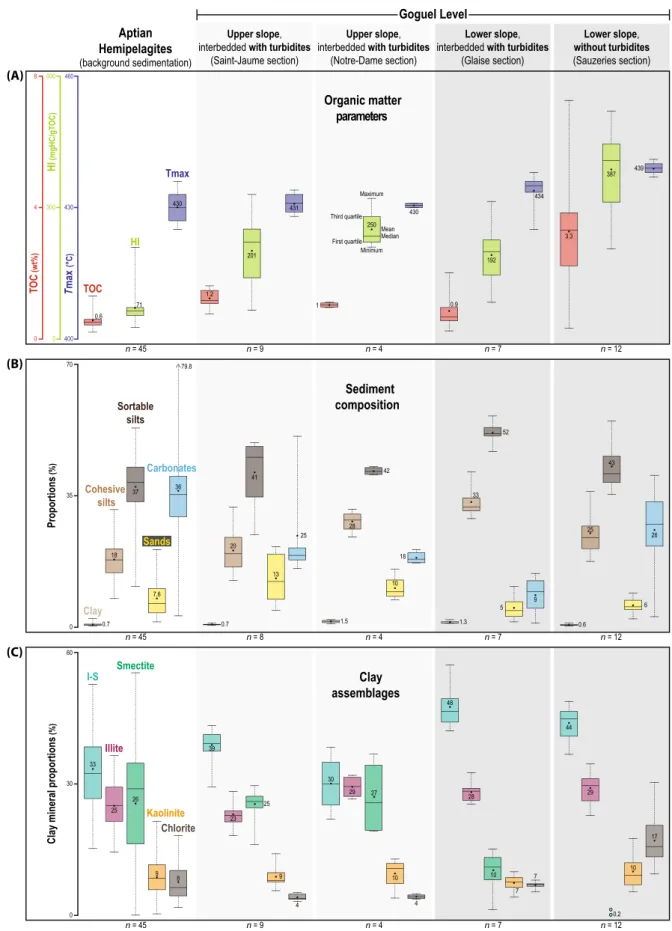
(terrestrial OM field), while the GL of the Saint-Jaume and the Glaise sections shows Type-II-III kerogens (mixed terrestrial-marine OM). In the Notre-Dame and Sauzeries sections, the GL exhibits distinctly type-II kerogens (ma-rine OM field). All the Tmax values indicate an immature stage to oil window stage for the kerogens. The carbonate contents are very variable (1%–80%), with an average of 21% in the GL and an average of 36% in the AHs.
In the GL, the TOC is relatively constant, except for the Sauzeries section (Figure 3). Indeed, the average TOC of the Sauzeries section (3.3 wt%) is three times higher than in the other sections (approximately 1 wt% on average). The same trend is observed for HI values that are higher in the Sauzeries section (387 mgHC/gTOC) compared to other sec-tions (around 200 mgHC/gTOC, Figure 3). The Tmax values are slightly higher in the distal sections than in the proximal sections. Furthermore, the carbonate contents are slightly higher in the Sauzeries section (26% on average, Figure 3) than in the other ones (average carbonate content in Saint-Jaume section is 25%, but skewed by one high value).
5.2
|
Grain-size
The sediments of the Marnes Bleues Formation mainly corre-spond to siltstones (carbonate content <35%) and marlstones (carbonate content >35%). The mode of the grain-size dis-tribution is very variable, ranging from 8 to 76 μm. The GL shows an average mode slightly lower than that of the AHs (24 and 33 μm, respectively, which cannot be accounted for by the organic-particle content with TOC values so low). In the GL and AHs samples, the distribution of particle sizes follows a unimodal normal distribution. The distribution of the grain-size classes is approximately the same for the two groups: 1% on average for clays; about 30% on average for the cohesive silts (33% for the GL, 29% for the AHs); a predominance of sortable silts (56% on average for the GL; 58% for the AHs); and about 10% on average for the sands (10% for the GL; 12% for the AHs). The difference between the two groups is observable within the bulk sediment frac-tion (terrigenous and carbonate fracfrac-tions). Indeed, the clay and the sand classes are the same for the two groups (<1% and 8%, respectively), but, on the other hand, the silt classes show some dissimilarity. Thus, the GL contains on average more cohesive and sortable silts (26% and 44%, respectively) than the AHs (18% and 37%, respectively).
The grain-size data within the GL show little variation. The silt content (cohesive and sortable) is higher in the Glaise section (85% on average) while the sand content of the distal sections is lower than that of the proximal sections (Figure 3). Moreover, the mode values of proximal sections are more scat-tered than those of distal sections (Figure 3). Lastly, no varia-tions were observed in the percentage of clay grade material.
FIGURE 3 Boxplots of (A) organic matter parameters; (B) sediment composition; (C) clay assemblages. The legend of boxplots is show in the HI boxplot of the Notre-Dame section. Boxplots of (D) Redox-sensitive elements; (E) Productivity-sensitive elements and index of alteration; and (F) Mode and accumulation rates. The legend of boxplots is show in the HI boxplot of the Notre-Dame section
Clay assemblages Tmax Clay Cohesive silts Sortable silts Carbonates I-S Illite Chlorite Smectite Kaolinite 400 max (°C ) 460 430 TOC HI HI (mgHC/gT OC ) 600 300 0 TO C (wt%) 8 4 0 0 Proportions (% ) 70 35 Sands 0
Clay mineral proportions
(% ) 60 30 Sediment composition Organic matter parameters Aptian Hemipelagites (background sedimentation) Upper slope,
interbedded with turbidites (Saint-Jaume section)
Upper slope,
interbedded with turbidites (Notre-Dame section)
Lower slope,
interbedded with turbidites (Glaise section) Lower slope, without turbidites (Sauzeries section) Maximum Minimum First quartile Third quartile Median Mean Goguel Level 0.6 1.2 1 0.9 3.3 71 201 250 192 387 n = 45 n = 9 n = 4 n = 7 n = 12 430 431 430 434 439 0.7 0.7 1.5 1.3 0.6 18 20 28 33 25 37 41 42 52 43 n = 45 n = 8 n = 4 n = 7 n = 12 7.6 13 10 5 6 36 25 18 9 26 79.8 33 39 30 48 44 25 23 29 28 29 26 25 27 10 0.2 n = 45 n = 9 n = 4 n = 7 n = 12 9 9 10 7 10 8 4 4 7 17 T (A) (B) (C)
15 5 Co Cr Mo U V Ba Cu Ni Zn Aptian Hemipelagites (background sedimentation) Upper slope,
interbedded with turbidites (Saint-Jaume section)
Upper slope,
interbedded with turbidites (Notre-Dame section)
Lower slope,
interbedded with turbidites (Glaise section) Lower slope, without turbidites (Sauzeries section) 0 15 0 Enrichment factors 10 5 10 0TO C MAR (mg/cm 2/kyr ) 120 Av erage SR (cm/kyr ) 7 3.5 0 Mod e (µm) 80 40 0 80 40 Mode Average SR TOC MAR Goguel Level
Ba, Cu, Ni and Zn enrichment factors
4.4
2.8 3.6
Index of
alteration (IA): Ln(Al
2O 3/N a 2 O) Productivity-sensitive elements and index of alteration IA Significant EF (Bac, Cu, Ni and Zn) Moderate to strong EF
(Ba, Cu, Ni and Zn) Significant EF Moderate to strong EF Mode and accumulation rates Redox-sensitive elements 35 33 23 17 21 n = 45 n = 8 n = 4 n = 7 n = 12 3.4 1.5 0.4 No SR and TOC MAR data
1.2 44 46 30 24 n = 45 n = 9 n = 7 n = 12 1.3 0.9 0.8 1 1.2 3 1.4 1.5 1.4 2.1 1.6 1.2 3 1.1 1.9 n = 43 n = 3 n = 4 n = 7 n = 12 1.7 1.4 1.6 1.2 2.2 3.48 3.38 3.27 3.3 3.61 0.9 0.8 0.8 0.7 0.8 1.3 1.3 1.3 1.1 1.4 1 0.7 1 1.1 5 15.8 n = 43 n = 3 n = 4 n = 7 n = 12 1.1 0.9 1.1 1.3 2.8 1.4 1.6 1.6 1.5 2.1 (D) (E) (F) FIGURE 3 continued
5.3
|
Clay minerals
The distribution of clay minerals is dominated by the illite-smectite mixed-layers (I-S; corresponding to irregular I/S R0 type interstratified clay minerals with more than 50% layers of smectite; Chamley, 1989), illite and smectite in decreas-ing proportions. The GL shows high contents of I-S (42% on average) and illite (average of 27%). In the same way, the AHs have high average contents of I-S (33%) and illite (25%). The main difference is observed in the average con-tents of smectite: 13% for the GL, against 26% in the AHs. However, the average value of the GL is clearly impacted by the lack of smectite in the Sauzeries section. In the other sections (Glaise, Notre-Dame and Saint-Jaume), the average content of smectite is 20%. Kaolinite and chlorite are present in low proportions (less than 10% on average within the GL and the AHs).
In the GL, an increase in the amount of illite is observed in distal sections (about 45% on average, Figure 3). Conversely, the smectite content decreases in the distal locations of the Glaise section (10% on average) and is essentially lacking in the Sauzeries section (only 2 samples with 2 and 0.4%). The I-S, kaolinite and chlorite contributions are constant between the sections, except for a peak of chlorite in the Sauzeries section (17% on average, Figure 3).
In order to evaluate the relative abundance of clay miner-als in the sediment, the clay mineral content of bulk sediment
has been calculated. Because the clay contribution is very small in the terrigenous fraction (<1%), the bulk proportions of I-S, illite and smectite minerals are extremely low (0.20%– 0.40% on average).
The average Kübler Index (0.32) and the average Esquevin Index (0.26) of the AHs are approximately equal to those of the GL samples (0.33 and 0.25, respectively).
5.4
|
Inorganic geochemistry
The major, minor and trace element concentrations deter-mined for the GL and the AHs are available upon request. The Fe/Al ratio ranges between 0.29 and 1.16, but the aver-age ratios of the GL and the AHs are similar (0.43 and 0.46 respectively, that is, very close to the average crustal value of McLennan, 2001). Similarly, the Ti/Al ratio, calculated to detect a hypothetical excess of aluminium compared to ti-tanium (detrital elemental proxy; Tribovillard et al., 2006), shows a constant value at 0.05 for the two groups of sam-ples. Most importantly, the EFs of Co, Mo, U, Ba, Cu and Zn in AHs exhibit some variability (Figure 3) which can be explained by the scattered positions of samples throughout the Aptian Marnes Bleues Formation.
The redox-sensitive elements (Co, Cr, Mo, U, and V) do not show any important variation, except for Mo. Indeed, the Mo EFs of the GL are higher than those of the AHs (average EF of 3.2 and 1, respectively), with an EF up to 16 in the GL (a laminated horizon within the Sauzeries section). It is important to emphasise that 12 samples (eight in the GL, four in the AHs) were below the detection limit for Mo concen-trations (1 ppm). The average EFs of U and V are slightly higher in the GL (close to 2) than those of the AHs (about 1). The average EFs of Co and Cr are the same in the two groups (close to 1). Within the GL, the redox-sensitive elements do not show enrichment (EF ca 1), except in the distal section of Sauzeries (Figure 3). Actually, the Mo EFs are higher (av-erage EF of 5), and the U and V EFs are slightly higher (2.8 and 2.1 on average, respectively) than those calculated in the other sections (Figure 3).
In the same way, the productivity-sensitive elements (Ba, Cu, Ni and Zn) exhibit a monotonous distribution, the aver-age EFs of Ba (ca 1), Ni (1-2) and Zn (<2) being similar for the two groups of samples. The average Cu EF is slightly higher in the AHs (3) than in the GL (ca 2). Within the GL, only a weak enrichment is observed in the Sauzeries sections for Ba, Cu, Ni and Zn (Figure 3).
The average IA exhibits somewhat distinct values between the AHs (3.61) and the GL (3.40). Within the GL (Figure 3), the two proximal sections, Saint-Jaume and Notre-Dame, show approximately the same average IA (3.3 and 3.27 re-spectively), whereas the Glaise and Sauzeries sections ex-hibit higher values (3.38 and 3.48, respectively).
FIGURE 4 HI-Tmax diagram showing the typology of the OM for the studied samples (diagram from Espitalié et al., 1985)
Hydrogen index (mgHC/gT
OC
)
Oil window
Immature Gas window
Tmax (°C) 400 420 440 460 480 500 520 0 150 300 450 600 750 Hemipelagites Glaise section Saint-Jaume section Notre-Dame section Sauzeries section >5 0–0.5 0.5–1 1–1.5 1.5–2 2–2.5 2.5–3 3–5 TOC (wt%) Typ e I Type II Type III Goguel Level
5.5
|
Average SR and total organic carbon
accumulation rates (TOC MARs)
Based on multiple literature references (see materials and methods), the average SRs calculated (Figure 3) were lower in the GL (0.4 to 1.5 cm/kyr) than in the AHs (3.4 cm/kyr). Moreover, the TOC MARs were the same between the AHs and the Saint-Jaume samples (44 and 46 mg cm−2 kyr−1,
re-spectively), while the TOC MARs in the distal positions were lower (24 and 30 mg cm−2 kyr−1 in the Glaise and Sauzeries
sections, Figure 3).
5.6
|
Molecular biomarkers
The m/z 57 fragmentogram of the saturate fraction from a representative sample is shown in Figure 5. It shows n-alkanes ranging from C12 to C37 presenting a unimodal
distribution and dominated by short chain n-alkanes with a maximum at C15 or C16. Slight odd/even predominance is
observed in n-alkanes with a carbon number higher than C23.
The carbon preference index (CPI) yields values between 0.67 and 1.10. The terrestrial versus aquatic ratio (TAR) presents values ranging between 0.96 and 1.35. A series of regular acyclic isoprenoids are observed in all samples. Norpristane (C18), pristane (Pr; C19) and phytane (Ph; C20)
are the dominant isoprenoids (Figure 5), with Pr being the most abundant in all of the studied samples. Stratigraphic variation of the Pr/Ph ratio presents values between 1.66 and 3.85. The Pr/ n-C17 values oscillate between 0.58 and
3.15 and Ph/n-C18 ratios between 0.37 and 1.43.
Selective ion chromatograms using m/z 109 + 123 + 179 + 193 show the distribution of bicyclic sesquiterpenoids
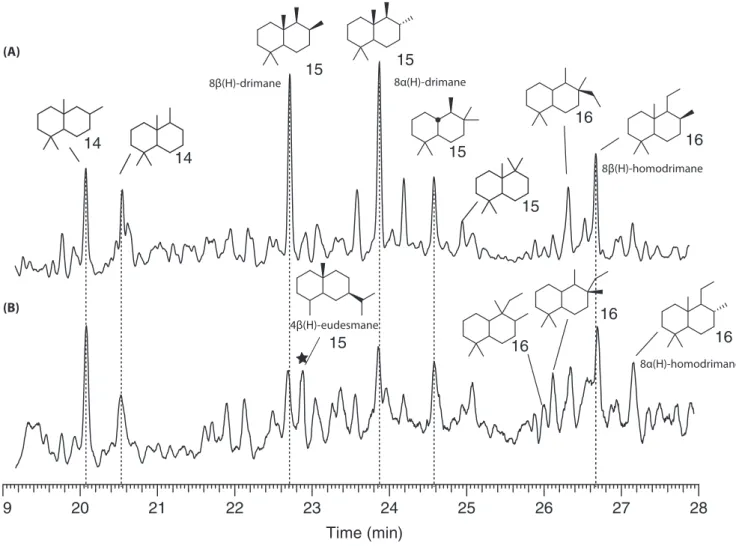
with series ranging from C14 to C16 in all samples. Figure
6 shows peak assignments for two representative samples, where 8α(H)- and 8β(H)-drimanes were clearly the most abundant compounds. Higher relative amounts of 4β(H)-eu-desmane were also detected in samples SJ OG 006-g and ND OG 001-g whiledrimanes are found in higher abun-dance relative to eudesmane in samples from the Sauzeries section.
Hopane distributions of the analysed samples were de-termined based on a m/z 191 ion chromatogram (Figure 7). A series of αβ-hopanes dominated by 17α(H),21β(H)-ho-panes (22R and 22S epimers) were observed in all sam-ples, showing homologues from C27 to C36 in samples from
the Sauzeries and Glaise sections. In the Notre-Dame and Saint-Jaume sections, these series present homologues only until C33. The proportion of C27, C29 versus C30 αβ-hopanes
are also variable between proximal and distal sections. A series of βα-moretanes (17β(H), 21α(H)-moretanes) were also detected ranging from C27 to C32, with a maximum at
C30 (Figure 7), C29-hopane was present in all of the
sam-ples. Diahopanes are also present in very low amounts, especially in samples from the Sauzeries section. Two gammacerane homologs (C29 and C30) were also observed
mostly in samples from the distal sections. Gammacerane is also observed in proximal sections but to a lesser ex-tent and restricted to the samples SJ OG 006-g and ND OG 004-g.
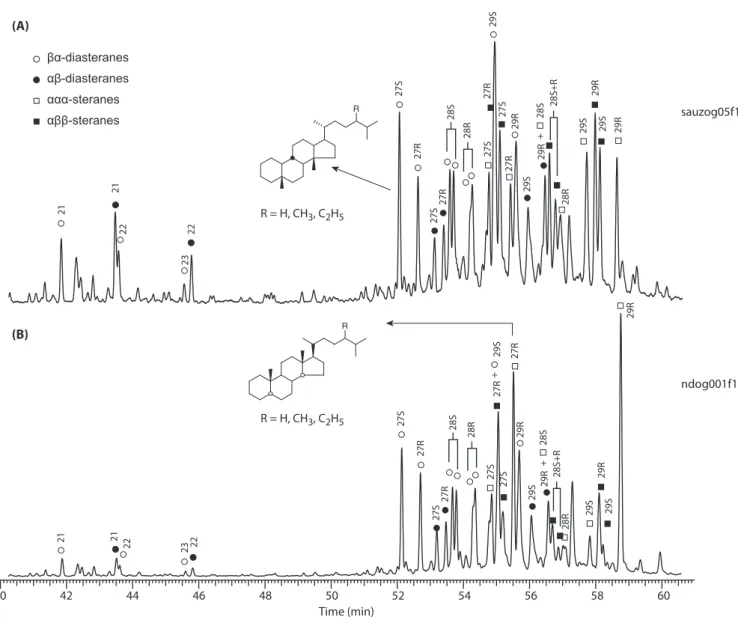
Steranes and diasteranes were detected in all the samples using the characteristic fragment at m/z 217 (Figure 7A,B). The proportion between regular steranes and diasteranes rep-resented by the Dia/(Dia + Reg) ratio is almost equivalent between samples showing mean values of 0.51. Steranes are dominated by the C29 5α(H),14α(H),17α(H)-20R regular FIGURE 5 Ion chromatogram m/z = 57 showing the n-alkanes (filled dots) and the regular isoprenoids (empty dots) of the aliphatic fraction from a representative sample (SAUZ OG 005-g). Numbers above symbols denote carbon number
5 10 15 20 25 30 35 40 45 50 55 60 65 70 75 80 20 15 15 17 18 16 30 35 25 Pr Pr Ph n-alkanes Isoprenoid alkanes Pristane Phytane Ph Time (min)
sterane (C29-sterane; Figure 8), followed by an important
contribution of the C27 isomer. Diasteranes are dominated
by the C29 βα-homologue. Additionally, short chain steroids
were also detected in low amounts.
Aromatic compounds are dominated by alkylnaphtha-lenes (methylnaphthaalkylnaphtha-lenes, MN; dimethylnapththaalkylnaphtha-lenes, DMN; trimethylnaphthalenes, TMN), alkylphenan-threnes (phenanthrene, P; methylphenantrenes, MP; trimethylphenanthrènes, TMP) and alkyldibenzofurans (Methyldibenzofuran, MDBF; dimethyldibenzofurans, DMDBF). Alkyldibenzofurans were detected using the ion chromatograms m/z 181 + 195+210. The selected ion chromatograms m/z 142 + 156+170 + 184 were used to calculate the maturity parameters from alkylnaphthalenes including the MNR, TMNr and TeMNr indices. For the alkylphenantrenes indices (MPR, MPI1 and MPI2) the se-lected ion chromatograms m/z 178 and 192 were used.
Monoaromatic and triaromatic steranes are also present in low amounts. Cadalene and isohexylnaphthalene are present in all samples also in trace amounts. Ion chromatogram m/z
133 + 134 shows the distribution of isorenieratene deriva-tives (aryl-isoprenoids) in four samples (SAUZ OG 002-g, SAUZ OG 004-g, SAUZ OG 007-g and SAUZ OG 009-g) ranging from C10 to C25 (Figure 9). These compounds are
absent from other sections.
6
|
INTERPRETATIONS
Even if the GL can be characterized by several analyti-cal techniques, it is difficult to unambiguously delineate a depositional environment for this part of the OAE 1a. In order to elaborate a depositional model for the GL in the Vocontian Basin the following points must be considered: (a) the possible impact of burial on the OM and the clay mineralogy; (b) the origin and intrinsic nature of the OM; (c) the impact of the SRs on the organic content; (d) the oxygenation conditions during the deposition of the GL; and (e) surface-water productivity during the OAE 1a in the Vocontian Basin.
FIGURE 6 Partial m/z 109 + 123 + 179 + 193 mass fragmentograms showing the distribution of bicyclic alkanes from aliphatic fractions of two representative samples: (A) SAUZ OG 001-g; (B) ND OG 004-g. Numbers next to the structures denote carbon number. The star symbol indicates eudesmane 19 20 21 22 23 24 25 26 27 28 Time (min) 14 14 15 15 15 15 15 16 16 16 16 16 8β(H)-homodrimane 8α(H)-drimane 8β(H)-drimane 4β(H)-eudesmane 8α(H)-homodrimane (A) (B)
6.1
|
Impact of burial
From the Rock-Eval data, the OM of the Marnes Bleues Formation shows low maturity (immature stage to onset of oil window in a HI-Tmax diagram, Figure 4), and the mo-lecular biomarkers support this. The distribution patterns of alkylnaphtalenes are dominated by low-maturity isomers, for example, 1,2,5,6-1,2,3,5-tetramethylnaphthalenes (TeMN) over 1,3,6,7-TeMN, showing ratios of <1 (van Aarssen
et al., 1999). Alkylphenanthrenes also show a similar trend,
with a distribution dominated by 9-methylphenanthrene over 1-methylphenanthrene (e.g. MPI1 < 1; Radke et al., 1986). Other biomarkers indicative of low maturity include the con-tribution of low-maturity hopane homologues (βα-moretanes; Peters et al., 2005; and references therein), the absence, or low abundance, of the high-maturity C27 hopane homologue
(Ts: 18α-22,29,30-trisnorhopane; Figure 7) and the relatively
low abundance of αββ-steranes over βα-sterane homologues (Figure 9; Seifert and Michael Moldowan, 1978).
The clay assemblages show a decrease (Glaise section) and a lack (Sauzeries section) of smectite in distal locations. Such variations suggest possible illitization of smectite into I-S during diagenesis. To test this hypothesis, a diagram of the Esquevin Index versus the Kübler Index (Kübler, 1967; Esquevin, 1969; Dunoyer de Seconzac, 1969; Kübler and Jaboyedoff, 2000) can be used to compare the burial of vari-ous sections (Figure 10). In this diagram, all samples (AHs and GL) fall into the 'anchizone’ for the Kübler Index and into the ‘biotite + muscovite’ zone for the Esquevin Index, indicating similar burial effects on all sections. However, the ‘anchizone’ deduced from illite crystallinity involves a higher burial than the OM results show. Thus, two possibilities can be envisaged for the illite origin: (a) neoformation of sediments during sig-nificant burial or (b) a detrital origin, with prior burial within
FIGURE 7 Representative fragmentograms (m/z = 191) showing the hopanoid distribution of two samples: (A) SAUZ OG 005-g; (B) SJ OG 006-g from the Goguel Level
30 30 30 31 32 29 29 29 29 29 29 30 30 31 31 32 33 31 S R S R S R S R S R S R S R 27 (Ts) 27 30 G 29 G 30 G 30 G 29 32 32 33 33 34 S R S R 28 28 28 27 (Tm) 27 (Tm) 29 18 -neohopanesα αβ-Hopanes Diahopanes βα-Hopanes Gammacerane G 35 36 26 26 26 26 17,21-sechopanes (A) (B)
another geological formation (Kübler and Jaboyedoff, 2000). If the smectite had been transformed into I-S during diagene-sis, the I-S/illite ratio (the two major components of the clay assemblages in the GL) would show increased burial for the distal sections, compared to the proximal sections. In fact, the average ratios of I-S/illite are relatively similar: 1.0 in the Notre-Dame section; 1.7 in the Saint-Jaume section; 1.7 in the Glaise section; and 1.5 in the Sauzeries section. Thus, there is no major variation in I-S in the clay assemblages that could be interpreted as the illitization of smectite minerals. The loss of smectite could be explained by contrasting clay source areas discriminating between proximal and distal sections. In addi-tion, the discrimination of clay-mineral source areas is consis-tent with the values of IA that differentiate proximal and distal sections. Another explanation (or a complementary one) is that a proportion of the smectite could have been transformed into chlorite during diagenesis (Tribovillard, 1989), which is
consistent with the high proportion of chlorite in the Sauzeries section (17% on average). These observations suggest a de-trital origin for the illite in the Vocontian Basin during the Aptian.
Thus, except for the smectite variations in the distal sec-tions, the clay minerals can be interpreted as being sedi-mentary signatures of what the emerged lands supplied to the basin. The weak imprint of diagenesis on the clay as-semblages is consistent with previous studies (Deconinck, 1984; 1987; Levert and Ferry, 1988; Ghirardi et al., 2014); however, diagenesis could have locally impacted the clay assemblages and the OM in the localities close to the Alpine Thrust Front in the eastern part of the Vocontian Basin (Levert and Ferry, 1988). From examination of the clay as-semblages (Levert and Ferry, 1987), the maximum burial depth in the western part of the basin was estimated to range between 500 and 1,000 m.
FIGURE 8 Representative fragmentograms (m/z = 217) showing the steroid distribution of two samples: (A) SAUZ OG 005-g; (B) ND OG 001-g from the Goguel Level
(A) (B) 27R 27 R 27R 29S 29S 29S 29R 29R 29S 29S 29R 28S 29R 27R 27S 27S 27S 28S 28R 27S 27S + + 28S+R 28R 27R 27R 27R 29S 29R 29R 29S 29S 29R 28S 29R 27R 27S 28S 28R 27S 27S + 28S+ R 28R βα-diasteranes αβ-diasteranes ααα-steranes αββ-steranes 21 21 21 21 22 22 22 22 23 23 R = H, CH3, C2H5 R = H, CH3, C2H5