HAL Id: insu-00914586
https://hal-insu.archives-ouvertes.fr/insu-00914586
Submitted on 5 Dec 2013
HAL is a multi-disciplinary open access
archive for the deposit and dissemination of
sci-entific research documents, whether they are
pub-lished or not. The documents may come from
teaching and research institutions in France or
abroad, or from public or private research centers.
L’archive ouverte pluridisciplinaire HAL, est
destinée au dépôt et à la diffusion de documents
scientifiques de niveau recherche, publiés ou non,
émanant des établissements d’enseignement et de
recherche français ou étrangers, des laboratoires
publics ou privés.
laboratory models applied to the Hellenides
Benjamin Guillaume, Laurent Husson, Francesca Funiciello, Claudio Faccenna
To cite this version:
Benjamin Guillaume, Laurent Husson, Francesca Funiciello, Claudio Faccenna. The dynamics of
laterally variable subductions: laboratory models applied to the Hellenides. Solid Earth, European
Geosciences Union, 2013, 4, pp.179-200. �10.5194/se-4-179-2013�. �insu-00914586�
Solid Earth, 4, 179–200, 2013 www.solid-earth.net/4/179/2013/ doi:10.5194/se-4-179-2013
© Author(s) 2013. CC Attribution 3.0 License.
EGU Journal Logos (RGB)
Advances in
Geosciences
Open Access
Natural Hazards
and Earth System
Sciences
Open AccessAnnales
Geophysicae
Open AccessNonlinear Processes
in Geophysics
Open AccessAtmospheric
Chemistry
and Physics
Open AccessAtmospheric
Chemistry
and Physics
Open Access DiscussionsAtmospheric
Measurement
Techniques
Open AccessAtmospheric
Measurement
Techniques
Open Access DiscussionsBiogeosciences
Open Access Open Access
Biogeosciences
Discussions
Climate
of the Past
Open Access Open Access
Climate
of the Past
Discussions
Earth System
Dynamics
Open Access Open Access
Earth System
Dynamics
DiscussionsGeoscientific
Instrumentation
Methods and
Data Systems
Open Access
Geoscientific
Instrumentation
Methods and
Data Systems
Open Access DiscussionsGeoscientific
Model Development
Open Access Open Access
Geoscientific
Model Development
DiscussionsHydrology and
Earth System
Sciences
Open AccessHydrology and
Earth System
Sciences
Open Access DiscussionsOcean Science
Open Access Open Access
Ocean Science
Discussions
Solid Earth
Open Access Open Access
Solid Earth
Discussions
The Cryosphere
Open Access Open Access
The Cryosphere
Discussions
Natural Hazards
and Earth System
Sciences
Open Access
Discussions
The dynamics of laterally variable subductions: laboratory models
applied to the Hellenides
B. Guillaume1,2,3,4, L. Husson1,2,3, F. Funiciello4, and C. Faccenna4
1G´eosciences Rennes, Universit´e de Rennes 1, Rennes, France
2G´eosciences Rennes, CNRS UMR 6118, Rennes, France
3Laboratoire de Plan´etologie et G´eodynamique de Nantes, UMR-CNRS 6112,
Universit´e de Nantes, Nantes, France
4Laboratory of Experimental Tectonics, Dip. di Scienze, Universit`a Roma Tre, Rome, Italy
Correspondence to: B. Guillaume ([email protected])
Received: 14 March 2013 – Published in Solid Earth Discuss.: 9 April 2013 Revised: 29 May 2013 – Accepted: 2 June 2013 – Published: 10 July 2013
Abstract. We designed three-dimensional dynamically self-consistent laboratory models of subduction to analyse the re-lationships between overriding plate deformation and sub-duction dynamics in the upper mantle. We investigated the effects of the subduction of a lithosphere of laterally vari-able buoyancy on the temporal evolution of trench kinemat-ics and shape, horizontal flow at the top of the astheno-sphere, dynamic topography and deformation of the over-riding plate. Two subducting units, which correspond to a negatively buoyant oceanic plate and positively buoyant con-tinental one, are juxtaposed via a trench-perpendicular inter-face (analogue to a tear fault) that is either fully-coupled or shear-stress free. Differential rates of trench retreat, in ex-cess of 6 cm yr−1between the two units, trigger a more vig-orous mantle flow above the oceanic slab unit than above the continental slab unit. The resulting asymmetrical sub-lithospheric flow shears the overriding plate in front of the tear fault, and deformation gradually switches from exten-sion to transtenexten-sion through time. The consistency between our models results and geological observations suggests that the Late Cenozoic deformation of the Aegean domain, in-cluding the formation of the North Aegean Trough and Cen-tral Hellenic Shear zone, results from the spatial variations in the buoyancy of the subducting lithosphere. In particular, the lateral changes of the subduction regime caused by the Early Pliocene subduction of the old oceanic Ionian plate re-designed mantle flow and excited an increasingly vigorous dextral shear underneath the overriding plate. The models suggest that it is the inception of the Kefalonia Fault that
caused the transition between an extension dominated tec-tonic regime to transtension, in the North Aegean, Mainland Greece and Peloponnese. The subduction of the tear fault may also have helped the propagation of the North Anato-lian Fault into the Aegean domain.
1 Introduction
At convergent margins, the negative buoyancy of the sub-ducting lithosphere plays a first-order role in driving subduc-tion (Forsyth and Uyeda, 1975; Chapple and Tullis, 1977). Variations in slab buoyancy occur both in time and space, for example during the subduction of oceanic plateaux that tend to decrease the average density of the subducting litho-sphere (e.g. Cloos, 1993). Not surprisingly, analogue (Bel-lahsen et al., 2005; Martinod et al., 2005; Espurt et al., 2008), semi-analytical (Royden and Husson, 2009), and numeri-cal (van Hunen et al., 2002; De Franco et al., 2008; Magni et al., 2012) models show that temporal variations of slab buoyancy exert a primary control on slab dip and migra-tion of the subducmigra-tion hinge relative to the upper plate. The downdip descent of positively buoyant material into the sub-duction zone initiates a transient mode during which the slab steepens and the subduction rate decreases. Similarly, mantle flows at lower rates about the slab, and the magnitude of dy-namic deflections adjusts within the same characteristic time frame. Less clear is the role of the lateral variations in slab buoyancy on trench migration rates, arc curvature, mantle
342˚W 342˚W 340˚W 340˚W 338˚W 338˚W 336˚W 336˚W 334˚W 334˚W 332˚W 332˚W 330˚W 330˚W 328˚W 328˚W 34˚N 34˚N 36˚N 36˚N 38˚N 38˚N 40˚N 40˚N 42˚N 42˚N m 0 1000 2000 -2000 -1000 ▲ ▲ ▲ ▲ ▲ ▲ ▲ ▲ ▲ ▲ ▲ ▲ ▲ ▲ ▲ ▲ ▲ ▲ ▲ ▲ ▲ ▲ ▲ ▲ ▲ ▲ ▲ ▲ ▲ ▲ ▲ ▲ ▲ ▲ ▲ ▲ ▲ ▲ ▲ ▲ ▲ ▲ ▲ ▲ ▲ ▲ ▲ ▲ ▲ ▲ ▲ ▲ ▲ ▲ ▲ ▲ ▲ ▲ ▲ ▲ ▲ ▲ ▲ ▲ ▲▲ ▲ ▲ ▲ ▲ ▲ ▲ ▲ ▲ ▲ ▲ ▲ ▲ ▲ ▲ ▲ ▲ ▲ ▲ ▲ ▲ ▲ ▲ ▲ ▲ ▲ ▲ ▲ ▲ ▲ ▲ 20 mm/yr
GPS velocities - Eurasia fixed
(Reilinger et al., 2010) elevation Menderes CR C r e t a n S e a A e g e a n S e a Pel. C r e t e Cyprus Rhod e M E D I T E R R A N E A N R I D G E B L A C K S E A KF H E L L E N I D E S CHSZ WASZ NAF NAT
Fig. 1. Tectonic map of the Aegean and Anatolian regions showing the main active structures (after Jolivet et al., 2013) and GPS velocity
field (Eurasia fixed, after Reilinger et al., 2010). Topographic data come from the ETOPO1 global relief model (Amante and Eakins, 2009). CHSZ: Central Hellenic Shear Zone; CR: Corinth Rift; KF: Kefalonia Fault; NAF: North Anatolian Fault; NAT: North Aegean Trough; Pel: Peloponnese; WASZ: Western Anatolian Shear Zone.
flow circulation, overriding plate deformation and topogra-phy along the subduction zone. Yet, they are common fea-tures on Earth, where seamounts, aseismic ridges, continen-tal fragments, stretched continencontinen-tal margins often correspond to lateral variations in the buoyancy of slabs. Their descent into the mantle is expected to affect slab geometry and man-tle flow and subsequently, dynamic topography, upper plate strain and trench deformation (Duretz and Gerya, 2013).
Clearcut examples of such settings are the subduction of continental units adjacent to oceanic plates. The Australian continent in the Banda trench subducts underneath the Banda Sea; it is dragged along with the Indian oceanic plate that subducts in its western counterpart Sunda trench (e.g. Carter et al., 1976; Hamilton, 1979; Bowin et al., 1980). Similarly, the Adriatic plate subducts underneath the Apennines; to the south, in the Ionian Sea, the subducting plate is oceanic, pos-sibly the oldest worldwide (Speranza et al., 2012). To the north, the bathymetry is much shallower, which is diagnos-tic of a continental fragment, less dense than the underlying
mantle. Their respective buoyancies are thus extremely con-trasted, and the subduction zone reacts accordingly (Royden and Husson, 2009). The lateral continuity of the subduct-ing lithosphere is not entirely resolved, and may vary from one subduction zone to another: tear faults may occasion-ally adjust the geometry of the slab to the differential mo-tion between the low and high buoyancy units (e.g. Govers and Wortel, 2005; Rosenbaum et al., 2008; Guillaume et al., 2010; Baes et al., 2011). Alternatively, the slab may not be disrupted by tear faults and instead distort, at least during the earlier stages of continental subduction, in order to accom-modate the lateral variations in subducting rates (e.g. Spak-man and Hall, 2010).
Similar setting prevails across the Adriatic Sea from the Apennines, along the Hellenides (Fig. 1). South of the Ke-falonia Fault, the oceanic Ionian plate subducts, whereas to the north, the continental, more positively buoyant unit en-ters the subduction zone. In spite of a long lasting inter-est (see Jolivet et al., 2013, for a review), the dynamics of
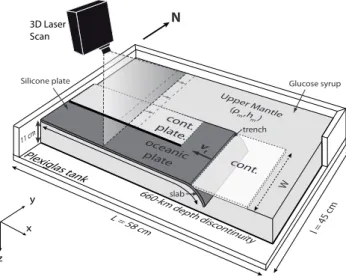
slab trench Plexiglas tank 660-k m depth disc ontinuit y L = 58 cm oceanic plate Upper M antle (ρ m,h m) Glucose syrup Silicone plate x y z 3D Laser Scan cont. plate. W l = 45 cm cont. vt N 11 cm
Fig. 2. Experimental setup. The subducting lithosphere is modelled
by a silicone plate made of two different materials, a positively buoyant one (defined as continental lithosphere) and a negatively buoyant one (defined as oceanic lithosphere). The upper mantle is simulated by means of glucose syrup, the bottom of the box corre-sponding to an impermeable lower mantle-upper mantle disconti-nuity. The plate is fixed, i.e. its trailing edge is attached to the box. The surface topography is monitored by a 3-D laser scan and pic-tures are taken from the top and the side of the model every 30 s. See Table 1 for experimental parameters.
the Hellenic subduction and Aegean domain bear persist-ing questions: what are the mechanisms that trigger the late (≤ 5 Ma, Armijo et al., 1999) propagation of the North Ana-tolian Fault into the Aegean domain? What are the causes of the rapidly changing structural pattern during Neogene, in the Aegean in general and in particular in the Peloponnese and Mainland Greece, around the Corinth rift (Papanikolaou and Royden, 2007)? How do these events relate to the dis-ruption of the Hellenic arc by the Kefalonia Fault?
We thus perform a set of dynamically self-consistent 3-D laboratory models, in which no external kinematic boundary conditions, such as plate or trench velocity, are applied, to test the influence of the arrival at trench of a laterally het-erogeneous lithosphere, positively buoyant on half the width of the subduction zone (referred to as continental lithosphere in the following) and negatively buoyant on the other half (oceanic lithosphere in the following), on the subduction dy-namics. We further test the role of the shear stresses along the interface between the continental and oceanic plates, that we herein generically name tear fault, on the modulation of the dynamics. We finally analyse the well-documented tectonic evolution of the Aegean domain at the light of our models.
2 Models
Our simplified subduction system is designed to reproduce the force balance in natural subduction zones, which means that the slab drives the mantle flow and its motion is resisted by viscous dissipation in the mantle, in the slab, in the over-riding plate and at the plates interface (De Franco et al., 2008; Zhong and Gurnis, 1994). We performed a total of 11 mod-els, following the experimental procedure proposed by Fu-niciello et al. (2003) and Bellahsen et al. (2005) (Table 1). The set of models aims at exploring how the lateral variation in slab buoyancy affects the kinematics of the trench, mantle flow, dynamic topography and upper plate deformation. In the following, only 4 of the 11 models will be described in details while the others serve as a background for our anal-ysis. The modelled subducting lithosphere has been divided into a positively buoyant portion and a negatively buoyant portion (Fig. 2). Such an approach has already been used to study how the subduction of positively buoyant ridges and oceanic plateaux impact the subduction dynamics (Martinod et al., 2005; Espurt et al., 2008; Martinod et al., 2013). To compare the experimental results to the kinematics of the Hellenic subduction, we restrict the length of the subduction zone within the range 1200–2400 km and we fix the subduct-ing plate at its trailsubduct-ing edge, in analogy with the Hellenic subduction zone that is embedded into the massive, slowly moving African plate.
2.1 Setup
We use silicone putty (Rhodrosil Gomme, PDMS + iron fillers) and glucose syrup to model the lithosphere and the up-per mantle, respectively. Silicone putty is a viscoelastic mate-rial. However, it can be considered as a quasi-newtonian fluid since the elastic component is negligible for the applied low experimental strain rates (Weijermars and Schmeling, 1986). Glucose syrup is a transparent newtonian low-viscosity fluid. These materials have been selected to achieve the standard scaling procedure for stresses scaled down for length, den-sity and viscoden-sity in a natural gravity field as described by Weijermars and Schmeling (1986) and Davy and Cobbold (1991).
The scale factor for length is 1.67 × 10⁻⁷ (1 cm in the model corresponds to 60 km in nature). Densities and vis-cosities are assumed to be constant over the thickness of the individual layers and are considered to be averages of the ac-tual values. Scaling for time t is given by
tnature=
(1ρh)model.ηnature
(1ρh)nature.ηmodel
×tmodel (1)
where 1ρ is the density contrast between the subducting plate and upper mantle, h is the slab thickness, and η the mantle viscosity. The density contrast 1ρ between oceanic lithosphere and mantle ranges from 71 to 83 kg m−3 (corre-sponding to a 40 Myr-old oceanic lithosphere with a 80 %
Table 1. Experimental parameters. L: length; W : width; h: thickness; 1ρ: ρ − ρmantle; η∗: η/ηmantle. Considering a natural case with the
following parameters (hslab=72 km; ηmantle=1 × 10²⁰Pa s and 1ρslab=71 kg m−3), 1 km in nature corresponds to 0.14 mm in the lab, a
period of 1 Myr in nature corresponds to 57 s in the lab, and a velocity of 10 cm yr−1in nature to a velocity of 17.6 mm min−1in the lab
(models 8–11).
Oceanic lith. Continental lith. Continent
Model L W h 1ρ η∗ L W h 1ρ η∗ L W h 1ρ η∗ cm cm cm kg m−3 ×102 cm cm cm kg m−3 ×102 cm cm cm kg m−3 ×10² 1 35 20 1.2 83 9.1 21 10 1.2 −35 8.5 16 25 1.0 −35 8.5 2 40 20 1.2 83 7.75 20 10.5 1.2 −41 17 18 25 0.9 −35 7.25 3 45 20 1.2 83 7.75 25 10 1.2 −41 17 – – – – – 4 45 40 1.2 83 7.75 25 20 1.2 −41 17 – – – – – 5 45 40 1.2 83 7.75 25 20 1.2 −41 17 – – – – – 6 45 40 1.2 83 7.75 25 20 1.2 −41 17 – – – – – 7 45 40 1.2 83 7.75 25 20 1.2 −41 17 20 40 0.5 −35 7.25 8 45 40 1.2 71 11.5 25 20 1.2 −43 25 – – – – – 9 45 30 1.2 71 11.5 25 15 1.2 −43 25 – – – – – 10 45 20 1.2 71 11.5 25 10 1.2 −43 25 – – – – – 11 45 20 1.2 71 11.5 25 10 1.2 −43 25 – – – – –
eclogitized crust; see Cloos, 1993) and that of the
continen-tal lithosphere between −35 and −43 kg m−3
(correspond-ing to a continental lithosphere with a crust thickness of
∼16 km and a density of 2.75, in the range of crustal thick-ness found for the subducting lithosphere beneath the North-ern Hellenides (20 km; Pearce et al., 2012)) (Table 1). When present, the overriding lithosphere is positively buoyant with
1ρ = −35 kg m−3. The viscosities of the lithospheres and
upper mantle are measured with a rheometer (Physica MCR 301, Anton Paar). At room temperature and for strain rates ranging between 10−4s−1and 10−3s−1, the viscosity of the silicone putty used for the oceanic lithosphere is 3.2×10⁴Pa s and the viscosity of the continental lithosphere is either 2.9 × 10⁴Pa s for model 1 or 6.8 × 10⁴Pa s for the other ones. Viscosity of the overriding lithosphere, when present, is 2.9 × 10⁴Pa s and the viscosity of the mantle ranges between 30 and 40 Pa s. The obtained viscosity ratio between the slab and the upper mantle varies between 7.75 × 10²and 25 × 102 (Table 1), which is in the high range of proposed values (e.g. Billen et al., 2003; Faccenna et al., 2007; Funiciello et al., 2008; Wu et al., 2008; Loiselet et al., 2009, 2010). In the following, we directly express the quantities with their cor-responding scaled values for a better relevance to real Earth. The mechanical behaviour of the trench-perpendicular boundary between the oceanic and continental lithospheres exerts a primary control on the evolution of subduction. Be-cause the lithosphere in our experiments is simulated by the means of an unstratified mechanical layer with a Newtonian rheology, its deformation is not localised enough to sponta-neously form a vertical tear fault during the subduction. We thus consider two end-members, in which the behaviour of the discontinuity is ascribed a priori, by artificially switching on and off the shear stresses at the boundary between the two
plates: (i) no lithospheric tear fault: we assume that differen-tial buoyancy forces and rheological properties do not meet the conditions required to trigger the rupture of the litho-sphere. The evolution of the oceanic and continental portions of the subducting lithosphere stay interdependent during the time of the experiment; (ii) preexisting tear fault: we assume that the rupture is instantaneous and localised at the transi-tion between oceanic and continental lithospheres. In prac-tice, this second case is obtained by forming a pre-existing structure precutting the subducting lithosphere at the transi-tion between negatively- and positively-buoyant lithospheres and filling in the created gap with petroleum jelly that pre-vents the two plates of silicone to stick together again during the experiment. Mechanically, the viscosity of the employed petroleum jelly is so low that it implies shear stresses (but not the normal stresses) are negligible between the two plates.
2.2 Experimental procedure
The silicone plates are initially floating above the glucose syrup and their trailing edges are attached to the box in order to preclude any trenchward motion of the subducting plate (fixed edge subduction sensu Kincaid and Olson, 1987), in which absolute motion of the subducting lithosphere is null with respect to the lower mantle (Fig. 2). Assuming negligi-ble horizontal strain of the subducting lithosphere, the rate of trench motion equals the rate of subduction. Spontaneous sinking of the negatively buoyant oceanic lithosphere, that initially floats over the syrup, is avoided by surface tension exerted by the syrup onto the silicone plate. The experimental subduction is always initiated by forcing the leading edge of the silicone plate into the glucose syrup to a depth of ∼ 2 cm (corresponding to about 120 km in nature). We ensure that the subduction is at steady state (see Funiciello et al., 2003)
0 2 4 6 slab at 660 km ocean-cont. slab at 660 km ocean-cont. slab at 660 km ocean-cont. tear fault tear fault -1000 -500 1000 500 0 -1000 -500 1000 500 0 -1000 -500 1000 500 0 along−trench distance y (km) along−trench distance y (km) along−trench distance y (km) time (Myr) −2 0 2 4 6 8 cm/yr −2 0 2 4 6 8 cm/yr −2 0 2 4 6 8 cm/yr −2 0 2 4 6 8 vt (cm/yr) vt (cm/yr) vt (cm/yr) trench retreat trench advance trench retreat trench advance trench retreat trench advance time (Myr) −2 0 2 4 6 8
a
b
c
d
e
f
time (Myr) time (Myr) time (Myr) time (Myr) −2 0 2 4 6 8 0 10 20 30 0 10 20 30 40 50 60 0 10 20 30 40 50 60 30 20 10 20 10 60 30 60 10 20 30 500 km 100 km -100 km -500 km y 500 km 100 km -100 km -500 km y 300 km 60 km -60 km -275 km y 5 8 11 -1000 -500 1000 500 0 along−trench distance y (km) cm/yr vt (cm/yr) trench retreat trench advanceg
h
time (Myr) time (Myr) −2 0 2 4 6 8 0 10 20 30 40 50 60 20 10 30 40 50 60 300 km 60 km -60 km -300 km y 1 slab at 660 km ocean-cont.Fig. 3. (a) Trench migration rate as a function of time along y-axis for model 5, i.e. a large subduction zone with a vertical tear fault developing
after 20.5 Myr of subduction (black dotted line). Zero on the y-axis corresponds to the location of the discontinuity between oceanic and continental lithospheres. Positive and negative values indicate oceanward and continentward trench motions, respectively. A solid white line underlines the onset of continental lithosphere subduction. (b) Trench migration rate as a function of time for sections located 500 km (red line) and 100 km (green line) north of the discontinuity and 100 km (blue line) and 500 km (black line) south of it (see location on Fig. 3a). Slab reaches the upper-lower mantle discontinuity after 6 Myr. Subduction of the positively-buoyant slab starts after 11 Myr. (c) Same as (a) but for a large subduction zone without a vertical tear fault (model 8). The area in white corresponds to a period of no data acquisition. (d) Same as (b) but for model 8. (e) Same as (a) for a narrow subduction zone with a vertical tear fault developing after 42 Myr (model 11). (f) Same as (b) but for model 11 and sections located 300 km (red line) and 60 km (green line) north of the discontinuity and 60 km (blue line) and 275 km (black line) south of it (see location on Fig. 3e). (g) Same as (a) for a narrow subduction zone with an overriding plate (model 1). (h) Same as (b) but for model 1.
before the lateral transition between oceanic and continental lithospheres enters the trench. In order to meet this condition and only identify the effects of the lateral variations in slab buoyancy, the leading part of the subducting plate is made of 1200 km-long oceanic lithosphere. For descriptive conve-nience, we geographically orient our models, such that West is on the foreland side of the plate (the unsubducted part of the plate).
When present, the overriding plate is decoupled from the subducting plate by a thin layer of glucose syrup (see Heuret et al., 2007; Espurt et al., 2008; Guillaume et al., 2009), which reduces the shear stresses to negligible values (be-cause stresses scale with viscosity) and prevents plates stick-ing to one another. It is somehow equivalent to introducstick-ing a weak zone in numerical models that is used to mimic the ef-fect of a fault subduction zone (e.g. Zhong and Gurnis, 1994; G´erault et al., 2012).
The glucose syrup in some of the models is initially seeded with highly reflecting air micro-bubbles. These bubbles are used as passive tracers to map the upper mantle circulation pattern and to quantify the related velocity field using the im-age analysis technique denoted as Particle Imim-age Velocime-try using the MatPIV 1.6.1 toolbox (Sveen, 2004). We as-sume that tracers only slightly influence the density and vis-cosity of the mantle fluid, as in Funiciello et al. (2006). For models 8–11, when steady state is reached, the surface is spray-painted (in order to overcome optical issues due to the translucency of the glucose syrup) and scanned with a 3-D scanner (EScan 3-D Imaging System), which acquires the to-pography with a maximum horizontal resolution of 0.13 mm (∼ 800 m in nature). The precision of topographic data is 0.05 mm (300 m in nature).
3 Modeling results
Lateral variations of slab buoyancy are accounted for by lo-cally changing the density contrast between the slab and sur-rounding mantle. At this transition, the two units are either decoupled from one another by a preexisting lithospheric tear fault or not.
3.1 Trench kinematics
3.1.1 Large subduction zone with tear faulting
(model 5)
The trench in model 5 is 2400 km large. W–E trench migra-tion rate (vt) is computed for 90 s (∼ 1.2 Myr) time steps and
1 cm (60 km) steps along the trench (Fig. 3a, b). Trench kine-matics follow a 4 stage evolution, as also recorded in models 4 and 6:
i. For the first 6 Myr, the oceanic plate is sinking into the upper mantle, slab pull force progressively increases and trench retreat velocity reaches values as high as 6– 8 cm yr−1(Fig. 3a, b).
ii. Once the slab reaches the bottom of the box, ocean-ward trench motion slows down and stabilises at ∼4.5 –5 cm yr−1. vtis slightly higher in the centre of the
sub-duction zone with values of ∼5–5.5 cm yr−1 (Fig. 3a, b).
iii. The third stage starts with the onset of continental litho-sphere subduction in the northern half of the subduction zone after 11 Myr and stops when the offset along the vertical tear fault in the centre of the subduction zone develops after 20.5 Myr. In the northern part, the av-erage negative slab buoyancy progressively decreases, and the subduction and trench velocities drop. In the centre of the northern unit (y = 500 km), trench motion switches from retreat to – moderate – advance after a pe-riod of ∼ 8 Myr (Fig. 3a, b) when ∼ 125 km of continen-tal lithosphere has subducted. We found similar results for model 8, which incorporates an overriding plate. Closer to the lateral transition between continental and oceanic units (y = 100 km), the decrease in trench mi-gration rate is slower; for the 9.5 Myr duration of this third stage trench velocity drops from 5 to 0.5 cm yr−1 (Fig. 3a, b). On the oceanic side (y = −100 km), the decrease of vt is more limited, with values just below
3 cm yr−1after 20.5 Myr. Farther from the central dis-continuity (y = −500 km), the arrival at trench to the north of the continental lithosphere does not decrease the trench retreat velocity, as observed elsewhere. In-stead, vtslightly increases from 5 to 6 cm yr−1between
11 Myr and 20.5 Myr (Fig. 3a, b), meaning that the lateral influence of a decrease in slab buoyancy van-ishes at remote locations (> 500 km). We also observe a 1 cm yr−1 increase in trench retreat on a ∼10 Myr in-terval in the centre of the oceanic unit for model 8. However, the additional overriding plate dragging re-sults in lower values of trench retreat, from ∼2.5 to 3.5 cm yr−1.
iv. After 20.5 Myr, the differential trench retreat motion be-tween the oceanic and continental units offsets the two plates along a vertical tear fault (Figs. 3a, b and 4a). On its northern edge (y = 100 km), vtkeeps decreasing
and eventually switches from oceanward to continent-ward motion with values up to 1 cm yr−1(Fig. 3a, b).
In-stead, on its southern edge (y = −100 km), vt
instanta-neously increases from 3 to 6 cm yr−1. Farther from the tear fault, changes in trench kinematics are less impor-tant. In the centre of the southern unit (y = −500 km), vt
slightly increases to ∼ 6.5 cm yr−1, ∼ 30 % higher than trench retreat velocity during stage 2 when the width of the slab was about twice as large. Finally, the limited
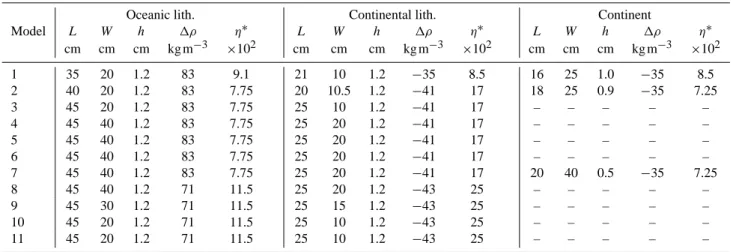
-14 -9 -4 1 6 16 26 36 46 -1000 -500 500 0 500 0 -1500 -1000 -500 0 500 trench-orthogonal distance x (km) 500 0 -11 -7 -3 1 5 9 13 17
a
b
along−trench distance y (km) -1000 -500 500 0 -2000 -1500 -1000 -500 0 trench-orthogonal distance x (km) along−trench distance y (km)5
8
Fig. 4. Evolution of horizontal trench shape for models (a) 5 and (b) 8. Thick and thin lines indicates locations of oceanic and
conti-nental subductions, respectively. Numbers at the bottom indicate the time after subduction of continental lithosphere in Myr. Dashed line in (a) indicates the location of the tear fault and grey box in (b) the area where the slab deforms to accommodate differential roll-back velocities. Black arrows show schematic mantle flow pattern asso-ciated with subduction. Insets show 3-D sketches of the subducting plate shape at the end of each experiment.
decrease in vtto the south of the tear fault after ∼ 23–
24 Myr are edge effects, as the slab reaches the end wall of the tank.
The roll-back of slabs causes the development of toroidal cells at slab edges (Dvorkin, 1993; Funiciello et al., 2004; Schellart, 2004; Funiciello et al., 2006; Piromallo et al., 2006). In the model, the persistent rollback of the oceanic lithosphere to the south excites such a mantle flow that op-poses the roll-back of the northern continental lithosphere, which explains the decreasing vt, and even slight advance, to
the north.
3.1.2 Large subduction zone without tear faulting
(model 8)
In this model, the subduction of positively buoyant litho-sphere after 15 Myr also strongly modifies the trench kine-matics (Fig. 3c, d). But unlike model 5, along-trench vari-ations of trench velocity are less pronounced. In details, 10 Myr after the entry of positively buoyant lithosphere, the difference of trench velocity between regions located 500 km north and south of the discontinuity is ∼ 3 cm yr−1, half the value observed for model 5 (6 cm yr−1) (Fig. 3b, d). It also holds for regions closer to the discontinuity. The difference in trench velocity 15 Myr after the onset of continental subduc-tion between regions located 100 km away from the discon-tinuity is restricted to ∼ 1 cm yr−1for model 8 as opposed to
∼6 cm yr−1for model 5 (Fig. 3c, d). Because in the absence
of a tear fault, shear stresses are high between the two plates, they remain coupled throughout and the kinematic evolution of the north and south trenches is never independent from one another. Thus, the absence of slab segmentation at the junction between regions with variable buoyancy results in a global slow down of trench motion along the entire sub-duction zone.
3.1.3 Narrow subduction zone with tear faulting
(model 11)
Width of the plate has no significant influence on the evolu-tion of subducevolu-tion in the models. Indeed, both model 9 and 11, which share the same set-up as model 5 excepted the sub-duction zone width that is 1800- and 1200- km large, respec-tively, instead of 2400 km, follow a comparable 4 stage evo-lution (Fig. 3e, f). In the following, we only discuss results from the end-member (model 11).
During stage 2, the trench migrates slightly faster in model 11 than in model 5 (5.5–6 vs. 5 cm yr−1), in agreement with previous models that show that narrower slabs retreat faster (Guillaume et al., 2010). At the beginning of stage 3 after 18 Myr, trench retreat velocity decreases all along the sub-duction zone. In the centre of the oceanic unit of the subduct-ing lithosphere, where the migration rate slightly increases in model 5, model 11 instead shows a 50 % decrease of vt.
There is also a delay in the time of tear faulting with re-spect to the large subduction zone model. It occurs ∼ 25 Myr after the positively buoyant unit reaches the trench in model 11 instead of 10 Myr in model 5. This can be explained by the lateral lower variability in trench migration rate that in-creases the delay necessary for the tear fault to open. In both cases however, the segmentation of the slab at depth occurs when the difference in amount of trench retreat between both sides of the discontinuity reaches values of 200–250 km.
12 10 8 8 6 4 2 6 4 2 12 10 8 6 4 2 2 4 6 8 0 0 0
a
b
c
depth (km) depth (km) y (km) −1200 −600 0 −600 0 600-11 -5 1 7 13 continen tal lithospher e x (km) oceanic lith. z (km) y (k m) vt (cm/yr) vt (cm/yr) -400 0 400 0 16.5 Myr 19 Myr 25 Myr 40 Myr 46.5 Myr A A’A
16.5 Myrvt vtA’
depth 40 Myrdepth
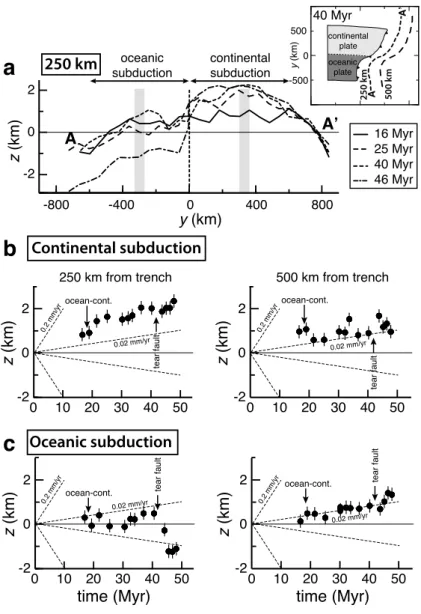
Fig. 5. (a) Digital Elevation Model for the surface of model 11
after 40 Myr of subduction. Zero is the average elevation of the glu-cose syrup away from the subduction zone. (b) Maximum trench depth (solid line) and corresponding trench migration rate along y-direction (dashed line) after 16.5 Myr (in gray) and 40 Myr (in
green) of subduction. (c) Trench maximum depth as function of vt
at different times during subduction. Light and dark symbols corspond to points located in front of continental and oceanic units, re-spectively. To minimise boundary effects, only points located within a distance of 400 km from the centre of the subduction zone are in-cluded. Dashed lines and grey box indicate the regression envelope
for vt>0.
3.2 Trench shape and depth
Figure 4 shows the evolution of trench shape through time for the large subduction zone models with (5) or without (8) tearing. At first order, both models share a common geome-try that is controlled by the along-trench variability of trench motion. During stages 1 and 2, the trench retreats faster at the centre of the subduction zone than along the edges, which promotes trench curvature. After the arrival of continental lithosphere to the north, the trench remains almost stationary in the northern part whereas in the southern part roll-back of the subducting plate continues. This subsequently causes the formation of a concave trench to the south and an almost-linear trench to the north. The transition is sharp in model 5. The lithospheric fault offsets the trench position at an average velocity of ∼ 7 cm yr−1, giving a cumulative offset of 500 km
after 7 Myr. Model 8 instead shows continuous transitions from fast trench retreat south of the discontinuity to a sta-tionary – or slowly advancing – trench to the north ∼ 16 Myr after continental subduction. The difference is here accom-modated by slab deformation on a roughly 400 km wide band (Fig. 4b).
Trench depth is also sensitive to along-trench variations in slab buoyancy. We scanned the surface elevation of the model (Fig. 5a) in order to compare the along-trench variations of minimum trench elevation with the corresponding trench mi-gration rate for model 11 (Fig. 5b). Before the subduction of the buoyant lithosphere (16.5 Myr), both trench elevation and trench migration rate are uniform along the entire sub-duction zone with a ∼ 10 km deep trench (below reference level, here the mean mantle surface elevation far from the subduction zone) associated to a trench velocity of 6 cm yr−1.
Instead, after 40 Myr, when up to 250 km of buoyant material has entered the trench, trench elevation varies laterally, with a maximum depth in front of the continental unit restricted to
∼2 km. Figure 5c displays the relationship between trench velocity and trench elevation for points sampled every 60 km along the trench at different times of the same model. Faster trench migration rates match deeper trenches. In these mod-els, the trench depth results from the competition between the buoyancy stresses in the glucose syrup, that tend to restore uniformity, and the shear stresses exerted by the slab that im-pose the downward flow of the glucose syrup (see Husson et al., 2012). Response of trench topography to variations of trench kinematics is instantaneous and for instance, faster trench retreat of the oceanic part of the subduction zone oc-curring after slab segmentation at 42 Myr results in a deepen-ing of the trench, from 9 to 11 km at 40 Myr to 11 to 12 km at 46.5 Myr (Fig. 5c). Although the shear stresses between the slab and mantle linearly depend on trench velocity, the rela-tionship shown on Fig. 5c breaks down for low trench retreat rates or advancing trenches because of the effect of surface tension whose magnitude is independent on the kinematics.
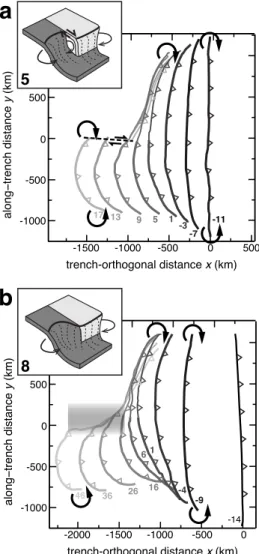
−1000 0 1000 −1000 0 1000 −1000 0 1000 −1000 0 1000 −1000 0 1000 −1000 0 1000 −1000 0 1000 −1000 0 1000 −1000 0 1000 −8 −6 −4 −2 0 0 1000 2000 3000 02 4 6 cm/yr −8 −6 −4 −2 0 0 1000 2000 3000 −8 −6 −4 −2 0 0 1000 2000 3000
20 Myr
25 Myr
40 Myr
velocity field
a
b
c
W-E component
N-S component
X2 −6 −4 −2 024 6 cm/yr Westward Eastward −6 −4 −2 024 6 cm/yr Southward Northward y (km) y (km) y (km) vh(W-E) (cm/yr) x (km) x (km) x (km) continental plate oceanic plate X2Fig. 6. (a) Velocity vectors and magnitude of the horizontal velocity field for model 11 after 20 Myr (left panel), 25 Myr (central panel) and
40 Myr (right panel) of subduction. Note the changing size of the arrows. (b) Magnitude and along-x profiles of the W–E component of the
velocity field. On the maps, black dashed lines underline regions with horizontal mantle flow velocity (vh) higher than 0.5 cm yr−1and black
solid lines with vh>4 cm yr−1. Positions of continental and oceanic units of the subducting plate are indicated in light grey and dark grey,
respectively, and the position of the trench by a black line with triangles. W-directed mantle flow is represented as negative values. Profiles pass through the centre of the continental (dashed line) and oceanic (dotted line) units. Black arrows indicate the position of the trench. (c) Same as (b) but for the N–S component of the velocity field. Southward mantle flow is represented as negative values.
3.3 Mantle flow
Horizontal velocities (vh) are computed at the surface of
the glucose syrup and silicone plate in the model 11 (that has no upper plate) using Particle Image Velocimetry (PIV) on top-view images with a pixel resolution of 0.25 mm and time intervals of 30 s. PIV relies on basic pattern matching, which reconstructs the Eulerian velocity field on a regular grid (Adrian, 1991; Nogueira et al., 2001, among others). We use a multipass cross-correlation analysis with a 50 % over-lap of the interrogation regions.
Figure 6 displays the horizontal velocity vectors and the magnitude of both W–E and N–S components of the hori-zontal velocity field 20 Myr, 25 Myr and 40 Myr after sub-duction initiation for model 11. During the early stage of
uniform subduction (20 Myr), the roll-back motion of the subducting panel results in the formation of two toroidal cells centred on the slab edges (Fig. 6, see also Funiciello et al., 2006; Husson et al., 2012). The pattern of mantle cir-culation is almost symetrical with (i) fast westward parti-cle motion in the centre of the subduction zone with max-imum velocities (vh(W–E)≈6 cm yr−1) (Fig. 6b), similar to
the westward trench migration rate at the same period, (ii) fast eastward flow (vh(W–E)>4 cm yr−1) at the edges of the
subduction zones (Fig. 6b).
The early stage of the subduction of continental litho-sphere (25 Myr) records variable trench migration rates along the trench (Fig. 3e, f). This directly affects horizontal veloc-ities in the mantle with an asymetry in the westward par-ticle motion between regions in front of the oceanic unit
300 km 300 km trench continental plate oceanic plate 3 0 0.6 1.2 1.8 2.4 x 10⁻¹⁶ s-1 300 km 300 km oceanic plate 300 km 300 km continental plate oceanic plate continental plate 0 -3 -2.4 -1.8 -1.2 -0.6 x 10⁻¹⁶ s-1
Stretching
Shortening
Displacement vectors
RP RPb
14.5 - 25 Myrc
25 - 38.5 Myra
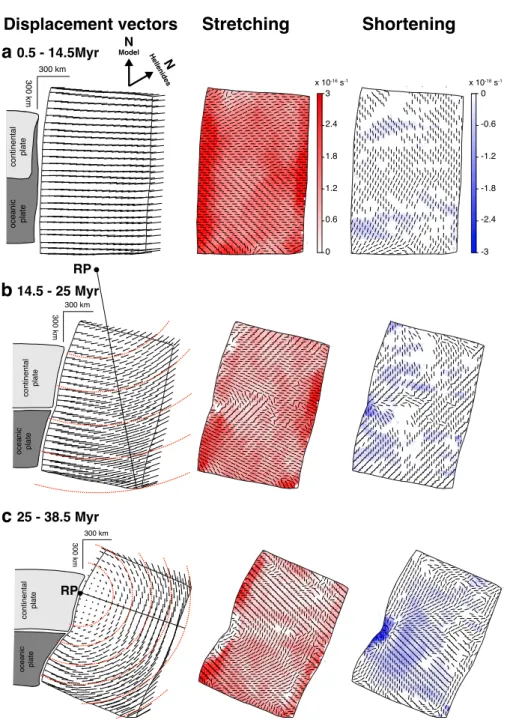
0.5 - 14.5Myr ModelN HellenidesNFig. 7. Motion and deformation of the overriding plate for model 1, (a) between 0.5 and 14.5 Myr, (b) 14.5 and 25 Myr, and (c) 25 and
38.5 Myr after the initiation of subduction. Left panel shows displacements fields for each time interval. Central and right panels show the main directions and rates of stretching and shortening, respectively. RP is for rotation pole.
(vh(W–E)>4 cm yr−1) and in front of the continental unit
(vh(W–E)∼2 cm yr−1) (Fig. 6b). Even if the surface involved
in mantle flow has not significantly decreased with respect to the previous stage, the average motion of particle has slowed down both in the W–E and N–S directions owing to the over-all decrease in trench migration rates (Fig. 6b, c).
After 40 Myr of subduction, a switch in mantle flow direc-tion occurs in front of the continental unit, particles moving eastward at low velocities (vh(W–E)<0.5 cm yr−1) (Fig. 6b).
In front of the oceanic unit instead, the motion remains west-ward with maximum velocities at ∼ 4 cm yr−1. In the man-tle wedge just above the slab, manman-tle flow is mainly trench-perpendicular with fast motion for the oceanic unit whereas above the continental unit, it is mainly trench-parallel with low magnitude. Unfortunately, we could not monitor the models beyond that stage for technical reasons.
3.4 Overriding plate deformation
We measure the horizontal strain within the overriding plate at different times of the experiment by tracking the dis-placement of grid nodes initially evenly-spaced by 60 km. Owing to the newtonian behaviour of the silicone used to model the overriding plate, deformation is continuous. Fig-ure 7 presents the displacement field and main strain direc-tions recorded during three time intervals for model 1. Sim-ilar trench kinematics evolution were obtained for model 2 and 3, with two-times higher absolute trench velocities in the latter owing to the lack of overriding plate, and the same spa-tial pattern of deformation was recorded in model 2.
Before the arrival of continental lithosphere at the trench (0.5–14.5 Myr), the finite displacement of the overriding plate with respect to the lower mantle reference frame is larger at its western edge than at its eastern edge, result-ing in trench-perpendicular stretchresult-ing (Fig. 7a). Stretchresult-ing is not uniform, owing to differential basal shear tractions at the lithosphere–asthenosphere boundary resulting from hetero-geneous mantle flow below the overriding plate. It is max-imal within the first 120–180 km from the trench (Fig. 7a) and decreases away from the boundary. Local trench-parallel stretching at the southern and northern edges of the upper plate results from the free lateral boundary conditions that allow the silicone plate to spread laterally above the low-viscosity glucose syrup under the effect of gravity.
The early stage of continental lithosphere subduction (14.5–25 Myr) is associated to a 30 to 60 % decrease in trench retreat rates along the entire subduction zone (Fig. 3g, h). Its deformation decomposes into translation (herein irrel-evant), plain rotation and stretching. During this period, the grid nodes rotate clockwise around a pole located ∼ 500 km north of the northernmost extent of the overriding lithosphere (Fig. 7b). Overriding plate mainly deforms through later-ally non uniform stretching. For the first 180 km from the trench, trench-perpendicular stretching occurs in front of the oceanic unit about twice faster than in front of the conti-nental unit (∼ 3 × 10⁻¹⁶ vs. ∼ 1.5 × 10⁻¹⁶s−1). Region of maximum trench-perpendicular stretching coincides with the area where the gradient of the east-west component of hor-izontal mantle flow at the top of the asthenosphere is maxi-mum (Fig. 6b), i.e. where shear stresses underneath the litho-sphere are the highest. Within the first 60 km in front of the continental–oceanic transition, the overriding plate mainly deforms under moderate trench-parallel shortening (Fig. 7b). In the final stage (25–38.5 Myr), the difference in along-trench kinematics results in a clockwise rotation of grid nodes with a rotation pole located on the trenchward edge of the overriding plate in front of the continental unit (Fig. 7c). Despite the almost null motion of the trench at the location of the continental unit, the trenchward edge of the overrid-ing plate north of the oceanic-continental transition still de-forms under trench-perpendicular stretching at higher rates than recorded before (> 3 × 10⁻¹⁶s−1) (Fig. 7c).
Deforma-tion here is controlled by stresses arising from the far-field, associated with trench retreat for the oceanic unit at moder-ate rmoder-ates (2 ± 1 cm yr−1) (Fig. 3g, h). Within the first 60 km
from the trench, the centre of the overriding plate is domi-nated by trench-perpendicular shortening (Fig. 7c). Indeed at this specific location, retreat of the oceanic lithosphere to the south triggers the westward absolute motion of the overrid-ing plate at a faster rate than the westward absolute trench motion, slowed down by the subduction of positively buoy-ant lithosphere to the north. Beyond 120 km, upper plate de-forms under a combination of moderate stretching and short-ening, the principal axis of stretching rotating from trench-perpendicular on its edges to trench-parallel in its centre (Fig. 7c).
3.5 Dynamic topography
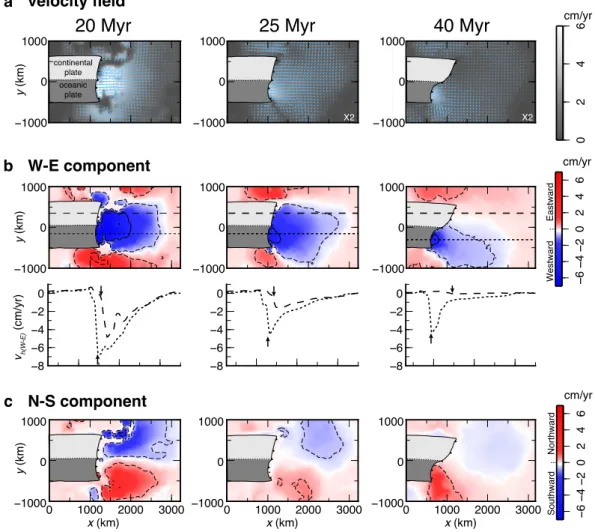
Long-wavelength, non-tectonic uplift or subsidence counter-balance the vertical traction caused by the flowing mantle underneath the lithosphere. Ultimately, this flow is excited by density variations in the mantle, and that component of the topography is often referred to as dynamic topography (Ricard et al., 1984; Hager et al., 1985; Hager and Clayton, 1989; Cazenave et al., 1989; Mitrovica et al., 1989; Gurnis, 1993; Le Stunff and Ricard, 1995). Above the anomalies of the slabs, the amplitude of dynamic subsidence can exceed several hundred metres (Mitrovica et al., 1989; Gurnis, 1993; Zhong and Gurnis, 1994; Husson, 2006; Husson et al., 2012). We track the vertical deformation of the model surface with a scanner during subduction in model 11 and in particu-lar at the top of the asthenosphere above the subducting litho-sphere, north and south of the discontinuity (Fig. 8). Because there is no overriding plate in this model, all the topography has a dynamic origin.
The subduction of buoyant material after ∼ 18 Myr of sub-duction induces an instantaneous response of the surface for the northern continental subduction zone with an up-lift of around 0.7 km in ∼ 3 Myr at 250 km from the trench (Fig. 8b). Conversely, in the oceanic portion of the subduc-tion zone, although the trench retreat velocity strongly de-creases, the variations in surface elevation remain elusive during ∼ 10 Myr (Fig. 8c). However, between 30 and 42 Myr, the surface uplifts by ∼ 0.7 km, which may be explained by the influence of positively buoyant material to the north, that globally decreases the subduction rate, and as such, the verti-cal traction exerted by the mantle on the surface. Surface mo-tion at 500 km from the trench appears insensitive to changes in slab buoyancy (Fig. 8b, c). However, on the long-term, the surface gently uplifts at rates of ∼ 0.02 mm yr−1for both continental and oceanic subductions between 18 and 42 Myr. Dynamic topography being directly sensitive to the vertical component of mantle flow, it once more reflects the fact that during that time interval the vigor of the horizontal man-tle flow has decreased (Fig. 6), but also the vertical traction
0 10 20 30 40 50 250 km from trench 0 10 20 30 40 50 500 km from trench
time (Myr)
time (Myr)
Continental subduction
Oceanic subduction
tear fault -2 2 0z (km)
z (km)
-2 2 0 0 10 20 30 40 50 -20 10 20 30 40 50 2 0z (km)
z (km)
-2 2 0a
b
c
ocean-cont. tear faultocean-cont. ocean-cont. tear fault
tear fault ocean-cont. z (km) y (km) -2 -800 -400 0 400 800 2 0 continental subduction oceanic subduction 16 Myr 25 Myr 40 Myr 46 Myr 0.2 mm/yr 0.02 mm/yr 0.2 mm/yr 0.02 mm/yr 0.2 mm/yr 0.2 mm/yr 0.02 mm/yr 0.02 mm/yr continental plate oceanic plate
250 km
250 k m 500 k m A A’A
A’
40 Myr 0 500 y (km) -500Fig. 8. (a) Dynamic topography measured at the surface of the asthenosphere for model 11 at a distance of 250 km from the trench after 16,
25, 40 and 46 Myr of subduction. Inset indicates the location of cross-sections at 250 and 500 km from the trench after 40 Myr of subduction.
(b) Time-evolution of dynamic topography for the same model above the centre of the continental subduction zone at 250 km from the trench
(left panel) and 500 km from the trench (right panel). Elevations are averaged on a 60 km wide trench-perpendicular swath to remove any shorter wavelength perturbations (see position of swath on Fig. 8a). (c) Same as (b) for the oceanic subduction. Trends for uplift and downlift
velocities of 0.02 and 0.2 mm yr−1are indicated by dashed lines.
underneath the surface as a result of the overall decrease in slab buoyancy.
After 42 Myr, the tear fault decouples the continental and oceanic units, which strongly modifies the dynamic topogra-phy above the oceanic portion of the subduction zone. A ∼ 1.7 km downlift of the surface is recorded at 250 km from the trench, yielding a subsidence rate of ∼ 0.3 ± 0.1 mm yr−1 (Fig. 8c). Decoupling the two slab segments results in a lesser reciprocal influence, in the sense that the kinematics no longer correspond to an average buoyancy of some kind. The narrow oceanic slab unit then subducts at its proper rate, faster than the initial rate that corresponds to a wide slab.
Subduction becomes more vigorous, and dynamic topogra-phy exceeds by 1000 m its initial value, prior to the entry of the continental unit into the subduction zone. This additional 1 km downlift is therefore a consequence of mantle flow re-organisation associated to slab narrowing, which in this case promotes faster vertical sinking of the slab.
342˚W 340˚W 338˚W 336˚W 334˚W 332˚W 330˚W 328˚W 34˚N 36˚N 38˚N 40˚N 42˚N 300 km 300 km oceanic plate 300 km 300 km continental plate 300 km 300 400 km 200 100 0 300 km oceanic plate continental plate oceanic plate continental plate 300 km 300 km 1 -1 -0.6 -0.2 curl divergence 0.2 0.6 x 10⁻¹⁵ s-1 0 1.2 2.4 3.6 4.8 6x 10-15 s-1 N N 60° oceanic plate continental plate ▲ ▲ ▲ ▲ ▲ ▲ ▲ ▲ ▲ ▲ ▲ ▲ ▲ ▲ ▲ ▲ ▲ ▲ ▲ ▲ ▲ ▲ ▲ ▲ ▲ ▲ ▲ ▲ ▲ ▲ ▲ ▲ ▲ ▲ ▲ ▲ ▲ ▲ ▲ ▲ ▲ ▲ ▲ ▲ ▲ ▲ ▲ ▲ ▲ ▲ ▲ ▲ ▲ ▲ ▲ ▲ ▲ ▲ ▲ ▲ ▲ ▲ ▲ ▲ ▲▲ ▲ ▲ ▲ ▲ ▲ ▲ ▲ ▲ ▲ ▲ ▲ ▲ ▲ ▲ ▲ ▲ ▲ ▲ ▲ ▲ ▲ ▲ ▲ ▲ ▲▲ ▲ ▲ ▲ ▲
c
14.5 - 25 Myr Late Miocene Pliocene to Quaternary 25 - 38.5 Myrd
a
b
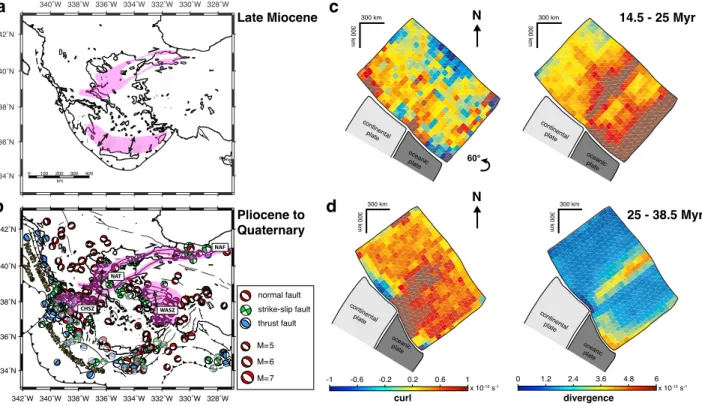
normal fault strike-slip fault thrust fault M=5 M=6 M=7 340˚W 338˚W 336˚W 334˚W 332˚W 330˚W 328˚W 34˚N 36˚N 38˚N 40˚N 42˚N ▲ Cyprus CHSZ WASZ NAF NAT North Hellenic Zone So uth He llen ic ZoneFig. 9. Upper plate deformation within the Aegean region for (a) the Late Miocene and (b) Pliocene to Quaternary periods (after Royden
and Papanikolaou, 2011; Jolivet et al., 2013). The approximate areas affected by extension and/or strike-slip activity for the considered time period are indicated in pink (deformation is not palinspastically restored) and the main active structures and focal mechanisms of earthquakes at depths lower than 50 km (source: CMT, 2011) are shown in (b). Earthquakes with depths between 30 and 50 km are indicated with transparent beachballs. (c) Curl (left panel) and divergence (right panel) computed from the overriding plate horizontal displacement
field for the 14.5–25 Myr time period of model 1. (d) Same as (c) for the 25–38.5 Myr time period. A 60◦counterclockwise rotation has been
applied to panels (c) and (d) to make the trench orientation fit the orientation of the Hellenic trench.
4 Comparison to the Hellenic subduction
4.1 Geological setting
The Hellenic subduction is a small remnant of the vast Tethyan subduction that drove the collision of Africa and Eurasia (Fig. 1). Another few of those small subduction zones are found in the Mediterranean (e.g. Royden, 1993; Malinverno and Ryan, 1986), but the Aegean slab is proba-bly the last that remains powerful enough to be considered an active tectonic system, for the subducting Ionian lithosphere could be the oldest seafloor on Earth (Speranza et al., 2012). In the general framework of the now very slow African-Eurasian collision, the subduction of the Aegean slab, that is attached to Africa, resembles the fixed mode of subduction of our models. Fast rollback accompanied the subduction, triggering pervasive lithospheric extension in the Aegean do-main (see Jolivet et al., 2013, for a review), trenchward mi-grating volcanism and exciting adjacent mantle flow (Paul et al., 2010).
However, this activity did not prevail throughout the en-tire Tertiary (e.g. Papanikolaou and Royden, 2007; Brun and Sokoutis, 2010; Royden and Papanikolaou, 2011; Jolivet
et al., 2013). The Aegean domain globally spreads until Mid-Miocene, until the right lateral North Anatolian Fault (NAF) isolated Anatolia from the Eurasian continent ( ˇSeng¨or et al., 2005; Royden and Papanikolaou, 2011), cut through the Mar-mara Sea and reached the Aegean Sea and formed the North
Aegean Trough (NAT). During that early stage, lithospheric
stretching accommodated slab retreat and faults trended par-allel to the uniformly retreating trench.
Then, a brief Late Miocene to Early Pliocene episode of localised arc parallel extension occurred in the outer rim of the Hellenic arc, in the Cretan Sea and Peloponnese in particular (Fig. 9a). This event is coeval to the inception of the right lateral Kefalonia Fault (Papanikolaou and Royden, 2007) which, from Pliocene onwards, further modified the kinematics of the area. The subduction of a plate of later-ally variable buoyancy along the Hellenic trench could have profoundly modified the Aegean dynamics. Indeed, since Late Miocene times, the Kefalonia Transform Fault isolates the Adriatic continental unit from the Ionian oceanic plate (Kahle et al., 1993; Vassilakis et al., 2011). Subduction rates at the North and South Hellenic trenches occur at rates of 5 to 12 mm yr−1and 25 to 40 mm yr−1(e.g. McClusky et al.,
342˚W 342˚W 340˚W 340˚W 338˚W 338˚W 336˚W 336˚W 334˚W 334˚W 332˚W 332˚W 330˚W 330˚W 328˚W 328˚W 34˚N 34˚N 36˚N 36˚N 38˚N 38˚N 40˚N 40˚N 42˚N 42˚N 1s (Paul et al., 2010) 1s (Evangelidis et al., 2011) 1s (Hatzfeld et al., 2001) −80 −60 −40 −20 0 20 40 60 80 −80 −60 −40 −20 0 20 40 60 80
AZIMUTH OF HORIZONTAL MANTLE FLOW
−80 −60 −40 −20 0 20 40 60 80
AZIMUTH OF PRINCIPAL STRAIN AXIS PHI
N Model after 40 Myr
N Model after 40 Myr
−1500 −1000 km km −500 0 500 100 0 1500 200 0 2500 −2000 −1500 −1000 km −500 0 500 1000 1500 2000 2500 −2000 continental plate oceanicplate a b N. He lle nic su b. South H elle nic s ubd uction 60° c 60° continental plate oceanicplate
Fig. 10. (a) Azimuth (interpolated, colourscale) and delay (bars) of
seismic anisotropy in the Aegean–Anatolian region obtained from SKS waves (green bars, Hatzfeld et al., 2001; black bars, Paul et al., 2010; blue bars, Evangelidis et al., 2011). (b) Azimuth of horizon-tal mantle flow for model 11 after 40 Myr of subduction. Black bars indicate the direction and relative magnitude of mantle flow. The black dashed lined underlines the approximate corresponding re-gion of SKS data shown in Fig. 10a. (c) Azimuth of the principal strain axis for model 11 after 40 Myr of subduction. Black bars
in-dicate the direction of principal strain component. A 60◦
counter-clockwise rotation has been applied to panels (b) and (c) to make the trench orientation fit the orientation of the Hellenic trench.
2000; Royden and Papanikolaou, 2011; P´erouse et al., 2012), respectively, which offsets the South and North Hellenic sub-duction zones by a few tenths of kilometres at present day. The formation of the fault itself results from the entry in the subduction zone of a very negatively buoyant oceanic plate to the south, while in the north the subduction of a continen-tal unit of increasingly positive buoyancy proceeds, as the buoyancy difference of the two plate units suffices to trig-ger a laterally variable regime along the trench (Royden and Papanikolaou, 2011). P- and S-wave velocity perturbations show that the subducted crusts for two sections north and south of the Kefalonia Fault are dextrally offset, implying an additional ∼70–85 km retreat of the southern segment of the slab (Pearce et al., 2012).
The Aegean Sea then migrated along with the trench to the southwest (with respect to stable Eurasia), as an ap-parently almost rigid unit (McClusky et al., 2000; Kreemer and Chamot-Rooke, 2004). Extension is now focussed in the
West Anatolian Shear zone (WASZ), on the western
mar-gin of Turkey, in the Peloponnese and in Mainland Greece (Gautier et al., 1999; Jolivet et al., 2013; Royden and Pa-panikolaou, 2011, Fig. 9b). Only in Mainland Greece and Peloponnese deformation remains somewhat diffuse (Vassi-lakis et al., 2011; Bradley et al., 2013); only in this area the Anatolian plate is not separated from Eurasia by a discrete right lateral fault. The Kefalonia Fault could be linked to the North Anatolian Fault via the diffuse transtensional
Cen-tral Hellenic Shear zone (CHSZ) (Royden and Papanikolaou,
2011) that separates the Peloponnese from Mainland Greece (Fig. 9b). In this area, normal faults, including the Corinth Rift, developed obliquely to the trench. From north to south, faults trend ∼ N90 in Mainland Greece, gently swing to
∼N120 across the Gulf of Corinth, and reach ∼ N170
(ap-proximately trench parallel) in the South Peloponnese (e.g. Doutsos, 2001). From the western tip of the NAF to the Ke-falonia Fault (i.e. in the NAT and CHSZ), only normal fault-ing is unequivocally identified; this lead P´erouse et al. (2012) to advocate that the GPS inferred strain field does not require any dextral shear component in this area.
Despite the inherent oversimplifications of our experimen-tal setup, our dynamic models resemble the Hellenic subduc-tion by many aspects. The Kefalonia Fault shall be consid-ered as the tear fault (possibly shear-stress free) that begins to isolate plate units of contrasted buoyancies, as in the early stages of our models. In the following, we interpret the ob-servables for the Hellenic subduction (trench and upper plate kinematics, mantle flow and topography) at the light of our dynamic models.
4.2 The Hellenic trench
The Hellenic trench initially migrated continuously along the outer rim of the Aegean domain. It accompanied the global expansion and spreading, that is well reproduced by our mod-els, where the initially linear trench becomes concave during
trench retreat (Fig. 4), as in earlier models (e.g. Funiciello et al., 2003; Morra et al., 2006; Loiselet et al., 2009). The shape of the trench responds efficiently to the entry of a plate of laterally variable buoyancy into the subduction zone. In the models, it corresponds to the introduction of a low buoy-ancy unit that locally decreases the trench migration rates (Fig. 3); in the Hellenides it is the introduction of the old Io-nian oceanic lithosphere after the consumption of the Adria block that speeds up trench migration to the south. In both cases, the difference in trench migration rates imposed by lateral slab buoyancy variability increases by a few tenths of mm yr−1 after a few million years. It is accompanied, in the models, either by a viscous shear of the subducting plate when no built-in tear fault accommodates the differen-tial trench motion, or by a right lateral slip along the tear fault when present (Fig. 4). This setting is akin to the Kefalonia Fault, and we confirm that it is this mechanism that excites the Kefalonia Fault and that offsets the margin of the overrid-ing plate by some ∼ 100 km at a rate of ∼ 14 to 25 mm yr−1 (Vassilakis et al., 2011; Royden and Papanikolaou, 2011). This value corresponds to the difference in the trench veloci-ties of the northern and southern Hellenic subduction zones, a figure that is also obtained in the models after a few mil-lion years (Fig. 3). Interestingly, the models show that it takes more than ∼ 4 Myr, i.e. the time since the onset of the activ-ity of the Kefalonia Fault, before steady state is reached. This suggests that the slip rates along the Kefalonia Fault may be accelerating and continue to speed up in the future (along with an acceleration of the southern trench migration, as also shown by Royden and Papanikolaou, 2011).
Trench depth varies along strike; while in the Northern Hellenides the trench is shallower than ∼ 1000 m, in the southern counterpart, it is more than 3000 m deep (Fig. 11). The absolute trench depth in the models overshoots that fig-ure by 5000 to 8000 m (Fig. 5b, c, and Husson et al., 2012), because our setup does not account for faults (as in Zhong and Gurnis, 1994, for instance), and because the meniscus caused by surface tension increases the depth by a constant. Those undesired effects are particularly high at low rates. However, relative depths for similar subduction rates are comparable in our models (Fig. 5c), i.e. some 2000 to 4000 m deeper for fast subducting plates (at ∼ 30 mm yr−1) than for the slowly subducting plates (at ∼ 10 mm yr−1). This results confirms that the along strike variations in the Hellenic trench depth mirror the laterally variable subduction rates. Y´a˜nez et al. (2004) found similar results for the Andean subduc-tion, i.e. trench depth is controlled by convergence rate but also by interplate coupling.
4.3 Aegean deformation
Trench migration in our models follows the mechanism that was initially proposed by Royden and Papanikolaou (2011). In addition, our models explore the impact of the inception of the Kefalonia Fault onto the upper plate. Silicone plates
be-have as quasi-Newtonian fluids at experimental strain rates. Thus, in our simplified model, upper plate deformation is dif-fuse and the models do not produce any of the faults that may also accommodate deformation of the overriding litho-sphere in nature. In addition, strength layering that may pro-duce significant deformation partitioning over the lithosphere thickness is not accounted for. However, upon the assump-tion that the brittle crustal deformaassump-tion is a surface expres-sion of the overall viscous lithospheric deformation, the first-order comparison between the continuous deformation of the models to the discrete deformation observed on Earth holds. Indeed, our models show comparable patterns of deformation and may explain the temporal evolution of Aegean tecton-ics though, of course, the diffuse deformation and the unac-counted Anatolian extrusion prevent the reproduction of the discrete dextral shear found in the NAT and NAF.
During the early stage of Aegean expansion, prior to the inception of the Kefalonia Fault, lithospheric stretching ac-commodated slab retreat and faults trended parallel to the uniformly retreating trench, in agreement with the deforma-tion seen during the early stages of our models: extension is widespread and reaches its fastest rate on the entire plate (Fig. 7a). The inception of the tear fault initiated a non-uniform rollback and trench migration (see Sect. 4.2) that caused a wholesale rotation of the upper plate around a Euler pole located some 1200 km from the triple junction (Fig. 7b). Deformation remained essentially extensional, and the defor-mation axis in the models show that normal faults in front of the oceanic unit are expected to trend parallel to the trench (Fig. 7b). This episode explains the arc parallel “transitional” episode of deformation of Papanikolaou and Royden (2007) (Fig. 9a).
The third stage of deformation (Fig. 7c) occurs at the time where the tear fault reaches mantle depths. Then, the Euler pole shifts to a much closer location to the triple junction between the tear fault and the trench, at ∼ 300 km. It ap-proximately matches the location of the Euler pole for post-Eocene (and probably post-Oligocene) rotations that was found close to Scutari-Pec, Albania, on the basis of paleo-magnetic measurements (Speranza et al., 1992). It is similar to the Euler pole proposed by van Hinsbergen et al. (2005) on the basis of paleomagnetic measurements for western Greece, on average since Mid-Miocene (thus compatible). It also matches the location of the Euler pole found by Brun and Sokoutis (2010), on the basis of a comparison between stretching lineations and seismic anisotropy; however, these authors reach slightly contrasting conclusions, for they sug-gest that the location of the pole has remained stationary for the last 45 Myr, while our models suggests it may have only began since the onset of the Kefalonia Fault. The rotation pole in our model is also a little further from the rotation pole proposed by P´erouse et al. (2012) from kinematic indi-cators. That rotation is accompanied by strong extension in the vicinity of the trench. In the models, the extension axis is approximately oriented N–S in front of the triple junction,