HAL Id: hal-02383893
https://hal.archives-ouvertes.fr/hal-02383893
Submitted on 28 Nov 2019
HAL is a multi-disciplinary open access
archive for the deposit and dissemination of
sci-entific research documents, whether they are
pub-lished or not. The documents may come from
teaching and research institutions in France or
abroad, or from public or private research centers.
L’archive ouverte pluridisciplinaire HAL, est
destinée au dépôt et à la diffusion de documents
scientifiques de niveau recherche, publiés ou non,
émanant des établissements d’enseignement et de
recherche français ou étrangers, des laboratoires
publics ou privés.
of Crustal Extension, Western Afar (Ethiopian Rift)
Dereje Ayalew, Raphaël Pik, Nicolas Bellahsen, Lyderic France, Gezahegn
Yirgu
To cite this version:
Dereje Ayalew, Raphaël Pik, Nicolas Bellahsen, Lyderic France, Gezahegn Yirgu. Differential
Frac-tionation of Rhyolites During the Course of Crustal Extension, Western Afar (Ethiopian Rift).
Geo-chemistry, Geophysics, Geosystems, AGU and the Geochemical Society, 2019, 20 (2), pp.571-593.
�10.1029/2018GC007446�. �hal-02383893�
Differential Fractionation of Rhyolites During the Course
of Crustal Extension, Western Afar (Ethiopian Rift)
Dereje Ayalew1 , Raphaël Pik2, Nicolas Bellahsen3, Lydéric France2 , and Gezahegn Yirgu1 1
School of Earth Sciences, Addis Ababa University, Addis Ababa, Ethiopia,2CRPG, UMR 7358 CNRS-Université de Lorraine, 15 rue ND des pauvres, BP20, Vandoeuvre-lès-Nancy Cedex, France,3Sorbonne Université, CNRS, Institut des Sciences de la Terre Paris, ISTeP UMR 7193, Paris, France
Abstract
We reportfield observation, age, chemical (major and trace elements), and isotope (Sr-Nd-Pb) data for felsic volcanic rocks from Central Afar and adjacent western margin. Investigated volcanic rocks are dominantly rhyolites with minor trachytes, and they are geochemically similar. Their ages range from ~30 Ma (prerift stage), ~20 Ma (early synrift), ~8–4 Ma (main thinning event) to ~2.5–0.1 Ma (late synrift/continental breakup), representing the entire volcanic-tectonic events that occurred episodically. Major element variations are consistent with fractionation of gabbroic cumulates. Trace element and isotope data preclude an origin by crustal anatexis; the rhyolites are rather genetically linked to the associated basalts and variously contaminated by the crust during differentiation of magmas. Chemical and isotopic data of the rhyolites support an origin by open system differentiation at deep crustal levels (hot wall rock and high r = rate of assimilation/rate of crystallization) and shallow crustal levels (cold wall rock and low r) with a change in the composition of the assimilated material from lower crustal to upper crustal type. Assimilation appears to decrease in recent times with Quaternary rhyolites, emplaced nearby the active magmatic segments in Afar, which exhibit the isotopic compositions closest to original mantle signature. This is compatible with a crust below the active magmatic segments resulting from important addition of juvenile basic magmas. Such results and interpretations provide actual constrains to suggest that the present-day stage is probably very close to continental breakup, which will be achieved once the continental crust will be entirely replaced by new magmatic crust.1. Introduction
Rhyolites are commonly found in continental rift zones, though their abundances vary obviously from pro-vince to propro-vince. The abundance of rhyolites is thought to be related to the supply rate of basaltic magma (e.g., Geist et al., 1995; Hutchison et al., 2018; Mahoney et al., 2008); when the input of basaltic magma is high, the system is swamped by basaltic components, whereas when the supply rate of basaltic magma declines or stops, more silicic melts dominate the system. The amount of rhyolite may also be a function of lithospheric extension (e.g., Hutchison et al., 2018; Storey et al., 1995); rhyolites are found at early stage of extension, while basalts are abundant at advanced stage of rifting.
The generation of rhyolites, with SiO2contents in excess of 70 wt.%, remains a matter of debated issue.
Combination of three end-member mechanisms is commonly invoked to explain such magmas: (1) anatectic melting of crust (e.g., Bohrson & Reid, 1997; Cameron et al., 1996; Pichavant et al., 1988; Riley et al., 2001), (2) remelting of solidified basalt or its derivative intruded within or underplated to the crust during the same volcanic episode (e.g., France et al., 2010, 2014; Garland et al., 1995; Miller & Harris, 2007), and (3) fractional crystallization of a more mafic magma with or without crustal contamination (e.g., France et al., 2016; Hutchison et al., 2018; Macdonald, 2012; Medlin et al., 2014; Natali et al., 2011; Rooney et al., 2012; Thorarinsson et al., 2012). Modeling indicates that evolved melts can be generated simultaneously from both basalt crystallization and crustal partial melting (Annen et al., 2006; Annen & Sparks, 2002). Whether an origin by fractional crystallization or by partial melting for the formation of the rhyolites largely depends on the dis-tance of the rhyolite to the rifted zone (e.g., Selbekk & Trønnes, 2007); partial melting is an important process in the formation of rhyolites erupted near the rift zones, whereas fractional crystallization prevails for rhyolites erupted far from the rift zones. There is yet little consensus on any of these models.
Ethiopia has been the site of extensive bimodal basalt-rhyolite volcanism since 45 Ma (Ebinger et al., 1993; George et al., 1998). The rhyolites are spatially associated with basalts over the entire eruptive period
RESEARCH ARTICLE
10.1029/2018GC007446Special Section:
Magmatic and volcanic processes in continental rifts
Key Points:
• The origin of rhyolite over the last 30 Ma has been addressed • An attempt was made to understand
the evolution of crustal contamination through time • The relations between rhyolite
genesis and rifting have been constrained
Correspondence to:
D. Ayalew,
Citation:
Ayalew, D., Pik, R., Bellahsen, N., France, L., & Yirgu, G. (2019). Differential fractionation of rhyolites during the course of crustal extension, Western Afar (Ethiopian rift). Geochemistry,
Geophysics, Geosystems, 20, 571–593.
https://doi.org/10.1029/2018GC007446 Received 8 MAR 2018
Accepted 24 NOV 2018
Accepted article online 28 NOV 2018 Published online 1 FEB 2019
©2018. American Geophysical Union. All Rights Reserved.
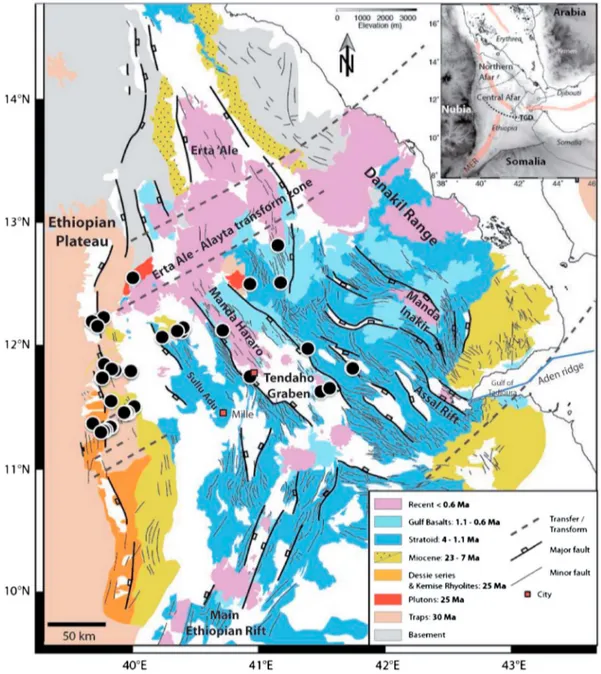
(Ayalew et al., 2006). Understanding the process that leads to the formation of rhyolites in bimodal system is a major goal of studies of continental magmatism as it provides valuable information on the interaction between mantle-derived melts and the crust. In this study, we report field observation, age, chemical (major and trace elements), and isotope (Sr-Nd-Pb) data for felsic volcanic rocks emplaced over the entire magmatic episodes ranging in age from ~30 Ma (prerift stage), ~20 Ma (early synrift), ~8–4 Ma (main thinning event) to ~2.5–0.1 Ma (late synrift/continental breakup), from the Ethiopian Plateau down to the active Central Afar volcanic segment (Manda Hararo rift segment; Figure 1). Details offield relations of the investigated samples are reported in Table 1. We use the newly established volcanic-tectonic history of the Central Afar segment (Stab et al., 2016) to examine the geochemical evolution with time of felsic volcanics during the course of rifting as it has progressed to breakup processes expressed in the Afar Depression. Ourfindings support the new structural (Stab et al., 2016) result of the Western Afar segment.
Figure 1. Geological map of the Afar Depression (after Stab et al., 2016), showing the distributions of the investigated samples (filled circles). Inset shows the Afro-Arabian triple rift junction.
Table 1
Summary of the Geological Features of the Studied Samples
Sample Lat. Long. Rock type Age (Ma) Age justification Location
Quaternary Afar rhyolites
AF13-30 12.4789 41.1601 Rhyolite 0.52 Same location as Lahitte et al. (2003)
sample 75BI
Tat’Ale active segment
AF13-25 12.7665 41.1389 Ryholite 0.10 Field correlation with Lahitte et al. (2003) Tat’Ale active segment
AF15-17 11.8065 41.7389 Dacite 2.50 Field correlation with Lahitte et al. (2003) Stratoïde formation
AF15-19 11.8093 41.7402 Rhyolite 2.50 Field correlation with Lahitte et al. (2003) Stratoïde formation
AF15-11 11.9622 41.3816 Rhyolite 1.32 Same location as Lahitte et al. (2003)
sample 75BY1
Stratoïde formation, Serdo rhyolite, eastern Tendaho graben
AF13-340 11.7417 40.9150 Rhyolite 1.30 Field correlation with Lahitte et al. (2003) Stratoïde formation, western
Tendaho graben
AF15-10 11.6253 41.4859 Rhyolite 0.56 Field correlation with Lahitte et al. (2003) Borawly volcano, near Assaita,
southern Tendaho graben
AF15-07A 11.6519 41.5545 Rhyolite 0.50 Field correlation with Lahitte et al. (2003) East of Assaita, southern
Tendaho graben
AF13-337 12.1058 40.6950 Rhyolitic tuff 0.70 Field correlation with Lahitte et al. (2003) Interbedded in Gulf basalts, west of Manda Hararo active segment
AF13-335 12.1058 40.6950 Rhyolite 0.70 Field correlation with Lahitte et al. (2003) Interbedded in Gulf basalts, west
of Manda Hararo active segment Late Miocene-Pliocene margin synrift rhyolites (Bokeksa-Arabati section)
AF12-15 12.0508 40.2039 Rhyolite 4.00 Stab et al. (2016) Pliocene horizontal synrift lava,
west of Sullu Adu
AF13-74 12.0983 40.3261 Andesite 4.00 Field correlation with Lahitte et al. (2003) Pliocene intermediate lava = topflow?
AF15-40 12.4657 40.9151 Rhyolite 4.00 Field correlation with Lahitte et al. (2003) Pliocene horizontal synrift lava,
NE Tendaho graben, Da’Aal and Affara Dara
AF12-21 11.4630 39.9355 Rhyolite 7.5 Stab et al. (2016) Boksa-Arabati section in the margin
Arabati-1 11.5085 39.9812 Rhyolite 7.5 Field correlation with this study Chiffra-1
and Stab et al. (2016)
Boksa-Arabati section in the margin
Arabati-2 11.4645 39.9222 Rhyolite 7.5 Field correlation with this study Chiffra-1
and Stab et al. (2016)
Boksa-Arabati section in the margin
Arabati-3 11.4583 39.9060 Rhyolite 7.5 Field correlation with this study Chiffra-1
and Stab et al. (2016)
Boksa-Arabati section in the margin
Galina-1 11.5510 39.7909 Rhyolite 6.3 This study Boksa-Arabati section in the margin
AF13-97 11.4637 39.9000 Rhyolite 6.3 Field correlation with this study Boksa-Arabati section in the margin
Early Miocene margin synrift rhyolites (Marginal graben dykes and Afar Finto section)
Hara-1 11.8385 39.7392 Rhyolite 21.0 Field correlation with this study
Woldia-1
Giant marginal rhyolitic dykes near Woldia-Hara
Hara-2 11.7905 39.8232 Rhyolite 22.6 This study Giant marginal rhyolitic dykes
near Woldia-Hara
Hara-3 11.8041 39.7967 Intermediate 17.4 This study Marginal dykes near Woldia-Hara
Hara-4 11.7396 39.7218 Rhyolite 17.4 Field correlation with this study Marginal dykes near Woldia-Hara
Hara-5 11.7350 39.7185 Basaltic
trachyandesite
17.4 Field correlation with this study Marginal dykes near Woldia-Hara
Hara-6 11.7310 39.7190 Rhyolite 17.4 Field correlation with this study Marginal dykes near Woldia-Hara
AF13-89 Rhyolite 22.0 Field correlation with Stab et al. (2016) Miocene tilted synrift lava, Finto section
AF12-08 12.1252 40.3798 Rhyolite 22.0 Field correlation with Stab et al. (2016) Miocene tilted synrift lava, Finto section
AF12-09 12.1253 40.3775 Rhyolite 22.0 Field correlation with Stab et al. (2016) Miocene tilted synrift lava, Finto section
AF13-73 12.0964 40.3623 Trachyandesite 22.0 Field correlation with Stab et al. (2016) Miocene tilted synrift lava, Finto section Oligocene prerift trap rhyolites (marginal graben and plateau)
AF12-04 12.5125 39.9705 Granite 29.0 Field correlation with this study Limmo granite, bottom of the margin
AF12-10 12.1236 40.3736 Rhyolite 29.7 Stab et al. (2016) Oligocene tilted basement rhyolite
of Finto section
AF13-92R 11.7850 39.9541 Rhyolite 29.0 Field correlation with Stab et al. (2016) Oligocene tilted basement rhyolite
of Allale Sullula, bottom margin
AF13-92 11.7850 39.9541 Trachyandesite 29.0 Field correlation with Stab et al. (2016) Oligocene tilted basement rhyolite
of Allale Sullula, bottom margin
2. Geological Background
The magmatic and tectonic events of the region from western marginal graben to active magmatic segment in the Afar Depression have been well documented recently by Doubre et al. (2007), Kogan et al. (2012), Lahitte et al. (2003), McClusky et al. (2010), Medynski et al. (2013, 2015, 2016), and Stab et al. (2016). Volcanism began in the early Oligocene prior to the onset of significant extension, with extrusion of huge volumes offlood basalts and associated rhyolites (Ayalew et al., 2002; Pik et al., 1999; Zanettin & Piccirillo, 1980), forming the so-called spectacular Ethiopian high-plateau between 31 and 29 Ma (Hofmann et al., 1997). The early magmatic episode traditionally referred to as continentalflood basalt or traps formation exposed along both sides of the rift escarpments and locally in the Afar Depression (Varet, 1975). Following the end of traps formation, the Dessie formation (mainly basalts) emplaced at 25 Ma (Ukstins et al., 2002). The Dessie formation is locally restricted to the present-day marginal graben and overlies conform-ably the traps formation. During the Miocene, volcanic activity decreased and occurred in two phasesfirst at 23–22 Ma and second at 8–6 Ma (Stab et al., 2016). The Miocene formations are variably named Chifra series or Finto series and mainly consist of felsic products that are tilted and unconformably overlying the
Table 1 (continued)
Sample Lat. Long. Rock type Age (Ma) Age justification Location
Hayk-2 11.3580 39.7867 Rhyolite 29.9 This study Marginal graben rhyolites, Hayk section
Hayk-3 11.3527 39.7907 Rhyolite 28.5 This study Marginal graben rhyolites, Hayk section
Hayk-4 11.3521 39.7907 Rhyolite 29.5 This study Marginal graben rhyolites, Hayk section
Arabati-4 11.3507 39.7899 Rhyolite 29.0 Field correlation with this study Marginal graben rhyolites, Hayk section
Hayk-5 11.3505 39.7850 Rhyolite 29.0 Field correlation with this study Marginal graben rhyolites, Hayk section
Arabati-5 11.3255 39.7506 Rhyolite 29.0 Field correlation with this study Marginal graben rhyolites, Hayk section
Hayk-6 11.3166 39.7331 Rhyolite 30.8 This study Marginal graben rhyolites, Hayk section
Hayk-7 11.3077 39.7123 Rhyolite 29.3 This study Marginal graben rhyolites, Hayk section
Kobo-1 12.2037 39.7300 Rhyolite 29.0 Field correlation with this study Dyke Kobo section
Kobo-3 12.1739 39.6379 Rhyolite 28.7 This study Granophyre Kobo plain
Kobo-8 12.1351 39.6854 Rhyolite 29.0 Field correlation with this study Granophyre Kobo plain
Table 2
U-Th-Sm)/He Dating of Zircons From Ethiopian Marginal Rhyolites
Sample Lat. Long.
Weight (mg) Length (μm) Width (μm) FT mean 4He (mol/g) 232Th (ppm) 238U (ppm) 147Sm (ppm) Age (Ma) Corrected age (Ma) Uncertainty (±Ma) Late Miocene margin synrift rhyolites (Bokeksa-Arabati section)
Chiffra #1 11.6043 40.0116 0.0209 304 148 0.86 6.77E 09 94 171 33 6.5 7.6 0.5
Chiffra #2 0.0239 321 153 0.86 6.19E 09 89 155 61 6.5 7.5 0.5
Galina-1 #1 11.5510 39.7909 0.056 308 155 0.88 1.09E 07 3228 2578 208 6.0 6.8 0.4
Galina-1 #2 0.023 265 140 0.87 1.23E 07 1869 4176 156 5.0 5.7 0.3
Early Miocene margin synrift rhyolites (Marginal graben dykes and Afar Finto section)
Hara-2 #1 11.7905 39.8232 0.094 377 222 0.91 4.86E 07 7099 2383 485 22.2 24.3 1.5
Hara-2 #2 0.157 389 226 0.91 3.55E 07 5309 1931 356 20.6 22.6 1.4
Hara-3 11.8041 39.7967 0.086 389 226 0.92 1.68E 08 101 171 78 16.0 17.4 1.0
Woldia-1 #1 11.8784 39.6969 0.048 201 124 0.84 4.38E 08 212 414 73 17.5 20.9 1.3
Woldial-1 #2 0.077 314 139 0.88 3.96E 08 196 370 70 17.6 20.0 1.2
Oligocene prerift trap rhyolites (marginal graben and plateau)
Kobo3 12.1739 39.6379 0.096 245 183 0.87 9.44E 08 1773 281 117 25.0 28.7 1.7 Hayk-2 11.3580 39.7867 0.02 314 123 0.87 4.45E 08 229 261 317 26.2 29.9 1.8 Hayk-3 11.3527 39.7907 0.028 220 147 0.86 1.53E 07 1415 824 120 24.5 28.5 1.7 Hayk-4 11.3521 39.7907 0.033 243 135 0.86 1.09E 07 1298 491 1459 25.4 29.5 1.8 Hayk-6 11.3166 39.7331 0.095 324 247 0.87 1.35E 07 1352 609 3718 26.9 30.8 1.8 Hayk-7 11.3077 39.7123 0.049 312 151 0.88 8.15E 08 688 425 89 25.7 29.3 1.8
Table 3
Major (wt%) and Trace (ppm) Element Analyses of Felsic Volcanic Rocks From Western Afar Segment Oligocene prerift trap rhyolites
Sample AF13-337 AF15-17 AF15-19 AF13-335 AF13-25 AF15-10 AF13-340 AF13-30 AF15-11 AF15-07A
Age (Ma) 0.70 2.50 2.50 0.7 0.10 0.56 1.30 0.52 1.32 0.50 Lat. 12.1058 11.8065 11.8093 12.1058 12.7665 11.6253 11.7417 12.4789 11.9622 11.6519 Long. 40.6950 41.7389 41.7402 40.6950 41.1389 41.4859 40.9150 41.1601 41.3816 41.5545 SiO2 63.51 64.52 66.15 66.66 67.98 70.64 70.72 72.21 73.02 74.82 TiO2 0.35 1.13 0.57 0.42 0.66 0.23 0.30 0.23 0.23 0.19 Al2O3 11.80 12.84 13.74 13.10 12.82 14.34 12.51 12.26 12.75 12.89 Fe2O3 3.48 8.88 4.51 4.58 5.60 3.25 4.06 3.36 3.45 1.45 MnO 0.09 0.18 0.11 0.14 0.14 0.10 0.07 0.07 0.08 0.04 MgO 0.51 0.76 0.74 0.30 0.59 0.11 0.23 0.06 0.09 0.18 CaO 3.83 2.53 2.12 2.24 2.23 1.22 0.77 0.99 0.73 1.22 Na2O 3.77 4.27 3.91 4.06 4.06 4.88 4.13 4.20 4.70 3.67 K2O 4.09 2.63 3.63 3.98 3.59 3.97 4.34 4.35 4.03 4.25 P2O5 LD 0.39 LD LD 0.17 LD LD LD LD LD Total 91.42 98.13 95.46 95.47 97.85 98.74 97.13 97.72 99.09 98.71 LOI 8.18 1.45 3.50 4.76 2.07 1.30 1.72 1.46 0.86 1.46 Be 4.4 3.4 3.7 4.7 4.3 4.6 6.2 4.2 6.4 3.1 V 12.6 11.0 1.8 10.0 15.7 4.5 2.2 5.7 3.7 3.4 Zn 122 168 113 141 143 140 158 120 191 33 Ga 22.2 27.3 24.3 24.6 26.9 29.9 27.5 26.2 31.7 16.8 Ge 1.8 2.2 1.5 2.1 1.9 2.2 2.1 1.7 2.4 1.3 Rb 80 65 72 84 73 82 104 99 87 109 Sr 207 240 158 144 167 122 85 98 116 98 Y 78 82 84 89 94 90 99 79 106 27 Zr 586 669 728 750 806 562 855 678 613 178 Nb 66 71 65 86 85 97 111 72 121 23 Sn 7.0 6.5 7.3 8.2 6.2 7.8 9.8 5.3 8.9 3.8 Cs 0.9 1.4 4.0 1.0 1.0 1.2 0.8 1.5 0.5 1.3 Ba 695 531 534 692 615 892 827 989 827 694 La 70 69 69 77 84 107 100 80 106 52 Ce 148 141 140 162 181 216 205 166 218 89 Pr 17.33 17.62 16.97 19.58 22.03 25.23 24.80 20.11 27.84 8.95 Nd 67 73 67 76 86 95 94 78 108 29 Sm 14.04 16.66 15.06 16.12 18.56 18.84 19.44 16.38 22.98 5.17 Eu 2.66 4.63 3.56 3.30 4.26 3.76 3.63 3.18 5.14 1.07 Gd 12.85 15.65 13.93 14.64 16.80 16.32 17.24 14.63 20.35 4.37 Tb 2.17 2.60 2.40 2.50 2.77 2.71 2.94 2.41 3.40 0.70 Dy 14.04 15.94 15.06 16.17 16.57 16.85 18.42 14.60 20.64 4.52 Ho 3.02 3.25 3.15 3.48 3.29 3.49 3.87 2.82 4.20 0.96 Er 8.44 8.55 8.58 9.77 9.17 9.50 10.56 7.93 11.07 2.79 Tm 1.22 1.18 1.21 1.44 1.38 1.36 1.51 1.23 1.54 0.42 Yb 8.31 7.93 8.38 9.80 8.95 9.45 10.34 8.08 10.41 3.02 Lu 1.24 1.18 1.27 1.48 1.34 1.42 1.57 1.19 1.54 0.47 Hf 16.2 16.4 18.3 19.9 18.4 15.7 21.5 16.2 19.0 5.3 Ta 5.2 5.5 5.3 6.5 6.4 7.6 8.7 5.4 9.4 2.9 Pb 9.9 6.9 7.4 10.2 10.9 10.2 12.0 10.1 9.8 9.9 Th 10.9 9.6 12.8 12.0 11.2 15.1 17.4 12.5 15.1 16.9 U 2.9 2.7 3.7 3.1 2.9 3.5 4.2 3.0 3.0 4.1
Late Miocene-Pliocene margin synrift rhyolites (Bokeksa-Arabati section)
Sample AF13-74 Arabati-2 AF15-40 AF12-15 Arabati-3 AF12-21 Galina-1
Age (Ma) 4.00 7.5 4.00 4.00 7.5 7.50 6.3 Lat. 12.0983 11.4645 12.4657 12.0508 11.4583 11.4630 11.5510 Long. 40.3261 39.9222 40.9151 40.2039 39.9060 39.9355 39.7909 SiO2 59.33 67.78 71.12 74.49 75.80 76.78 77.08 TiO2 1.79 0.50 0.38 0.18 0.20 0.14 0.06 Al2O3 13.50 13.42 12.73 12.21 11.42 11.90 11.34 Fe2O3 8.91 3.90 3.93 1.80 1.87 1.36 1.39
Table 3 (continued)
Late Miocene-Pliocene margin synrift rhyolites (Bokeksa-Arabati section)
Sample AF13-74 Arabati-2 AF15-40 AF12-15 Arabati-3 AF12-21 Galina-1
Age (Ma) 4.00 7.5 4.00 4.00 7.5 7.50 6.3 Lat. 12.0983 11.4645 12.4657 12.0508 11.4583 11.4630 11.5510 Long. 40.3261 39.9222 40.9151 40.2039 39.9060 39.9355 39.7909 MnO 0.14 0.04 0.11 0.02 0.01 0.00 0.01 MgO 1.75 0.23 0.24 0.06 0.03 0.05 0.12 CaO 4.94 1.55 0.86 0.79 0.19 0.09 0.16 Na2O 4.12 2.93 4.58 3.28 3.81 3.94 2.91 K2O 1.65 5.17 4.07 5.18 4.77 4.90 4.29 P2O5 0.57 0.10 LD 0.13 LD LD LD Total 96.70 95.63 98.02 98.14 98.08 99.16 97.36 LOI 2.56 4.26 1.63 1.17 0.93 0.30 1.46 Be 2.5 4.7 3.6 3.8 4.0 4.0 9.3 V 126 15.3 18.6 5.9 0.8 4.8 5.5 Zn 140 68 119 69 127 75 110 Ga 25.8 21.4 24.8 24.0 31.7 28.1 28.0 Ge 1.5 1.6 2.0 1.4 1.8 1.6 2.4 Rb 145 123 82 143 142 182 311 Sr 450 97 107 27 5.9 4.8 7.6 Y 44 92 68 57 114 82 30 Zr 378 489 570 272 834 418 176 Nb 31 15 76 36 48 29 46 Sn 3.8 7.3 6.9 7.6 14.0 9.9 15.6 Cs 1.9 2.6 0.5 1.1 1.0 2.7 2.4 Ba 618 865 851 274 13 14 16 La 44 55 77 59 11 79 15 Ce 95 97 155 115 35 146 58 Pr 12.4 13.6 19.1 14.1 3.4 20.6 3.0 Nd 52.5 53.9 73.6 52.7 15.0 80.2 9.9 Sm 11.9 11.7 15.1 10.7 6.0 17.9 2.4 Eu 3.25 1.65 2.96 0.63 0.44 0.42 0.09 Gd 10.39 11.43 13.31 9.48 10.20 15.60 2.33 Tb 1.55 1.92 2.15 1.61 2.34 2.61 0.57 Dy 8.70 12.48 13.28 10.37 18.24 16.25 4.47 Ho 1.56 2.61 2.72 2.22 4.13 3.38 1.10 Er 4.06 7.97 7.36 6.09 13.38 8.98 4.38 Tm 0.57 1.23 1.04 0.92 2.16 1.34 0.95 Yb 3.57 7.87 7.04 6.29 14.86 9.11 8.07 Lu 0.52 1.22 1.04 0.95 2.20 1.30 1.31 Hf 9.0 11.9 16.8 9.2 22.9 13.8 9.6 Ta 2.5 1.2 5.8 2.9 3.9 2.3 5.4 Pb 13.6 20.6 11.0 17.0 9.5 17.4 57.0 Th 9.3 13.8 11.8 15.2 19.8 18.2 30.7 U 4.7 4.6 2.8 4.3 4.7 5.7 11.9
Early Miocene margin synrift rhyolites (Marginal graben dykes and Afar Finto section)
Sample Hara-5 AF13-73 Hara-3 AF12-09 Hara-2 Hara-6 Hara-4 Hara-1 AF12-08 AF13-89
Age (Ma) 17.4 22.00 17.4 22.00 22.6 17.4 17.4 21 22.00 22.00 Lat. 11.7350 12.0964 11.8041 12.1253 11.7905 11.7310 11.7396 11.8385 12.1252 Long. 39.7185 40.3623 39.7967 40.3775 39.8232 39.7190 39.7218 39.7392 40.3798 SiO2 51.47 57.51 62.97 67.30 71.21 72.28 72.87 72.97 74.78 76.60 TiO2 2.29 1.72 1.60 0.65 0.71 0.63 0.57 0.60 0.48 0.48 Al2O3 16.44 12.83 13.01 13.03 13.44 12.51 12.38 12.27 11.68 10.05 Fe2O3 9.55 8.54 6.79 3.27 3.39 3.18 2.98 3.26 2.11 2.64 MnO 0.11 0.08 0.17 0.21 0.15 0.12 0.13 0.13 0.02 0.04 MgO 2.80 1.35 2.16 0.51 0.08 0.10 0.14 0.08 0.08 0.06 CaO 6.23 4.80 2.98 0.97 0.13 0.67 0.21 0.11 0.35 0.22 Na2O 3.72 2.97 4.40 3.58 4.26 3.62 4.03 3.74 4.26 3.13 K2O 2.36 3.04 3.24 6.24 4.31 5.14 4.53 4.61 4.86 4.55
Table 3 (continued)
Early Miocene margin synrift rhyolites (Marginal graben dykes and Afar Finto section)
Sample Hara-5 AF13-73 Hara-3 AF12-09 Hara-2 Hara-6 Hara-4 Hara-1 AF12-08 AF13-89
Age (Ma) 17.4 22.00 17.4 22.00 22.6 17.4 17.4 21 22.00 22.00 Lat. 11.7350 12.0964 11.8041 12.1253 11.7905 11.7310 11.7396 11.8385 12.1252 Long. 39.7185 40.3623 39.7967 40.3775 39.8232 39.7190 39.7218 39.7392 40.3798 P2O5 0.66 0.43 0.37 0.09 0.09 0.09 0.08 0.07 0.09 0.07 Total 95.64 93.27 97.68 95.84 97.76 98.35 97.92 97.84 98.71 97.82 LOI 3.89 5.49 1.87 3.99 1.32 1.49 1.48 1.11 0.56 0.98 Be 2.5 2.2 3.7 4.4 3.3 3.8 4.0 4.5 5.3 3.8 V 194 159 113 17 22 15 13 14 11 12 Zn 125 113 147 179 166 145 154 150 98 124 Ga 26.9 21.5 28.3 32.1 31.9 31.8 33.5 32.8 34.4 29.4 Ge 1.5 1.2 2.1 2.1 2.2 2.0 2.2 2.5 2.5 2.0 Rb 46 83 60 141 72 84 80 81 126 89 Sr 843 238 324 282 118 77 35 26 26 18 Y 38 36 54 64 61 61 64 67 76 55 Zr 464 320 523 706 448 537 575 616 935 544 Nb 48 25 52 84 56 64 67 72 102 67 Sn 3.7 5.0 4.7 6.6 8.3 6.0 6.4 6.7 8.4 5.7 Cs 0.7 0.4 LD 2.1 0.2 0.4 0.6 0.4 0.4 0.7 Ba 854 582 773 1138 1039 805 742 691 327 515 La 58 39 79 88 126 108 100 112 94 71 Ce 131 84 172 194 207 229 224 243 211 154 Pr 17.02 10.58 21.02 23.66 33.06 27.87 26.28 29.27 25.27 18.97 Nd 70 44 83 94 132 109 102 115 97 75 Sm 13.5 9.9 15.9 18.5 23.3 19.7 19.3 21 20.3 15.7 Eu 3.98 2.78 4.12 5.27 5.98 5.01 4.93 5.19 4.30 3.85 Gd 10.99 8.73 13.10 14.91 17.72 15.38 15.18 16.03 16.69 12.80 Tb 1.53 1.30 1.92 2.22 2.54 2.30 2.30 2.47 2.63 1.91 Dy 8.01 7.48 10.83 12.92 13.31 12.44 13.04 13.62 15.54 11.19 Ho 1.39 1.43 1.97 2.49 2.29 2.22 2.34 2.43 3.02 2.11 Er 3.58 3.50 5.37 6.27 5.77 5.88 6.40 6.42 7.60 5.34 Tm 0.50 0.47 0.76 0.85 0.80 0.83 0.89 0.91 1.06 0.72 Yb 3.15 3.04 4.84 5.60 5.01 5.36 5.81 5.84 6.83 4.72 Lu 0.45 0.44 0.74 0.82 0.73 0.79 0.85 0.85 0.98 0.68 Hf 10.8 7.9 11.8 16.3 10.8 12.8 13.6 14.4 22.0 12.7 Ta 3.6 2.0 3.9 6.5 4.1 4.7 5.1 5.4 7.9 4.9 Pb 7.9 9.9 10.0 15.1 11.8 11.1 13.5 13.7 11.8 9.1 Th 7.9 7.6 9.2 12.4 10.1 11.4 12.5 12.9 16.4 9.7 U 2.6 3.1 3.0 3.8 3.3 2.9 3.4 3.1 2.7 3.8
Oligocene prerift trap rhyolites (marginal graben and plateau)
Sample AF13-92 Kobo-3 Hayk-6 Arab-4 Hayk-3 Kobo-1 Hayk-4 AF13-92R Arab-5 Kobo-8
Age (Ma) 29 28.7 30.8 29 28.5 29 29.5 29.00 29 29 Lat. 11.7850 12.1739 11.3166 11.3507 11.3527 12.2037 11.3521 11.7850 11.3255 12.1351 Long. 39.9541 39.6379 39.7331 39.7899 39.7907 39.7300 39.7907 39.9541 39.7506 39.6854 SiO2 58.41 68.98 69.41 70.42 71.50 72.01 72.32 73.53 73.94 74.30 TiO2 2.01 0.65 0.61 0.71 0.63 0.63 0.54 0.14 0.50 0.49 Al2O3 14.88 14.08 11.75 13.67 13.69 11.60 12.76 11.43 12.84 9.44 Fe2O3 8.64 3.23 3.29 3.40 3.11 4.78 3.38 1.99 1.80 5.32 MnO 0.10 0.17 0.10 0.23 0.07 0.24 0.15 0.02 0.04 0.21 MgO 1.06 0.27 0.33 0.20 0.19 0.26 0.14 0.04 LD 0.21 CaO 4.08 0.28 1.73 0.19 0.18 0.27 0.13 0.31 0.06 0.30 Na2O 4.30 5.74 4.32 4.92 3.53 4.64 1.84 2.22 4.59 3.49 K2O 2.47 4.82 4.44 4.34 4.68 4.65 4.67 6.14 4.45 4.56 P2O5 0.62 0.07 0.13 0.08 0.06 0.09 LD LD LD LD Total 96.57 98.30 96.09 98.15 97.63 99.15 95.92 95.81 98.22 98.31 LOI 2.55 0.74 2.53 1.97 3.22 1.65 3.79 3.36 0.83 1.33 Be 2.0 8.1 6.3 6.6 7.9 6.7 6.2 5.3 6.5 11.4 V 151 12.4 15.9 18.5 17.0 18.2 16.7 1.7 8.6 12.9
Table 3 (continued)
Oligocene prerift trap rhyolites (marginal graben and plateau)
Sample AF13-92 Kobo-3 Hayk-6 Arab-4 Hayk-3 Kobo-1 Hayk-4 AF13-92R Arab-5 Kobo-8
Age (Ma) 29 28.7 30.8 29 28.5 29 29.5 29.00 29 29 Lat. 11.7850 12.1739 11.3166 11.3507 11.3527 12.2037 11.3521 11.7850 11.3255 12.1351 Long. 39.9541 39.6379 39.7331 39.7899 39.7907 39.7300 39.7907 39.9541 39.7506 39.6854 Zn 102 160 170 168 129 203 143 116 82 273 Ga 19.4 36.4 32.6 32.1 36.9 36.7 32.5 27.6 31.8 33.3 Ge 1.4 2.6 2.6 2.7 3.1 2.5 3.1 1.8 2.6 3.3 Rb 46 104 113 97 110 96 100 211 97 161 Sr 888 14 54 150 26 34 20 5.3 45.8 10.4 Y 34.9 63.2 71.8 65.8 88.5 55.0 94.8 100.4 61.6 131.5 Zr 451 936 824 715 975 765 967 424 759 1237 Nb 44.0 108.5 95.6 83.0 108.2 84.0 125.0 29.7 75.0 150.4 Sn 2.8 9.0 9.4 6.9 11.2 6.7 11.6 10.8 7.7 16.9 Cs 0.5 1.3 0.9 1.1 0.9 0.6 0.4 3.9 0.5 1.1 Ba 856 267 482 1043 324 668 402 19 792 200 La 53.19 98.33 101.20 96.42 95.78 101.30 85.23 68.98 91.87 92.57 Ce 119 216 222 186 217 203 202 143 190 267 Pr 15.58 25.37 26.49 24.78 26.50 24.49 25.51 17.46 23.62 28.40 Nd 63.85 95.62 101.50 98.88 101.80 91.87 97.00 68.04 89.27 111.60 Sm 12.64 17.56 20.17 18.66 21.03 17.51 21.09 15.61 17.05 26.60 Eu 3.66 3.41 4.45 5.25 4.52 4.75 4.59 0.28 3.78 6.59 Gd 9.91 13.71 16.31 15.11 17.88 13.80 18.09 15.04 13.27 25.15 Tb 1.38 2.13 2.56 2.27 2.90 2.13 2.99 2.57 2.08 4.09 Dy 7.17 11.97 14.29 12.44 16.99 11.49 17.58 17.02 11.95 23.71 Ho 1.26 2.20 2.58 2.28 3.12 2.04 3.30 3.73 2.19 4.54 Er 3.24 6.16 7.00 6.02 8.60 5.34 9.23 10.35 6.31 12.52 Tm 0.44 0.89 0.99 0.87 1.27 0.72 1.32 1.53 0.94 1.76 Yb 2.76 5.83 6.47 5.54 8.15 4.54 8.62 10.52 6.37 11.31 Lu 0.40 0.86 0.96 0.81 1.21 0.67 1.29 1.52 0.94 1.68 Hf 9.8 23.7 20.5 16.0 24.9 15.2 24.5 13.9 17.5 32.3 Ta 3.3 8.7 7.6 6.4 9.0 6.5 9.3 2.3 5.9 11.3 Pb 5.7 17.8 18.2 15.6 18.6 11.8 21.2 25.3 15.8 26.9 Th 5.9 19.9 18.7 15.3 22.4 12.3 22.2 18.4 15.0 29.8 U 1.8 6.0 5.7 4.3 6.0 2.5 6.8 5.8 4.4 6.6
Oligocene prerift trap rhyolites
Sample Hayk-7 AF12-04 Hayk-1 AF12-10 Hayk-2 Hayk-5
Age (Ma) 29.3 29.00 29 29.70 29.9 29 Lat. 11.3077 12.5125 11.3747 12.1236 11.3580 11.3505 Long. 39.7123 39.9705 39.6471 40.3736 39.7867 39.7850 SiO2 74.35 74.46 74.70 75.29 80.55 81.70 TiO2 0.55 0.33 0.48 0.41 0.47 0.48 Al2O3 11.11 12.56 11.64 11.66 8.07 7.91 Fe2O3 2.77 2.62 2.91 2.53 2.26 2.57 MnO 0.05 0.11 0.12 0.05 0.08 0.09 MgO 0.08 0.19 0.18 0.11 0.04 0.08 CaO 0.32 0.24 0.18 0.35 0.44 0.24 Na2O 3.87 4.19 4.60 4.10 2.53 2.52 K2O 4.64 4.29 4.60 4.74 3.41 3.23 P2O5 0.15 LD 0.07 0.05 0.16 0.16 Total 97.88 99.00 99.48 99.29 98.02 98.97 LOI 1.49 1.21 0.64 0.93 1.34 1.33 Be 6.3 4.7 7.0 3.9 4.1 4.5 V 27.0 4.1 9.8 8.8 8.5 9.6 Zn 120 140 168 124 82 81 Ga 28.9 30.6 31.2 30.5 20.4 20.5 Ge 2.0 1.7 3.0 2.1 3.5 3.0 Rb 105 108 116 118 62 62 Sr 38 68 54 15 42 44
traps or Dessie formations. During the Pliocene, a second pulse offlood basalts with some acidic eruptives occurred at ~4 Ma, with a major emission around 2 Ma termed as Stratoïde formation (Varet, 1975). The Stratoïde formation is covered by the Gulf basalts extruded between approximately 1.1 and 0.6 Ma along with some silicic centers (Kidane et al., 2003). Present-day magmatism is restricted along the rift axis (Medynski et al., 2013, 2015, 2016) and manifested as dyke injection in the crust with few eruptions (Wright et al., 2006).
Rifting is thought to begin in southern Red Sea between 26 and 20 Ma (Baker et al., 1996; Ukstins et al., 2002), in Afar after 29 Ma (Ukstins et al., 2002; Wolfenden et al., 2005), around 34 Ma in the whole Gulf of Aden (Leroy et al., 2012; Pik et al., 2013, and references therein), and at approximately 18–20 Ma in the Main Ethiopian Rift (Pik et al., 2008; Woldegabriel et al., 1990).
The thickness of the crust beneath Ethiopia is well constrained by receiver function studies (Dugda et al., 2005; Hammond et al., 2011; Reed et al., 2014) and varies from 40 to 45 km underneath the western pla-teau to ~35 km under the southeastern plapla-teau. The crust in the Afar Depression thins from 25 km in Central Afar to ~16 km in the North (Northern Afar, Erta Ale). The receiver function studies further indicate the presence of significant amounts of melt throughout a large part of the crust. In Central Afar, a mag-matic wide rift (including the present-day marginal graben) was most likely active after the traps emplace-ment during an early rifting stage. At the end of the Miocene, the rifting localized at depth along a midcrustal detachment, which subsequently controlled the Stratoïde emplacement (Stab et al., 2016). The divergence then localized in magmatic segments (Ebinger & Casey, 2001; Hayward & Ebinger, 1996; Stab et al., 2016).
Table 3 (continued)
Oligocene prerift trap rhyolites
Sample Hayk-7 AF12-04 Hayk-1 AF12-10 Hayk-2 Hayk-5
Age (Ma) 29.3 29.00 29 29.70 29.9 29 Lat. 11.3077 12.5125 11.3747 12.1236 11.3580 11.3505 Long. 39.7123 39.9705 39.6471 40.3736 39.7867 39.7850 Y 68.4 75.8 91.8 67.2 44.7 48.0 Zr 774 609 862 957 519 555 Nb 85 83 100 87 53 54 Sn 8.1 7.7 7.6 7.9 4.5 5.1 Cs 0.7 1.7 1.2 0.3 0.3 0.3 Ba 404 715 384 278 540 486 La 87.15 82.45 84.64 117.60 63.58 70.56 Ce 189 207 183 246 134 138 Pr 23.22 22.46 23.57 28.09 16.31 17.87 Nd 89 87 92 104 63 69 Sm 18.56 18.03 19.42 19.66 12.26 13.14 Eu 4.09 3.30 4.41 3.58 3.03 3.22 Gd 15.35 15.10 17.14 15.45 9.88 10.73 Tb 2.41 2.41 2.73 2.34 1.53 1.63 Dy 13.46 14.98 16.24 13.74 8.56 9.15 Ho 2.47 3.02 3.07 2.64 1.55 1.67 Er 6.75 8.04 8.55 6.72 4.24 4.56 Tm 0.96 1.17 1.28 0.94 0.61 0.66 Yb 6.26 7.86 8.21 6.22 3.97 4.18 Lu 0.94 1.16 1.23 0.92 0.60 0.64 Hf 19.4 16.0 21.9 21.8 11.7 12.4 Ta 6.9 6.5 8.0 6.5 4.0 4.2 Pb 14.4 14.1 15.0 18.0 9.4 8.1 Th 17.2 13.6 19.7 15.7 10.5 11.3 U 5.8 4.0 7.0 1.7 4.0 3.9
Note. Samples are arranged with increasing order of SiO2contents within each suite. LD, below detection limit; LOI, loss on ignition. Total iron as Fe2O3. Major elements were determined by inductively coupled plasma atomic emission spectroscopy while trace elements by inductively coupled plasma-mass spectrometry at CRPG, Nancy (France).
3. Analytical Procedures
The Sr-Nd-Pb isotope separations were done using the same aliquot of the sample. Between 100 and 200 mg offine-grained powder (par-ticle size lower than 80μm) were digested into 15-ml teflon beakers using a mixture of concentrated ultrapure acid (HNO3 and HF). The mixture was heated at 115 °C for 24–48 hr before adding concen-trated ultrapure HCl and heated till complete digestion (at least 24 hr). Before further purification each sample was splitted into two parts for Pb separation from one hand and for Sr-Nd separation on a second hand.
Lead was separated from the matrix using HBr-HCl and AG1X8 (anionic chromatographic) resin according to a similar method previously pub-lished by Manhès et al. (1980). The samples dissolved in 1 ml 0.8 M HBr were loaded onto the resin, the matrix were washed with 2 ml of 0.8 M HBr, and then the Pb was recovered from the resin using 2 ml of 6 M HCl. Once dried the samples were dissolved in 0.3 M HNO3
and ready for measurements. Isotopic analyses were done using a MC-ICPMS Neptune+ (Thermo Scientific). Mass bias was corrected using Tl (NIST 997) and Pb (NIST 981) international standard and values pre-viously published by Thirlwall (2002). More details are available else-where (White et al., 2000).
To separate Sr and Nd from the matrix, the digested samples were diluted using 2 ml of 2M HNO3 and
done according to the analytical protocol published by Pin and Zalduegui (1997) using Sr Spec and TRU Spec resin combination. To further separate Nd from Sm and other REE (rare earth elements), an additional stage of purification was done using Ln Spec resin as suggested previously by Pin and Zalduegui (1997).
SiO2 (wt.%) Na 2 O + K 2 O (wt.%) 0 4 8 12 16 50 55 60 65 70 75 80 Rhyolite Dacite Andesite Trachyte Trachy-andesite Basaltic trachyandesite Quaternary rhyolites Late Miocene-Pliocene rhyolites Early Miocene rhyolites Oligocene trap rhyolites
Figure 2. Total alkali-silica classification diagram (TAS, LeBas et al., 1986) of the volcanic rocks from Western Afar marginal graben, indicating more abundant rhyolites. Alkaline-subalkaline dividing boundary (dashed line) is from Irvine and Baragar (1971).
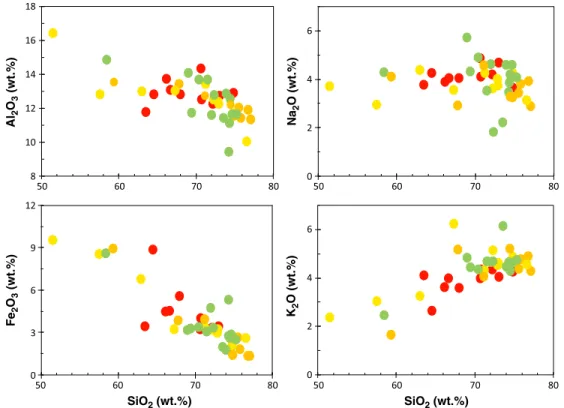
Figure 3. Harker variation diagrams for marginal rhyolites from Western Afar, showing fractionation of Fe- and Al-bearing minerals. Symbols as Figure 2.
Strontium isotopes ratios were determined using a TIMS (Triton+, Thermo Scientific). Samples were loaded on Refilament, and five faraday cups are used in order to monitor Rb in the same time as Sr. Internal normalization using a86Sr/88Sr ratio of 0.1194 and exponential law are used to correct for instrumental mass bias. Measurements of Nd isotope ratios were done using MC-ICPMS (see above). Instrumental
Table 4 Sr, Nd, and Pb Iso topic Comp ositions of Rhy olites From Western Afar Segm ent Sam ple Age (Ma) 87 Sr/ 86 Sr 87 Sr / 86 SrI 143 Nd/ 144 Nd 143 Nd/ 144 Nd I 206 Pb / 204 Pb Err (2s) 206 Pb/ 204 Pb I 207 Pb/ 204 Pb Err. (2 s) 207 Pb/ 204 Pb I 208 Pb/ 204 Pb Err . (2 s) 208 Pb/ 204 Pb I Q uaterna ry Afa r rhyolites AF13-30 0.52 0.704471 ± 1 2 0.704449 0.512795 ± 0 3 0.512795 18.307 0.001 1 8.307 15 .567 0 .001 15.567 38.359 0.005 3 8.359 AF13-25 0.10 0.703818 ± 1 0 0.703816 0.512868 ± 0 3 0.512868 18.542 0.001 1 8.542 15 .565 0 .001 15.565 38.584 0.005 3 8.584 AF15-17 2.50 0.703414 ± 0 9 0.703386 0.512931 ± 0 4 0.512929 18.556 0.001 1 8.556 15 .562 0 .001 15.562 38.602 0.005 3 8.602 AF15-19 2.50 0.703439 ± 0 6 0.703392 0.512956 ± 0 2 0.512954 18.583 0.001 1 8.583 15 .536 0 .001 15.536 38.623 0.005 3 8.623 AF15-11 1.32 0.703985 ± 1 1 0.703944 0.512868 ± 0 3 0.512867 18.574 0.001 1 8.574 15 .574 0 .001 15.574 38.774 0.005 3 8.774 AF13-340 1.30 0.704394 ± 1 9 0.704328 0.512844 ± 0 3 0.512843 18.513 0.001 1 8.513 15 .570 0 .001 15.570 38.706 0.005 3 8.706 AF15-10 0.56 0.703532 ± 0 9 0.703517 0.512936 ± 0 3 0.512936 18.733 0.001 1 8.733 15 .560 0 .001 15.560 38.778 0.005 3 8.778 Lat e Mioc ene -Pliocen e m a rgine sy nrift rhyolites (Bokeksa-Arab ati section) AF12-15 4.00 0.706481 ± 1 5 0.705618 0.512741 ± 0 3 0.512738 18.511 0.001 1 8.511 15 .562 0 .001 15.562 38.207 0.005 3 8.207 Ara bati-1 7.5 0.710727 ± 2 8 0.706588 0.512821 0.512807 18.431 0.0018 1 8.416 15 .555 0 .0020 15.554 38.125 0.007 3 8.095 Ara bati-2 7.5 0.705461 ± 1 0 0.705068 0.512690 0.512684 18.358 0.0022 1 8.342 15 .552 0 .0020 15.551 38.029 0.007 3 8.013 G ainal-1 6.3 0.716155 ± 1 3 0.705526 0.512763 0.512757 18.391 0.0017 1 8.378 15 .550 0 .0017 15.549 37.920 0.004 3 7.910 Ear ly M iocene margi n synrift rhyolites (m arginal gra ben dykes and Afa r Fint o sect ion; Bok sa-Araba ti sect ion) H ara-1 21.0 0.708419 ± 2 6 0.705741 0.512854 ± 0 8 0.512839 18.858 0.0021 1 8.810 15 .586 0 .002 15.584 38.546 0.005 3 8.481 H ara-2 22.6 0.705238 ± 1 3 0.704672 0.512895 ± 2 5 0.512879 18.851 0.0017 1 8.788 15 .587 0 .002 15.584 38.540 0.004 3 8.476 H ara-5 17.4 0.704340 ± 1 0 0.704301 0.512829 ± 1 5 0.512816 18.551 0.0022 1 8.494 15 .570 0 .002 15.567 38.297 0.005 3 8.240 H ara-6 17.4 0.705742 ± 2 4 0.704959 0.512678 ± 7 8 0.512666 18.872 0.0012 1 8.827 15 .585 0 .001 15.582 38.532 0.003 3 8.473 AF12-04 29 0.706311 ± 0 8 0.704412 0.512861 ± 0 4 0.512838 18.858 0.001 1 8.791 15 .586 0 .001 15.583 38.539 0.005 3 8.477 O ligocene prer ift trap rhyolites (mar ginal gra ben and plate au) H ayk-1 29 0.707297 ± 2 2 0.704734 0.512864 ± 2 5 0.512840 18.973 0.002 1 8.839 15 .596 0 .002 15.590 38.613 0.005 3 8.488 H ayk-3 28.5 0.709945 ± 1 6 0.705042 0.512876 ± 0 3 0.512852 19.150 0.002 1 9.058 15 .594 0 .002 15.590 38.605 0.004 3 8.492 Ara bati-4 29 0.705595 ± 1 5 0.704824 0.512821 ± 0 3 0.512799 18.728 0.002 1 8.649 15 .593 0 .001 15.590 38.620 0.004 3 8.527 H ayk-5 29 0.706808 ± 1 3 0.705116 0.512863 ± 0 4 0.512841 19.251 0.002 1 9.110 15 .595 0 .002 15.589 38.550 0.006 3 8.416 Kob o-1 29 0.708380 ± 1 7 0.705011 0.512843 ± 2 0 0.512821 19.064 0.001 1 9.001 15 .585 0 .001 15.582 38.624 0.003 3 8.525 Kob o-3 28.7 0.714978 ± 2 6 0.705849 0.512910 ± 0 4 0.512889 19.114 0.002 1 9.017 15 .584 0 .001 15.580 38.600 0.005 3 8.495 Kob o-8 29 0.723809 ± 1 7 0.705334 0.512898 ± 0 5 0.512871 19.237 0.001 1 9.166 15 .595 0 .001 15.592 38.574 0.001 3 8.468 Note . Itali cs de fi ne init ial values.
mass bias was corrected using exponential law and internal normaliza-tion using 146Nd/144Nd of 0.7290 according to the previous methodol-ogy published by Luais et al. (1997). The admitted reference solution JNdi-1 (Tanaka et al., 2000) was used to check the methodology. In addi-tion, the quality (accuracy and precision) of the process for Pb, Sr, and Nd was done by repeated dissolution of the international reference material BCR-1 (206Pb/204Pb = 18.8193 ± 0.0025,
87
Sr/86Sr = 0.705025 ± 0.000072, and 143Nd/144Nd = 0.512566 ± 0.000093 [2SD, n = 5]), and the blanks for the three systems were found negligible.
For zircon Helium dating, the samples were prepared at Service d’Analyse des Roches et des Minéraux (CRPG, Nancy, France) following the method described in Pik et al. (2003) and Tibari et al. (2016). Rocks were crushed and sieved, and heavy minerals were separated by densimetry. Aliquots of three tofive zircon grains were prepared, and measurements of4He, U, Th, and Sm concentrations were performed on the same aliquots. Errors on age measurements are given by reproducibility on standards (Tibari et al., 2016) that is 6% on a 1-sigma interval of confidence. This level of precision is in agreement with those of the literature (see review in Tibari et al., 2016). The uncertainty is higher than for Ar-Ar datings, but it is still relevant to identify Cenozoic formations. On the other hand, the advantage of the U-Th-Sm/He method is that zircons are typically found in acid rocks, such as rhyolites. It is thus an ideal tool for mapping zones of large abundance of acid magmatism.
4. Results
4.1. U-Th-Sm/He Thermochronometry
U-Th-Sm/He ages of the marginal graben rhyolites are presented in Table 2. The trap rhyolites collected in Hayk and Kobo areas (Figure 1 and Table 1) situated within the present-day marginal graben yield U-Th-Sm/He ages ranging from 28.5 ± 1.7 Ma to 30.8 ± 1.8 Ma. These ages are in a close agree-ment with the previous U-Th-Sm/He ages of 29.7–30.6 Ma for strongly tilted rhyolites exposed in Sullu Adu area (Stab et al., 2016) and Rb-Sr iso-chron ages of 30.17 Ma for plateau rhyolites (Ayalew & Yirgu, 2003). U-Th-Sm/He thermochronometry gives two separate ages for Miocene felsic volcanism, one older lying between 17.4 ± 1.0 Ma and 23.45 ± 1.45 Ma and the other one younger ranging from 6.25 ± 0.35 Ma to 7.55 ± 0.50 Ma. There is no intermediate age between 7.6 and 17.4 Ma, indicating the episodic nature of the Miocene volcanism as it has been previously described elsewhere (Stab et al., 2016). Based onfield loca-tion and correlaloca-tion (Figure 1 and Table 1), the rhyolites emplaced near by the active magmatic segments have ages ranging from 0.1 to 4 Ma (Ferguson et al., 2013; Field et al., 2013; Lahitte et al., 2003; Stab et al., 2016). The ages obtained from this study allow us to subdivide the marginal rhyolites into four units: Oligocene trap rhyolites (28.5–30.8 Ma, ~30 Ma on average), early Miocene rhyolites (17.4–23.5 Ma, ~20 Ma on average), late Miocene-Pliocene rhyolites (between 8 and 4 Ma), and Quaternary rhyolites (2.5–0.1 Ma). We use this subdivision in the forthcoming discussion.
4.2. Major Elements
Bulk geochemical analyses of volcanic rocks from the western marginal graben, Ethiopian rift, are reported in Table 3. In the total alkalis-silica classification diagram (LeBas et al., 1986; Figure 2), the majority of the samples are rhyolite with minor trachytes. Most of the samples display a subalkaline affinity according to the alkaline/subalkaline delimitation of Irvine and Baragar (1971; Figure 2). Very few samples fall in thefields of basaltic trachyandesite (Hara 5), trachyandesite (AF13-73 and AF13-92), andesite (AF13-74), and dacite (AF15–17). For the sake of simplicity, we refer all the felsic samples hereafter to as rhyolite, which is the focus of this study. Harker variation diagrams are presented in Figure 3. With increasing SiO2 content,
Figure 5. Variations of Sr-Nd-Pb isotopes for marginal rhyolites from Western Afar. Also shown for comparison arefields of rhyolites from Yemen (Baker et al., 2000), Djibouti (Deniel et al., 1994), and Ethiopian rift axis, both Afar (Hutchison et al., 2018) and MER (Giordano et al., 2014; Peccerillo et al., 2003).
Fe2O3, TiO2, and Al2O3display negative correlation implying fractionation
of Fe-, Ti-, and Al-bearing minerals such as olivine and clinopyroxene, Fe-Ti oxides, and plagioclase, respectively. Na2O does not show a marked trend. The content of K2O rises steadily, indicating its incompatible nature.
4.3. Trace Elements
The variations of trace elements against SiO2are shown in Figure 4. The concentrations of compatible trace elements such as V (not shown) and Sr steadily decrease with increasing SiO2content, reflecting fractionation
of Fe-Ti oxides and plagioclase, respectively. Ba broadly shows negative correlation, though there are some scatterings. The concentrations of incompatible elements like Rb, Pb, and Th increase continuously through-out the suite. Other incompatible trace elements such as La, Nb, and Zr exhibit inflected trends at higher SiO2content in excess of 71 wt.%. The
most evolved rhyolites with lower La, Nb, and Zr concentrations are char-acterized by higher contents of Rb and Th, simply related to the highly differentiated nature of these samples. The late Miocene rhyolites document depletion in light-REE (LREE; e.g., La) and high-field strength element (HFSE; e.g., Nb), providing evidence for crustal involvement in the genesis of these rhyolites or alternatively derivation from a depleted source.
4.4. Sr, Nd, and Pb Isotopes
Sr, Nd, and Pb isotopic compositions of volcanic rocks from the western portion of the Afar marginal graben are reported in Table 4. Initial Sr isotopic ratios show wide variation ranging from 0.7034 to 0.7066, with the highest values found in the late Miocene-Pliocene rhyolites. Initial 143Nd/144Nd ratios exhibit significant variation between 0.51267 and 0.51295, with the lowest values being recorded in the late Miocene-Pliocene rhyolites. Initial Pb isotopic ratios show considerable variations (206Pb/204Pb; 18.31–19.17, 207Pb/204Pb; 15.55–15.59,
208
Pb/204Pb; 37.91–38.53), with the lowest ratios observed in the late Miocene- Pliocene rhyolites.
The Sr, Nd, and Pb isotopic compositions of the marginal rhyolites along with referencefields for rhyolites from the surrounding region are illu-strated in Figure 5. In Sr-Nd isotopic space, the studied samples, except the Quaternary rhyolites, overlap significantly with the ranges of the Oligocene Yemen rhyolites (Baker et al., 2000) and young rift axis rhyolites (Giordano et al., 2014; Peccerillo et al., 2003), though they extend toward higher and lower143Nd/144Nd values. In contrast, the Quaternary rhyolites as well as young rhyolites in the Manda Hararo rift (Hutchison et al., 2018) exhibit mantle-like87Sr/86Sr and143Nd/144Nd values.87Sr/86Sr and143Nd/144Nd ratios of early Miocene Djibouti rhyolites (Deniel et al., 1994) are distinct from those of the marginal rhyolites, implying that they contain a large crustal component.
In Pb-Pb isotopic space, the marginal rhyolites show two trends; one defined by Oligocene trap rhyolites forming a subhorizontal array at nearly constant208Pb/204Pb of 38.4, respectively, and the other one by Miocene and Pliocene rhyolites of all ages displaying positive correlation. Modern rhyolites from Dabbahu volcano in the Manda Hararo rift segment (Hutchison et al., 2018) overlap with the range of the Quaternary rhyolites, but they cluster at the high206Pb/204Pb end of the trend. Oligocene Yemen rhyolites share the same Pb-Pb isotopic range as the Oligocene trap rhyolites (Baker et al., 2000). Young rhyolites from the Ethiopian rift axis display distinct trend displaced toward the left of the marginal rhyolites (Giordano et al., 2014; Peccerillo et al., 2003). Pb-Pb isotopic values of early Miocene Djibouti rhyolites do not overlap with the range of the marginal rhyolites (Deniel et al., 1994), clearly indicating a strong contribution from upper crust in their genesis.
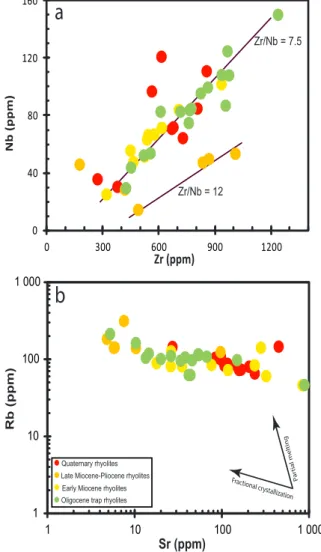
Figure 6. Bivariate plot of trace elements for marginal rhyolites from Western Afar. (a) Nb vs. Zr defining linear correlations that are an
indicative of derivation from a broadly common source. (b) A log-log plot of Rb vs. Sr, displaying a wide variation in Sr concentration interpreted as crystallization-controlled origin for the rhyolites.
5. Discussion
5.1. Alteration
Although samples were collected for their freshness, we first track any chemical variation that may have been triggered by alteration. Macroscopically, most samples appear to be unaltered, but few samples have high LOI (loss on ignition) measurements occasionally reaching up to 4.3 wt.%, which may cause deuteric mobilization of fluid mobile elements. Furthermore, three samples show distinctly high contents of LOI (AF13-335: 4.8 wt.%, AF13-73: 5;5 wt.%, and AF13–337: 8.2 wt.%) rela-tive to the rest of the series. There is a lack of correlation between LOI and any other major and trace elements, except Na2O (not shown),
indicat-ing that deuteric alteration has not mobilized other elements and was probably insignificant.
5.2. Petrogenesis of the Rhyolites
The petrogenesis of the rhyolitic end member of a bimodal basalt-rhyolite suite is subject to a continuing debate. In some instances, chemical and isotopic data support an origin by low-pressure fractional crystallization of basaltic magma (e.g., Ayalew et al., 2002; Baker et al., 2000). In others, the lack of intermediate compositions appears to argue in favor of partial melting of crustal rocks instead (e.g., Davies & Macdonald, 1987; Macdonald et al., 1987). Despite this, systematic chemical and isotopic studies of the rhyolites are necessary to resolve the various arguments. A fundamental issue in this study is to determine whether all the samples of the suite are linked to a common source by the same petrogenetic process or not. Thefirst clue comes from the bivariate plots of incompatible trace element pairs (e.g., Nb vs. Zr; Figure 6a), whose bulk partition coefficients are very similar and will not vary both in the course of fractional crystalliza-tion and partial melting. It is evident that most of the samples define a strong linear trend regardless of their age, despite some dispersion. This supports the view that the marginal rhyolites were derived from a common source. Thus, the ratio of Zr/Nb ~7.5 approximates that in the source. Constancy of Zr/Nb ratios throughout the marginal rhyolites provides strong evidence that fractional crystallization has been the dominant pro-cess in their evolution as it is the only propro-cess that maintains unchanged ratios of incompatible trace elements in a suite of samples (e.g., Barberi et al., 1975). The only exceptions to this are the late Miocene rhyolites, which display a distinct linear array (with high Zr/Nb ~12), interpreted to indicate derivation from a depleted plume head source with higher Zr/Nb, as proposed for the associated Miocene basalts in Western Afar (between the marginal graben and Central Afar, Ferguson et al., 2010, 2013). In addition, a log-log plot of highly incompatible trace element (e.g., Rb) against highly compatible trace element (e.g., Sr) in silicic melts is a viable tool to identify the likely physical processes, which account for the observed data variation (e.g., Halliday et al., 1991). On a Rb-Sr plot (Figure 6b), large changes in Sr concentrations are accompanied by limited changes in Rb abundances. Such trend is thought to reflect that the erupted magmas are related by fractional crystallization process. This model is more likely to produce the rhyolites in a short time span and mini-mizes crustal contamination relative to partial melting model. A similar interpretation is reached in the Ethiopian rift (both young Afar and MER volcanoes) where silicic magmas are thought to be generated through
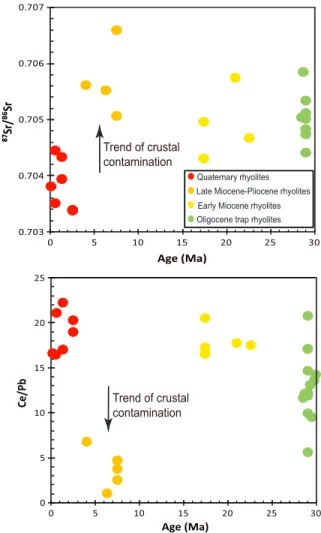
Figure 7. Variations of index of contamination, (a)87Sr/86Sr and (b) Ce/Pb, as a function of index of differentiation (SiO2) and (c) Ce/Pb against87Sr/86Sr for
marginal rhyolites from western Afar, showing good correlation accounted for in terms of crustal contamination. Also shown the ranges (shadedfield) of the coeval basalts (Barrat et al., 1998; Deniel et al., 1994; Hart et al., 1989; Hutchison et al., 2018; Natali et al., 2016; Pik et al., 1999; Rooney et al., 2013; Vidal et al., 1991).
protracted fractional crystallization processes of basalts (Field et al., 2013; Hutchison et al., 2016, 2018). Furthermore, field evidence indicates that the marginal rhyolites are often underlain by basalts. Such intimate stratigraphic relation between the basalts and rhyolites in a given volcanicfield has been taken as a strong field evidence for crystallization-controlled origin for the rhyolites (e.g., Garland et al., 1995; Mahoney et al., 2008).
The derivation of the marginal rhyolites from parent basalt magmas through low-pressure crystal fractiona-tion demands the presence at depth of extensive piles of complementary cumulates. As outlined before, the major element variations suggest that the fractionating phase assemblage controlling element partitioning consisted of olivine, clinopyroxene, plagioclase, and Fe-Ti oxides. This indicates that the cumulate rock has a bulk gabbroic composition, which contributes to the creation of new juvenile crust. We suggest that the volume of this cumulate can be several times greater than that of the erupted rhyolites, since>90% of crys-tallization is needed to reproduce the most evolved rhyolites. Ourfindings are supported by the existence of high P wave velocity (6.9–7.5 km/s; Bastow & Keir, 2011; Hammond et al., 2011) and positive Bouguer anomaly (δ = 3,000 g/cm3; Tessema & Antoine, 2004) within the upper crust beneath Afar, inferred to be high-density mafic cumulates.
One of the objections to the fractional crystallization model is the scarcity of rocks of intermediate compo-sition. Additionally, the origin of these rhyolites is paradoxical because their presumed immediate parental melt (trachyte), required to be even more voluminous, is generally sparse as an erupted magma type (Figure 2). Nevertheless, the Daly gap may either represent specific magma heat and water contents that triggers nonlinear crystal fractionation with cooling, inducing larger amount of primitive and evolved com-ponents compared to intermediate ones (Melekhova et al., 2013), or simply reflect the onset of significant amounts of Fe-Ti oxides fractionation, which can cause a rapid increase in SiO2 content of the residual magma (Peccerillo et al., 1995, 2003). Indeed, many of these rhyolites contain microphenocrysts of Fe-Ti oxides, favoring fractionation of Fe-Ti oxides as a viable mechanism for the existence of SiO2 gap in the
volcanic records. Thus, the preservation of such a gap appears to be related to melt expulsion from a crystal mush as already first proposed by Marsh (2002) and then later supported by Bachmann and Bergantz (2004, 2008). This model predicts that only a small fraction (≤10 vol.%) of interstitial liquid is necessary to form the largest erupted rhyolites.
Two compelling evidences exist in the rock records, which favor for melt extraction from crystal mushes: (1) The crystal-poor Hayk rhyolite ignimbrite erupted concurrently (approximately 30 Ma) with crystal-rich Kobo porphyry rhyolite. (2) The Kobo and Hayk units exhibit similar geochemical affinity (i.e., similar incompatible trace element and isotopic ratios; Figures 5 and 6). These arguments suggest that the two units tapped a common, or similar magma chamber though they are about 100 km far apart from each other. The fact that the occurrences of coeval crystal-poor and crystal-rich magmas (chronological proximity and geochemical affinity) within the volcanic record of the marginal graben provide strong support to the idea that the silicic melts squeezed out from the crystal mushes by compaction. Hence, the crystal-poor Hayk ignimbrite is interpreted as the evolved cap of the crystal-rich Kobo rhyolite, now exposed on the surface most likely by erosion.
Table 5
Isotopic Compositions and Concentrations of Sr, Nd, and Pb in Crustal and Basaltic Compositions
Crust Mantle
C3 C6 C6* Enriched Afar mantle plume
87 Sr/86Sr 0.70863 0.72851 0.71 0.70375 Sr (ppm) 678 175 175 300 143 Nd/144Nd 0.511368 0.512593 0.5129 0.51293 Nd (ppm) 34 23.5 23.5 20 206 Pb/204Pb 17.625 18.85 19.3 18.8 Pb (ppm) 14 21.5 21.5 1.5
Note. C3; reworked craton lower crust (Davidson & Wilson, 1989), C6; differentiated juvenile Arabian-Nubian shield (Teklay et al., 2001), C6*; modified differentiated juvenile Arabian-Nubian shield (Teklay et al., 2001), Enriched Afar man-tle plume (Pik et al., 1999).
5.3. Open System Evolution
The trace element and Sr-Nd-Pb isotope features of the marginal rhyolites provide ample evidence for the involvement of crustal rocks in their gen-esis. It has become apparent that ratios of highly incompatible trace ele-ments (e.g., Ce/Pb) and radiogenic isotopes (e.g.,87Sr/86Sr) may help to track crustal involvement in silicic melts. Plots of87Sr/86Sr (Figure 7a) and Ce/Pb (Figure 7b) versus SiO2depict good correlation, suggesting that
concomitant assimilation-fractional crystallization (AFC) style of crustal contamination has played a role in the genesis and evolution of the mar-ginal rhyolites. Similarly, in a plot of Ce/Pb against Sr isotope ratio (Figure 7c), samples with low Ce/Pb ratio are characterized by high
87Sr/86Sr value, accounted for in terms of crustal contamination. The recent
Afar rhyolites appear to be less contaminated than the rest of the rhyolites from the margin and plateau and share the same isotopic composition (and the same amount of contamination) as the contemporaneous basalts. Sr, Nd, and Pb isotopic compositions are used to assess further the nature and extent of contamination as they distinctly depict thefields of the man-tle and the crust. One point worth mentioning is the lack/absence of Pb isotopic composition on the Arabian-Nubian shield underlying the volca-nic rocks below Ethiopia. This makes the AFC calculations to be less reli-able. Nevertheless, we used the available data from the surrounding region in Sudan (Bailoa et al., 2003; Davidson & Wilson, 1989), Egypt (Küster et al., 2008; Lucassen et al., 2008; Stern & Abdelsalam, 1998), Eritrea (Teklay et al., 2001), and Yemen (Baker et al., 2000), which show a wide range of isotopic compositions for the crust in this area. Owing to the highly variable isotopic compositions of the basement, the composi-tion of the crustal end-member representing the contaminant is poorly constrained.
Trace element and isotope (especially Pb) data place valuable constraints on the approximate environment of crustal contamination (i.e., upper ver-sus lower crust) in the petrogenesis of the studied samples. The most con-taminated samples, those with the highest Sr isotopic composition and the lowest Ce/Pb ratio, are the Oligocene trap and the late Miocene-Pliocene rhyolites. As shown on Figure 5, the Oligocene rhyolites have the highest 206Pb/204Pb, while some Quaternary rhyolites have
206
Pb/204Pb ratio as low as those for the late Miocene-Pliocene rhyolites. The high Pb isotope composition of the Oligocene trap rhyolites seems to indicate contamination by the upper crust, while for the late Miocene-Pliocene rhyolites their low Pb isotope composition indicates a lower crust-dominant fingerprint. On the other hand, the late Miocene-Pliocene samples show relative enrichment in Rb and Th (Figure 4 and Table 4), a distinctive signature of the upper crust. Decoupling of trace ele-ment and Pb isotope systematics in the late Miocene-Pliocene rhyolites can be interpreted in terms of multiple levels of magma interactions within the crust. In such scenario, differentiation might have occurred first at depth (hot wall rock, high r; where r is the ratio of rates of assimilation to crystallization), and then at shallow crustal levels (cold wall rock, low r) with a change in the composition of the assimilated material. Since the difference between low Pb isotopic ratio and high Th content is not observed in the trap rhyolites, only one step model explains the AFC process. AFC modeling (DePaolo, 1981) is attempted using the available Sr-Nd-Pb isotopic data to quantify the extent of contamination in the marginal rhyolites. The mantle and crust end-members considered in the model are reported in Table 5. The contaminants selected to reproduce the different Sr-Nd-Pb isotopic trends of the
Figure 8. (a) Sr-Nd isotopic variations of the studied samples compared with those of the associated basalts (Barrat et al., 1998; Deniel et al., 1994; Hart et al., 1989; Hutchison et al., 2018; Natali et al., 2016; Pik et al., 1999; Rooney et al., 2013; Vidal et al., 1991) and the crust (Bailoa et al., 2003; Baker et al., 2000; Davidson & Wilson, 1989; Küster et al., 2008; Lucassen et al., 2008; Stern & Abdelsalam, 1998; Teklay et al., 2001) from the region. C1, C2, C3, C4, C5, and C6 are true representatives of the upper and lower crust chosen to consider the various trajectories. Although there is a tendency to have little overlap, the Neoproterozoic juvenile Arabian-Nubian shield is considerably characterized by higher143Nd/144Nd ratio than the reworked craton crust. The Neoproterozoic juvenile Arabian-Nubian shield also displays a wide range of Nd isotopic composition, which encompasses the ranges of the basalts and rhyolites, but it possesses marked troughs at Nb-Ta in mantle-normalized multielement variation diagram (e.g., Woldemichael et al., 2010). (b) Zoom in of Figure 8a to show a two-stage AFC model involving small degrees (3–8%, r = 0.6) of crystallization of the more primitive magmas at deep levels, followed by greater degrees (90%, r = 0.15) of fractionation at higher levels. Marks on the AFC curves indicate fraction of residual magma. Bulk distribution coefficient; DSr(0.037–0.976) and DNd(0.158–0.658) are from Rollinson (1993). DAP; depleted Afar mantle plume, EAP; enriched Afar mantle plume, C3; reworked craton lower crust, C6*; modified differentiated juvenile Arabian-Nubian shield upper crust.
rhyolites. In the contrary, only a single starting basalt composition (Enriched Afar Plume composition) considered through 30 Ma of AFC pro-cess. The choice of this starting composition for 30 Ma of AFC modeling is based on the fact that all the noncontaminated basalts, from the Oligocene trap to the recent Afar rift segments, exhibit similar isotopic compositions (e.g., Ferguson et al., 2010, 2013; Hutchison et al., 2018). This suggests that all the associated basalt magmas had the same primary composition before differentiation and contamination over the 30 Ma of magmatism in the area.
The results of AFC modeling are illustrated in Figures 8 and 9. Chemical and isotopic data support an origin by open system evolution at different levels within the crust. In early stages of differentiation, the more primitive mag-mas, generated within the enriched Afar mantle plume, interact with the lower crust (up to 8% crystallization, 5% contamination) at a fairly high rate (r = 0.6). At later stages of fractionation, which produced the rhyolites, the evolved, and contaminated magmas differentiate at higher levels and are contaminated by upper crust (up to 90% crystallization, 14% contamina-tion) probably at a lesser rate (r = 0.15). The initial high-r stage is required in the petrogenesis of these magmas to account for the observed signi fi-cant amount of contamination (up to 5%) acquired during rather limited evolution of the primary magmas in the basaltic field of compositions. Such an early high-r stage of AFC has been demonstrated to be a common feature of initial basalt contamination due to specific thermal constraints (Reiners et al., 1995). The crustal contaminant used in the model for the upper crust is not a real basement sample from the region. Indeed, a lot of the upper crustal end-members considered elsewhere could be compa-tible with such AFC evolution for Sr and Pb isotopes, but the observed trends on Figures 8 and 9 require an isotopic end member with slightly higher Nd isotopic ratio than what has been measured in basement sur-rounding the Ethiopian volcanic province. We then propose such a compo-sition compatible with the surrounding record and the isotopic trends as upper crustal contaminant for these magmas (C6*). Over all, the different Sr-Nd-Pb trajectories of the investigated rhyolites can be satisfactorily explained by assimilation of heterogeneous crust in two distinct and sequential stepsfirst in the lower crust, and later in the upper crust. It is important to note that the amount of contamination is different and higher for all the rhyolites than the basalts, except those from Afar, which appear to remain similarly to the associated basalts, and mostly affected by thefirst step of contamination that occurs within the lower crust (Figures 8b and 9). Moreover, the isotopic trends of the rhyolites appear anchored at the end of those described by the basalts, as it is pro-posed in our two steps AFC model. Such cogenetic evolution of the basalts and rhyolites via AFC processes during differentiation in the lower crust implies that the observed isotopic trends are controlled by two dis-tinct types of end-members, which are the Afar Mantle Plume (as source of primitive melts) and two crustal components (as sources of contamination). This interpretation of the Sr-radiogenic components is opposed to the alternative view that such isotopic trends results from participation of an Enriched Mantle component (EM type) that could originate in the lithospheric mantle (Rooney et al., 2012). The immediate implication of this interpretation is that rhyolitic magmas can be used to discriminate crustal contamination of mantle-derived magmas from enriched lithospheric mantle sources (Furman et al., 2016; Rooney et al., 2012). Thus, for a suite of lavas, rhyolitic magmas may help to identify some of the ambiguous geochemical variations observed within the associated basalts.
5.4. Temporal Evolution of Contamination and Geodynamic Implications
Felsic samples studied herein range in age from ~30 Ma (prerift) to ~0.1 Ma, documenting most of the volcano-tectonic events that occurred successively in the area. Compositional variations of these rocks
Figure 9.87S/86Sr and143N/144Nd plotted against206Pb/204Pb, with model AFC curves of varying r calculated as Figure 8b. Marks on the AFC curves indicate fraction of residual magma. Bulk distribution coefficient; DSr(0.037–
0.976), DNd(0.158–0.658) and DPb(0.003–0.361) are from Rollinson (1993).
with time are shown in Figure 10. Oligocene trap rhyolites (erupted prior to the onset of rifting) are contaminated to some extent, while early Miocene rhyolites (emplaced during incipient rifting) show less evidence for crustal contamination. Late Miocene-Pliocene rhyolites, related to the thinning of the crust, are highly contaminated. In the contrary, Quaternary rhyolites (emplaced as rifting progressed to continental breakup) appear to be uncontaminated.87Sr/86Sr and Ce/Pb values indicate that crustal involve-ment was significant in the late Miocene-Pliocene rhyolites extruded across the rifted zones, as exemplified by relatively high87Sr/86Sr and low Ce/Pb values. It is important to note that these rhyolites are the most differentiated rocks (with SiO2content of 75–77 wt.%) and show the
high-est degree of crustal contamination. Indeed, further differentiation sug-gests longer periods of residence in crustal magma chambers, which could elevate the amount of crustal contamination. Alternatively, the late Miocene-Pliocene rhyolites originated from differentiation of depleted basalts, derived from a depleted source in the Afar plume head (Barrat et al., 2003), which can have enhanced the impact of contamination on trace element and isotopic ratios for equivalent amount of crustal assimi-lation (the contamination degree estimate therefore probably represents a maximum value).
On Figure 10, it is clear that the role of crustal involvement in the genesis of the studied rhyolites appears to be related to the stage of crustal exten-sion. This is particularly the case for the Quaternary rhyolites, emplaced nearby the active magmatic segments during the breakup stage of rifting, which exhibit87Sr/86Sr and Ce/Pb values that are indistinguishable from those of the cogenetic Central Afar segment basalts (Hutchison et al., 2018). This suggests that the second stage of upper crustal contamination, which modifies strongly Sr isotopic composition (Figures 8 and 9), is absent for these magmas, and therefore, that the rhyolites from Afar only suffered the same contamination process as the basalts, that is, thefirst stage in the lower crust. Such a characteristic is compatible with the long-lived ideas and hypotheses (Hammond et al., 2011; Stab et al., 2016) that the Afar crust has been massively intruded by juvenile magmas in the course of rifting (especially after the Stratoïde Fm. emplacement,
Figure 10. Temporal compositional variations of the marginal rhyolites, demonstrating that the extents of contamination tend to increase as rifting progressed.
Figure 11. Magma plumbing system evolution in the course of margin extension. Equilibrated cross-sections are based on Stab et al. (2016). Drawing has been simplified to allow better representation of the magmatic plumbing system during the two selected periods of Miocene and 4–0 Ma recent volcanism. The represented unit for Oligocene and Miocene volcanism exhibit internal architecture with differential sea-ward tilted volcanic levels, up to 60° for the lower units of the lava pile.
Figure 11) and is now at a transitional stage between continental rifting and oceanic accretion. Indeed, differ-entiation of magmas in such a heavily intruded crust can still be accompanied by assimilation of country rock, yet its mostly juvenile nature will prevent significant modifications of trace elements and radiogenic isotopes signatures. On the other hand, thefirst stage of contamination at lower crustal levels is still identified in the geochemical data, which testifies that some lower crust may still be present around the associated plumbing system. Alternatively, as proposed by Barrat et al. (1993, 1998, 2003) for various segments in Afar, the Afar rhyolites contamination may be related to interaction of magmas (rhyolites and possibly basalts) with previously hydrothermally altered juvenile crust. This alternate model suggests the possibility that Afar rift segments may be associated with an entirely juvenile crust. The distinction between those two models (i.e., interaction with lower continental crust versus interaction with hydrothermally altered juvenile crust) cannot be done with the data presented herein and will necessitate further studies.
Following the recent crustal structure proposed for Central Afar and adjacent areas by Stab et al. (2016), we combine all these arguments in a model highlighting two specific stages (Figure 11). During early Miocene, the rifting was wide and associated with discrete volcanic phases (Figure 11). At the end of this stage, the Afar crust experienced a main thinning event leading to the emplacement of the voluminous Stratoïde Fm. (Stab et al., 2016). Since then, the divergence has localized in the present-day magmatic segments (such as Manda Hararo) (Figure 11) where the crustal structure results from (i) important addition of juvenile basic magmas and (ii) preferential removal of the upper crust along the detachment faults that accommodated divergence. Such results and interpretations suggest that the present-day Central Afar is very close to continental breakup, which will be achieved once the continental crust will be entirely replaced by new magmatic crust.
6. Conclusions
Rhyolites from western marginal graben down to the Central Afar range in age from ~30 Ma (prerift stage), ~20 Ma (early synrift), ~8–4 Ma (main thinning event) to ~2.5–0.1 Ma (late synrift), representing the whole volcano-tectonic events that occurred successively. These rhyolites are geochemically similar and are spatially associated with basalts over the entire eruptive period. The compositions of the rhyolites are best explained by protracted differentiation at different levels within the crust. Such evolution involves small degrees (up to 8%, 5% contamination) of crystallization of parental liquids at a fairly high assimilation/crystallization rate in the lower crust (r = 0.6), followed by greater degrees (90%, 14% contami-nation) of fractionation of evolved magmas in the upper crust to produce the rhyolites probably at a lesser rate (r = 0.15). The Quaternary rhyolites, emplaced toward thefinal stage of rifting, record little interactions with the crust with isotopic signatures compatible with contamination limited to thefirst step in the lower crust, or alternatively to interactions with previously hydrothermally altered juvenile crust. This is compatible with the fact that the present-day crust below the active magmatic segments is transitional. This suggests that rifting is almost achieved close to continental breakup, which will be achieved once the continental crust will be entirely replaced by new magmatic crust. Rhyolite magmas emitted over the last 30 Ma display very similar signatures (or contamination degree) for a given period. This implies that the plumbing system and magma interactions with host rocks are mainly governed by the regional tectonic regime, and crust architecture.
References
Annen, C., Blundy, J., & Sparks, R. S. J. (2006). The genesis of intermediate and silicic magmas in deep crustal hot zones. Journal of Petrology,
47, 505–539.
Annen, C., & Sparks, R. S. J. (2002). Effects of repetitive emplacement of basaltic intrusions on thermal evolution and melt generation in the crust, Earth Planet. Science Letters, 203, 937–955.
Ayalew, D., Barbey, P., Marty, B., Reisberg, L., Yirgu, G., & Pik, R. (2002). Source, genesis, and timing of giant ignimbrite deposits associated with
Ethiopian continentalflood basalts. Geochimica et Cosmochimica Acta, 66, 1429–1448.
Ayalew, D., Ebinger, C., Bourdon, E., Wolfenden, E., Yirgu, G., & Grassineau, N. V. (2006). Temporal compositional variation of syn-rift rhyolites along the western margin of the southern Red Sea and northern main Ethiopian rift. In G. Yirgu, C. J. Ebinger, & P. K. H. Maguire (Eds.), The Afar volcanic province within the east African rift system, Geol. Soc. Spec. Publ., (Vol. 259, pp. 121–130).
Ayalew, D., & Yirgu, G. (2003). Crustal contribution to the genesis of Ethiopian plateau rhyolitic ignimbrites: basalt and rhyolite geochemical
provinciality. Journal of the Geological Society London, 160, 47–56.
Bachmann, O., & Bergantz, G. W. (2004). On the origin of crystal-poor rhyolites: extracted from batholithic crystal mushes. Journal of Petrology, 45, 1563–1585.
Bachmann, O., & Bergantz, G. W. (2008). Rhyolites and their source mushes across tectonic settings. Journal of Petrology, 49, 2277–2285. Bailoa, T., Schandelmeier, H., Franz, G., Sun, C.-H., & Stern, R. J. (2003). Plutonic and metamorphic rocks from the Keraf Suture (NE Sudan): A
glimpse of Neoproterozoic tectonic evolution on the NE margin of W. Gondwana. Precambrian Research, 123, 67–80.
Acknowledgments
Dereje Ayalew is grateful to the French Embassy in Ethiopia for offering SSHN
(Séjours Scientifiques de Haut Niveau)
travel grants. Part of this work was funded by the French Action Marges program. The authors thank Gilles Chazot and anonymous reviewer and Editor Marie Edmonds for their detailed and constructive comments and sug-gestions that amend the quality of the manuscript. Data presented in this paper are contained within the manuscript.