Characterization of Growth Patterns of Nanoscale Organic Films on
Carbon Electrodes by Surface Enhanced Raman Spectroscopy
Mustafa Supur,
†Scott R. Smith,
†and Richard L. McCreery
*
,†,‡†Department of Chemistry, University of Alberta, 11227 Saskatchewan Drive, Edmonton, Alberta T6G 2G2, Canada
‡National Institute for Nanotechnology, National Research Council Canada, 11421 Saskatchewan Drive, Edmonton, Alberta T6G
2M9, Canada
*
S Supporting InformationABSTRACT: Electrochemical deposition of aromatic organic molecules by reduction of diazonium reagents enables formation of molecular layers with sufficient integrity for use in molecular electronic junctions of interest to microelectronics. Characterization of organicfilms with thicknesses in the 1− 10 nm range is difficult with Raman spectroscopy, since most molecular structures of electronic interest have Raman cross sections which are too small to observe as either thin films on solid electrodes or within intact molecular junctions. Layer formation on a 10 nm thick Ag islandfilm on a flat carbon surface (eC/Ag) permitted acquisition of structural information using surface enhanced Raman spectroscopy (SERS), in many cases for molecules with weak Raman scattering. Raman spectra obtained on eC/Ag surfaces were indistinguishable from those on carbon without Ag present, and the spectra of oligomeric molecular layers were completely consistent
with those of the monomers. Layer growth was predominantly linear for cases where such growth was sterically allowed, and linear growth correlated strongly with the line width and splitting of the CC phenyl ring stretches. Molecular bilayers made by successive reduction of different diazonium reagents were also observable and will be valuable for applications of 1−20 nm organicfilms in molecular electronics.
E
lectrochemical reduction of aryl diazonium salts has long been used to fabricate organic films on various surfaces with a range of thicknesses from a single molecule (monolayer) to oligomers (multilayers) reaching to micrometer thick-nesses.1−14Electrochemical reduction of the diazonium moiety spontaneously generates an aryl radical of the parent molecule which may attach to the electrode surface to form the first molecular layer. Growth of the molecular layer continues with covalent bonding of aryl radicals to the grafted molecule(s) on the surface leading to oligomer formation (Figure 1).2,15,16As one type of parent molecule generates one-component oligomers, successive reduction of diazonium salts of two different parent molecules can be used to construct two-component oligomers on surfaces (Figure 1).17Our laboratory has used aromatic oligomers obtained by the aryl diazonium reduction on carbon substrates as the active components of large area molecular electronic junctions.18−24 The strength and stability of the carbon−carbon bonds between the substrate and the molecular layer and between oligomeric subunits imparts excellent thermal and lifetime stability to carbon-based molecular junctions enabling an initial commercial application in electronic music.25 Although the majority of the carbon-based devices reported to date involve molecular layers with thicknesses in the range of 1.5−5 nm, recent examples include single molecular layers or molecular bilayers with thicknesses up to 65 nm.3,17,26In addition to the
structure and electronic properties of parent molecules utilized for grafting,21charge transport characteristics in these junctions presumably rely on the thickness, orientation, and bonding of molecular subunits within the oligomeric molecular layer. Consequently, the variations in the growth patterns of the oligomers in a molecular junction may have a significant effect on charge-transport characteristics and ultimately electronic behavior.
Characterization of molecular layers on surfaces formed via diazonium reduction includes the verification of the covalent bonding with the surface and the integrity of parent aryl molecules in the layer. Infrared12,27and Raman4,28,29 spectros-copy of a few-nanometers thick multilayers show clear molecular signatures for the parent molecule as well as perturbation of the spectrum by formation of the C−C bond at the carbon surface. Formation of thick anthraquinone (AQ) multilayers monitored with infrared spectroscopy demonstrated integrity of the AQ subunits with thickness in a study of redox-mediated layer growth by diazonium reduction.12,30Polarized internal reflection FT-IR spectroscopy of diazonium-derived films on sp2carbon surfaces showed that the long axis of the molecules was generally perpendicular to the electrode surface, Received: January 28, 2017
Accepted: May 22, 2017 Published: May 22, 2017
Article
for both∼2 and ∼4 nm molecular films.27A more complete structural characterization of diazonium derived multilayers requires identification of the growth patterns, including the possibility of branching shown schematically in Figure 1A. Growth patterns can be categorized as linear, resulting in a structure similar to a linear polymer, or branched, with several possible nonlinear chains possible. Since the grafting of diazonium species proceeds by radical mediated irreversible reactions, oligomers are likely to be mixtures of linear and nonlinear sequences rather than consisting purely of linear chains or patterns with only one type of branching.
The current investigation was undertaken to determine possible synergy between the structure of a parent molecule and the growth patterns of its oligomer utilizing Raman spectroscopy of both single-component and two-component oligomerfilms. For this purpose, we selected diazonium salts of parent molecules with differing aromatic structures as shown in
Figure 2, i.e., terphenyl (TP), biphenyl (BP), bromophenyl (BrP),fluorene (FL), nitrophenyl (NP), nitrobiphenyl (NBP), azobenzene (AB), nitroazobenzene (NAB), and anthraquinone (AQ). These allow a comparative study on the effect of length, para-substitution, and rigidity of the parent molecules on the growth patterns of resulting oligomers. In practice, it is not possible to define all the nonlinear patterns individually in a
layer by using Raman techniques; however, the nonlinear content of an oligomer layer can be evaluated by comparing its Raman features to those of linear reference materials, similar to vibrational analysis of branched and unbranched polymers.31 We compared the Raman modes of on-ring and inter-ring stretches of phenyl rings in the oligomers with those of linear polymers and those predicted for linear model oligomers obtained by DFT methods. Some branching oligomer structures were also simulated to observe the effect of structural alignment on Raman features.
Since the majority of oligomers investigated in this study do not have adequate Raman cross sections on carbon surfaces to observe mono- or multilayer films, surface-enhanced Raman scattering (SERS) was achieved by depositing a rough Ag layer on carbon substrates before molecular layer deposition. The substrates were electron-beam deposited carbon (eC) on Au,32 a new carbon substrate with promising electronic and practical advantages over the pyrolyzed photoresist films (PPF)33−35 used previously. The main objectives of the current investigation include (i) suitability of eC as a Raman substrate, (ii) determination of linear and branched growth mechanisms for various monomer structures, and (iii) observation of molecular bilayers formed by successive deposition of two diazonium reagents.
■
EXPERIMENTAL SECTIONThe diazoniumfluoroborate (BF4−) salts were synthesized from their amino precursors, 4-amino terphenyl (TCI), 4-amino-biphenyl (Sigma-Aldrich), 4-bromoaniline (Sigma-Aldrich), 2-aminofluorene (Sigma-Aldrich), 4-nitroaniline (Sigma-Aldrich), 4-amino-4′-nitrobiphenyl (TCI), 4-aminoazobenzene (TCI), disperse orange 3 (Sigma-Aldrich), and 2-aminoanthraquinone (Sigma-Aldrich), in accordance with previous reports31,36−38 and verified by mass spectrometry. Cr, Au, eC, and Ag layers were prepared on Si/SiO2 (300 nm) diced wafer chips by an electron beam evaporation technique as described previ-ously.32,39 Pyrolyzed photoresist films (PPF) on Si/SiO2 diced wafer chips were also prepared as described pre-viously,35,40,41 and molecular layers were deposited after brief air exposure between the pyrolysis oven and an electrochemical
Figure 1.Grafting processes of one- (A) and two-component (B) oligomers on carbon substrates obtained by the successive electrochemical reduction of the diazonium of parent molecules. Panel A illustrates the linear and two types of nonlinear oligomers. Nonlinear patterns shown in panel A are schematic, and various structural deviations from linear growth are possible.
Figure 2. Structures of parent diazonium ions, all as BF4− salts: terphenyl (TP), biphenyl (BP), bromophenyl (BrP),fluorene (FL), nitrophenyl (NP), nitrobiphenyl (NBP), azobenzene (AB), nitro-azobenzene (NAB), and anthraquinone (AQ), used to graft oligomers on carbon substrates.
cell. Oligomer films were obtained through electrochemical reduction of diazonium salts of corresponding parent molecules (Figures 1 and 2), as reported in previous studies.16,22,41 Electrochemical reduction was performed by cyclic voltamme-try (CV) in the acetonitrile (ACN) solution of 1.0 mM of corresponding diazonium precursor. Cyclic voltammograms of reduction of NAB diazonium salt on eC and eC/Ag electrodes are shown in Figure S1. Scan conditions and spectral acquisition parameters are listed in the figure legends for the Raman spectra of oligomerfilms discussed below. As noted by a reviewer, initiation of voltammetric scans for diazonium reduction at +0.4 V vs Ag/Ag+ has the potential to oxidize and possibly dissolve the Ag deposited on the eC/Ag surfaces. As discussed in the Supporting Information,Figures S1−S4 and S7, modification of the Ag surface inhibits such corrosion (Figure S1 and S2), and SEM images before and after deposition show minor changes in Ag particle morphology (Figure S7). Furthermore, Raman spectra of NAB deposited with both +0.4 to−0.7 and 0.0 to −0.7 V vs Ag/Ag+scans are nearly identical (Figure S4), indicating that the +0.4 V initial potential is not necessary for SERS enhancement. To reduce the possibility of Ag corrosion, avoidance of potentials positive of 0.0 V vs Ag/Ag+is recommended.
Raman spectra on eC and PPF surfaces were acquired with a custom-built f/2 Raman spectrometer,42a back-thinned CCD (Andor DU940N) cooled to−80 °C. A 514.5 nm Ar ion laser (Coherent Innova) was utilized unless noted otherwise. Laser power was adjusted to less than 10 mW on a 50μm diameter point focus to minimize radiation damage, unless noted otherwise. As discussed below, the absolute Raman intensity varied with position on the sample surface, and each spectrum
presented in Figures 3−6 are averages of 10−15 spectra
obtained from 3 to 5 different sample positions. The Raman shift axis was calibrated daily with polystyrene. Density functional theory (DFT) calculations were performed to optimize the model structures and to predict their vibrational frequencies by using the B3LYP functional and 6-31G(d) basis set, as implemented in the Gaussian 09 program. Graphical outputs of the computational results were generated with the GaussView program (version 5.0) developed by Semichem, Inc.
■
RESULTS AND DISCUSSIONEffect of Rough Ag on Raman Scattering from eC and PPF Substrates. The Raman spectrum of eC differs distinctly from typical graphitic carbonfilms, e.g., PPF, which show well-defined D and/or G bands as shown in the Supporting Information,Figure S5.33,35,36Absence of recognizable D and G bands is related to presence of sp3content of 30−40%32
and increased structural disorder of eC, which has been reported previously.43,44In contrast to its disordered structure, the root-mean-square (rms) roughness of the nonpyrolyzed eC surface was reported to be 0.1−0.4 nm32,43and is generally less than the <0.4 nm rms roughness of the PPF surface.34Differences in the quantity of sp2 content in eC and PPF may imply a variation in the bonding of aryl radicals and in the resulting oligomer structure on these surfaces. To investigate this possibility, NAB was grafted on both surfaces under the same electrochemical conditions. Because of its preresonant Raman activity, NAB generates sufficient Raman scattering4,36without the need for a rough Ag layer, thus enabling a detailed comparison of its Raman spectra on PPF and eC. Raman spectra of NAB multilayers on PPF and eC reveal identical
Figure 3.(A) SEM images of electron-beam-deposited Ag layers on eC with indicated deposition thicknesses used to graft NAB oligomers. (B) Raman spectra of NAB oligomers on eC with indicated deposition thicknesses of rough Ag. Electrochemical deposition of NAB was achieved by 4 cycles from +0.4 to−0.7 V versus Ag/Ag+with a scan rate of 0.2 V s−1(seeFigure S1for cyclic voltammograms of reduction of NAB diazonium on eC and eC/Ag). Raman spectra of unmodified eC/Ag surface were subtracted from the NAB spectra. All spectra are averages of four 2-s CCD exposures with horizontal binning of 3 pixels.
peaks positioned at the same frequencies, indicating that the surface modifications are similar and the oligomers formed on both substrates have similar structures (Figure S5). The approximately 2× higher intensity of Raman scattering from NAB on eC compared to PPF is reproducible and may reflect differences in electronic coupling and the resulting changes in the resonance Raman cross section. Plasmonic enhancement from the Au layer under eC is unlikely with a 514.5 nm laser, and there was no indication of disturbance of the Au layer during diazonium deposition. The increased disorder of eC compared to PPF produces broader features in the range of 1000−1600 cm−1(Figures S5 and S6), which are advantageous due to their smaller interference with Raman features from the surface layers.
Ag island films on glass have been reported as excellent substrates for the electromagnetic enhancement underlying surface enhanced Raman spectroscopy (SERS).45−47 Electron beam deposition of Ag with different thicknesses results in rough Ag layers on the smooth eC surface, shown in SEM images inFigure 3A. While 5 nm of Ag deposition forms Ag nanoparticles smaller than 40 nm in size, 10 nm of Ag deposition yields rough Ag“islands” with dimensions of 40−60 nm and irregular shapes. The rough “islands” become more connected as the thickness of Ag is increased to 15 nm. The Raman features of the eC layer do not visibly change with Ag deposition, but their intensities are enhanced by a factor of 3, as shown inFigure S6. NAB was grafted on eC and different eC/ Ag surfaces using identical electrochemical conditions before obtaining the Raman spectra shown inFigure 3B. SEM images of eC/Ag (10 nm) surfaces taken after grafting with NAB show similar roughness features, implying that Ag islands are preserved without significant corrosion while being covered by NAB molecules during electrochemical diazonium reduction (Figure S7). Suppression of Ag corrosion during grafting is discussed further in the Supporting Information,Figures S1−S4
and S7. NAB oligomers have a maximum Raman intensity on eC/Ag surfaces when the thickness of deposited Ag is 10 nm. In this case, Raman scattering of the NAB layer is∼27 times more intense compared to that on eC without Ag. This might be due to optimization of the surface plasmon polariton resonance of the Ag particles to the laser wavelength. Although this enhancement is smaller than that observed for Ag islands on glass, it is sufficient to acquire excellent spectra for weaker Raman scatterers than NAB, as discussed below. The smaller enhancement is likely due to partial damping of the Ag island plasmons by the conducting eC surface. The Raman signatures of NAB oligomers, i.e., peak positions and intensities relative to each other, on PPF (Figure S5), eC, and eC/Ag surfaces (Figure 3B) are very similar, implying that they have similar structures. In comparison to Liang et al.,48the peak positions in
Figure 3B also match those of NAB oligomers bonded to PPF following deposition of Ag through a wire mesh to produce Ag islands on top of the NABfilm. Electrochemical reduction and bonding of NAB and other diazonium compounds readily occur on metals,1,49−52 so it is likely that diazonium-derived radicals bond to both the Ag islands as well as eC. However, the similarity of the Raman spectra of NAB oligomers on PPF, eC, and eC/Ag surfaces indicates that thefilms formed on Ag are structurally similar to those on eC and PPF, and we will assume that the film growth on both Ag and eC have similar mechanisms. As discussed next, the surface enhancement of SERS signals available on the eC/Ag surface enables useful spectra of many more molecular layers than previously possible. Except for the oligomers of NAB and AB, which are resonant Raman active, most of the molecules used in molecular electronics, including the remaining molecules inFigure 2, have Raman cross sections which are too small for observation without enhancement. Unless noted otherwise, all spectra presented below were obtained on the eC/Ag (10 nm) surface ofFigure 3, which enabled informative Raman spectra of both
Figure 4.Raman spectra of TP oligomers on eC (A) and eC/Ag (B), BP oligomers on eC/Ag (C) and BrP oligomers on eC/Ag (D) and eC (E). Atomic motions are shown for the 1280 (F) and 1600 (G) modes of linear sexiphenyl. The Raman spectrum of unmodified eC/Ag surface were subtracted from experimental spectra B−D. Electrochemical deposition of TP and BP was achieved by 9 cycles from +0.4 to −1.3 V on eC and 2 cycles from +0.4 to−0.5 V versus Ag/Ag+on eC/Ag with a scan rate of 0.2 V s−1. TP and BP spectra on eC/Ag are averages of 30 2-s and BrP spectra on eC/Ag are averages of 30 3-s CCD exposures. Spectra on eC are averages of 4 2-s CCD exposures.
single and double molecular layers involving all nine structures shown inFigure 2.
Linear and Branched Layer Growth of Single Component Oligomers. Raman spectra of phenylene oligomers made by reduction of the diazonium reagents of TP, BP, and BrP on eC and eC/Ag surfaces are shown in
Figure 4. Without surface enhancement, Raman signatures of the oligomers are not detectable in the spectra, in which only the broad bands of the eC substrate are apparent (Figure 4A,E). In the presence of the rough Ag layer, however, surface-enhanced spectra clearly show the Raman features of corresponding oligomers. TP and BP are capable of either linear or branched growth, while BrP can only form branched structures. The on-ring and inter-ring vibrations of TP layers reveal clear similarities to those observed for linear poly-paraphenylene53−56 and predicted by DFT for linear models (Figures S8 and S9), with a sharp peak at 1600 cm−1 and another at 1280 cm−1inFigure 4B,C. In contrast, the branched BrPfilm inFigure 4shows splitting of the∼1600 cm−1band at 1530, 1587, and 1606 cm−1plus additional inter-ring vibrations at 1283, 1326, and 1387 cm−1. These vibrations are absent in the spectrum of reference BrP (Figure S10), which shows only one peak for on-ring CC stretches at 1580 cm−1. The DFT-calculated Raman spectrum of the branched BrP hexamer shows evident splitting of on-ring vibrations at 1565, 1580, and 1596 cm−1and inter-ring vibrations at 1272, 1327, and 1395 cm−1 (Figure S10). These modes are not affected by the presence of the Br substituent, except for a 23 cm−1downward shift of the 1327 cm−1 vibration as predicted in the Raman spectrum of a nonlinear phenyl hexamer with and without Br (Figure S11). Apparently, the degeneracy yielding a single sharp peak at 1600 cm−1in the linear models is removed by branching in the BrP hexamer. While the peak at 1588 cm−1 represents only one on-ring vibrational mode of the linear sexiphenyl model, three peaks at 1565, 1580, and 1596 cm−1
are indeed the combination of at least eight on-ring modes of the branched BrP model (Figure S12). The consistency of the observed spectra with DFT predictions, the splitting of the C C ring stretch (∼1600 cm−1), and literature spectra for linear poly-para-phenylene provide good evidence that linear layer growth is dominant for BP and TP. Furthermore, TP, BP, and BrP oligomers grafted with different deposition conditions to produce different thicknesses show very similar Raman features (Figure S13), indicating that the linear or branched growth patterns are not strongly thickness dependent.
Azobenzene provides an additional example of a molecule which can undergo both linear and branched layer growth. Raman features of AB oligomers obtained on eC and eC/Ag are qualitatively identical (Figure 5A,B), as was observed for NAB multilayers grafted on these surfaces (Figure 3andFigure S5). This similarity supports the assumption that the Ag layer has little effect on observable film structure and growth pattern. Intensity with SERS is∼100 times greater for AB compared to eC alone, providing more accurate relative intensities and assignments of the Raman features. In Figure 5, the peaks at 1598 and 1247 cm−1 are attributed to on-ring and inter-ring stretches of AB oligomers, respectively, with the atomic motions shown in panel G, while the 1400−1500 cm−1features are all azo group stretches. Several observations provide evidence that linear growth predominates during AB film formation. First, the appearance of the inter-ring stretch at 1247 cm−1, which is not present in the AB monomer, indicates formation of a biphenyl moiety in the film. DFT predicts splitting of the inter-ring stretches (1200−1300 cm−1) of the branched AB trimer (structure shown inFigure S14), shown in
Figure 5F. The linear trimer, on the other hand, exhibits one peak at 1265 cm−1assigned to the inter-ring stretches (Figure 5E).
Second, the ∼1413 cm−1 azo stretch appears during film growth and is associated with an azo vibration involving the
Figure 5.Raman spectra of AB oligomers on eC (A), eC/Ag (B), and AB solid (C), calculated Raman spectra of monomer (D), linear (E), and branched (F) models of AB, and atomic motions of three linear AB trimer modes (G). Electrochemical deposition of AB was achieved by 8 cycles from +0.4 to−0.8 V on eC and 2 cycles from +0.4 to −0.5 V versus Ag/Ag+on eC/Ag with a scan rate of 0.2 V s−1. AB spectra on eC are averages of 5 3-s exposures on eC and 30 3-s CCD exposures on eC/Ag. Raman spectrum of unmodified eC was subtracted from the AB spectra. Calculated spectra were obtained by DFT at the B3LYP/6-31G(d) level of theory with a scaling factor of 0.9613. Dihedral angles between AB units are∼38° in optimized oligomers.
biphenyl moiety. It is closer in energy to a DFT predicted band for the linear isomer (Figure 5E) than that for the branched AB structure (Figure 5F). Third, the ∼1600 cm−1 phenyl deformation increases significantly relative to the highest energy azo stretch, with the intensity ratios indicated inFigure 5. Note also that the intensity of the 1598 cm−1band is much larger than that of the 1500 cm−1band for AB oligomers on both eC and eC/Ag and for the linear DFT model (Figure 5), but the reverse is true for AB solid, AB DFT, or the branched DFT structure (Figure 5F). The DFT calculations predict a degeneracy of the phenyl ring vibrations along the long axis of the linear AB oligomer similar to linear sexiphenyl, with the motions shown in Figure 5G. The intensity at 1598 cm−1 increases due to this degeneracy of the on-ring vibrations of the linear AB trimer whereas ring vibrations are distributed to the branches of the nonlinear model causing broadening and decrease in the intensity. As was the case for the polyphenylenes, the Raman spectra of AB films do not rule out a mix of linear and branched growth but do indicate that linear growth predominates.
Reduction of the anthraquinone diazonium ion is of special interest due to its ability to form very thick multilayers (>500 nm) via redox exchange of electrons through the growing film.12,26,30,57
In addition, rectifying molecular junctions can be constructed from AQ coupled to an electron donating molecule in a bilayer between conducting contacts.17 The Raman spectrum of AQ on eC without Ag is featureless (Figure 6A),
but a strong spectrum was observed on eC/Ag (Figure 6B). Both the on-ring stretch (1589 cm−1) and carbonyl stretch (1668 cm−1) are split in the multilayer, but not in the DFT spectra of either the AQ monomer or the linear oligomer. DFT predicts splitting of both bands in at least one of the possible branched isomers (Figure 6E), indicating that AQ growth occurs both with and without branching. The observed and DFT-predicted Raman frequencies are summarized inTable 1. Additional SERS spectra and analysis are provided in the Supporting Information,Figures S15 and S16, for diazonium-derived films made from fluorene, nitrobiphenyl and nitro-phenyl, none of which were observable without enhancement by the eC/Ag surface. Figure S17 shows the observed and predicted spectra for NAB multilayers, which are observable on eC surfaces with or without Ag enhancement. Splitting and/or broadening of the CC ring stretch at ∼1592 cm−1 was observed in all cases where branching was unavoidable (NP, NBP, NAB). The nitro stretch at ∼1330 cm−1 was clearly evident infilms of NP, NBP, and NAB, although its presence hindered observation of the ∼1250 cm−1 inter-ring stretches. The reduced symmetry of fluorene compared to biphenyl (Figure S18) significantly complicated the spectrum between 1000 and 1500 cm−1 and also prevented observation of a degenerate on-ring stretch similar to that in Figure 4G. A shoulder (∼1583 cm−1) and broadening of the 1600 cm−1band might be caused by branching, but the results do not permit an estimate of its extent.
Figure 6.Raman spectra of AQ multilayers on eC (A) and on eC/Ag (B), and calculated Raman spectra of the monomer (C), linear trimer (D), and branched trimer (E) of AQ. Spectra are averages of 12 3-s CCD exposures. Electrochemical deposition of AQ was achieved by 2 cycles from +0.4 to −0.5 V versus Ag/Ag+with a scan rate of 0.2 V s−1. Raman spectrum of unmodified eC was subtracted from the AQ spectrum (B). Calculated spectra were obtained by DFT at the B3LYP/6-31G(d) level of theory with a scaling factor of 0.9613. Dihedral angles between AQ units are∼38° in optimized oligomers.
Table 1. Anthraquinone Raman Frequencies
assignment AQ multilayer on eC/Ag AQ solid literatureb AQ monomer DFTa AQ trimer linear DFTa AQ trimer branched DFTa
carbonyl 1650, 1662 1668 1679 1680 1680, 1664
on-ring 1589, 1563 1598 1587 1588 1588, 1542
aObtained by DFT at the B3LYP/6-31G(d) level of theory with a scaling factor of 0.9613.bFrom ref58.
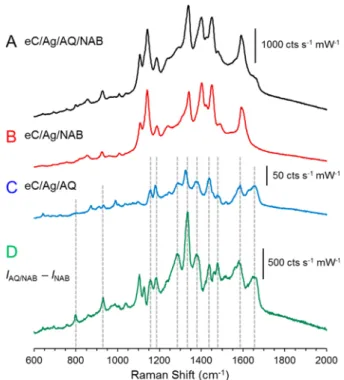
SERS Characterization of Two-Component Oligomer Bilayers. Electrochemical reduction of two distinct diazonium ions successively results in rectifying molecular junctions whose polarity and symmetry are directly affected by the relative energy levels of the two components.17 None of the bilayers examined to date were amenable to Raman characterization because one or both components had insufficient Raman cross sections to produce useful spectra without enhancement by Ag. Successive electrochemical reduction of AQ and NAB diazonium ions on the eC/Ag(10 nm) surface resulted in the Raman spectra of Figure 7A. NAB has a larger cross section
than AQ, and the most obvious Raman bands are similar to those for NAB alone shown in Figure 7B. Both Figure 7A,B were obtained with the same conditions, and share the intensity scale shown forFigure 7A. While the most prominent SERS bands observed from the bilayer result from NAB, e.g., 1592, 1450, 1402, 1341, 1188, 1141, and 1108 cm−1, there are several distinct bands in the bilayer, e.g., 1657, 1586, 1326, and 1285 cm−1, that reveal the presence of AQ. The similarity in the shape and position of the NAB SERS bands in the two-component oligomer spectrum (Figure 7A) suggest the growth pattern of NAB on AQ closely resembles the one-component spectrum of NAB modified on the eC/Ag substrate. Therefore, it is reasonable to conclude that NAB exhibits similar growth patterns during diazonium deposition on substrates of PPF, eC, eC/Ag, or eC/Ag/AQ. The much weaker spectrum of AQ alone on eC/Ag inFigure 7C was also obtained with the same conditions. Subtraction of the NAB spectrum (Figure 7B) from the bilayer spectrum (Figure 7A) with no adjustment of intensities or background subtraction produced the difference
spectrum of Figure 7D. Most of the AQ Raman features observed in the bilayer are now observable, along with additional peaks not apparent in either the NAB or AQ spectra (e.g., between 1100 and 1200 cm−1). These apparently new features could be subtraction artifacts, but a more interesting possibility is that they result from vibrations which are unique to the AQ/NAB interface. The radical mediated diazonium surface reaction likely results in covalent bonds between the NAB and AQ molecules, with presumably their own unique vibrational signatures. Multivariate curve resolution has proven valuable for examination of similar samples consisting of several components and also for identifying new components resulting from chemical reactions.59,60
Figure S19illustrates the spot-to-spot variability and the large SERS background signal when employing a 50 μm diameter laser point focus on the modified eC surface. For example, the relative standard deviation (rsd) of the absolute magnitude of the 1403 cm−1band of AQ/NAB on eC/Au was 28% forfive randomly chosen spots. Focusing the laser on a 0.05× 4 mm line reduced the rsd to 5.1%, and also permits increased laser power and SNR for the same power density at the sample.42As shown inFigure S20, the line focus also reduces laser radiation damage, thus yielding more stable spectra during long laser exposures. Since relative peak intensities are more important to the current analysis than absolute intensities, we note that rsd of the peak height of the 1403 cm−1 band above the broad background decreased from 42% for a point focus to 6% for the line focus.
■
CONCLUSIONSFormation of oligomeric films on eC/Ag island surfaces generates sufficient enhancement to observe useful spectra of several molecular layers which are not observable without enhancement, and the spectra of such layers on both eC and eC/Ag are very similar. Since stronger Raman bands are associated with aromatic and conjugated molecules, the similarity of the oligomeric and monomer Raman spectra indicates that the aromatic structures persist during layer growth. Raman spectra of molecules, which can form linear or branched oligomers (e.g., biphenyl, azobenzene, terphenyl), indicate that linear growth is favored if it is not prevented sterically. The CC ring stretch at ∼1600 cm−1consistently shows broadening or splitting when branching occurs, due to breakdown of degeneracy of the modes which involve more than one molecular subunit. In addition, relative peak intensities of the CC ring and NN stretches provide an indication of branching and nonlinearity in azobenzene oligomers. For the cases of nitrophenyl, bromophenyl, and nitrobiphenyl monomers, linear layer growth is not permitted sterically, and the oligomer Raman spectra have broadened or split CC ring stretches and several new bands in the 1100− 1300 cm−1 region. The rich vibrational information derived from Raman spectra is also useful for verifying formation of molecular bilayers and possibly for investigating the bonding between the two layers. Although both SERS and unenhanced Raman can indicate the integrity of the molecular subunit during layer growth and also the preponderance of linear growth, it is difficult to determine individual subunit orientations, dihedral angles, and minority species in the molecular film. The radical mediated growth of diazonium-derived molecular layers inevitably results in disorder, even if layer growth is predominantly linear. As is becoming clear from various studies of electron transport in molecular junctions,
Figure 7.SERS spectra of a two-component layer of AQ/NAB (A) and one-component layers of NAB (B) and AQ (C). (D) Difference spectrum calculated by subtracting spectrum B from spectrum A, i.e., IAQ/NAB− INAB. All spectra are averages of 100 accumulations with 1 s CCD exposures using a laser point focus (4.33 mW at the sample). Electrochemical deposition of AQ was achieved by 10 cycles from 0.0 to−0.6 V versus Ag/Ag+at 0.05 V s−1, whereas NAB employed 8 cycles from 0.0 to−0.6 V versus Ag/Ag+at 0.20 V s−1.
parameters such as delocalization, electronic coupling, and distance between localized electronic states are important parameters. We anticipate that the sensitivity of Raman spectroscopy for delocalized and aromatic molecular structures and their associated vibrations will remain important for characterizing molecular junctions derived from aromatic molecules.
■
ASSOCIATED CONTENT*
S Supporting InformationThe Supporting Information is available free of charge on the
ACS Publications website at DOI: 10.1021/acs.anal-chem.7b00362.
Additional Raman spectra and molecular structures (PDF)
■
AUTHOR INFORMATION Corresponding Author *E-mail:richard.mccreery@ualberta.ca. ORCID Mustafa Supur: 0000-0003-2086-7106 Scott R. Smith:0000-0003-0733-6044 Richard L. McCreery:0000-0002-1320-4331 NotesThe authors declare no competingfinancial interest.
■
ACKNOWLEDGMENTSThis work was supported by the University of Alberta, the National Research Council of Canada, the Natural Sciences and Engineering Research Council of Canada, and Alberta Innovates.
■
REFERENCES(1) Belanger, D.; Pinson, J. Chem. Soc. Rev. 2011, 40, 3995−4048. (2) Combellas, C.; Kanoufi, F.; Pinson, J.; Podvorica, F. I. Langmuir 2005, 21, 280−286.
(3) Yan, H.; Bergren, A. J.; McCreery, R.; Della Rocca, M. L.; Martin, P.; Lafarge, P.; Lacroix, J. C. Proc. Natl. Acad. Sci. U. S. A. 2013, 110, 5326−5330.
(4) Itoh, T.; McCreery, R. L. J. Am. Chem. Soc. 2002, 124, 10894− 10902.
(5) Adenier, A.; Combellas, C.; Kanoufi, F.; Pinson, J.; Podvorica, F. I. Chem. Mater. 2006, 18, 2021−2029.
(6) Lud, S. Q.; Steenackers, M.; Jordan, R.; Bruno, P.; Gruen, D. M.; Feulner, P.; Garrido, J. A.; Stutzmann, M. J. Am. Chem. Soc. 2006, 128, 16884−16891.
(7) Stockhausen, V.; Trippé-Allard, G.; Van Quynh, N.; Ghilane, J.; Lacroix, J.-C. J. Phys. Chem. C 2015, 119, 19218−19227.
(8) Fave, C.; Leroux, Y.; Trippe, G.; Randriamahazaka, H.; Noel, V.; Lacroix, J.-C. J. Am. Chem. Soc. 2007, 129, 1890−1891.
(9) Garrett, D. J.; Lehr, J.; Miskelly, G. M.; Downard, A. J. J. Am. Chem. Soc. 2007, 129, 15456−15457.
(10) Sinitskii, A.; Dimiev, A.; Corley, D. A.; Fursina, A. A.; Kosynkin, D. V.; Tour, J. M. ACS Nano 2010, 4, 1949−1954.
(11) Collins, G.; Fleming, P.; O’Dwyer, C.; Morris, M. A.; Holmes, J. D. Chem. Mater. 2011, 23, 1883−1891.
(12) Ceccato, M.; Bousquet, A.; Hinge, M.; Pedersen, S. U.; Daasbjerg, K. Chem. Mater. 2011, 23, 1551−1557.
(13) Kirkman, P. M.; Güell, A. G.; Cuharuc, A. S.; Unwin, P. R. J. Am. Chem. Soc. 2014, 136, 36−39.
(14) Munteanu, S.; Roger, J. P.; Fedala, Y.; Amiot, F.; Combellas, C.; Tessier, G.; Kanoufi, F. Faraday Discuss. 2013, 164, 241−258.
(15) Kariuki, J. K.; McDermott, M. T. Langmuir 2001, 17, 5947− 5951.
(16) Anariba, F.; DuVall, S. H.; McCreery, R. L. Anal. Chem. 2003, 75, 3837−3844.
(17) Bayat, A.; Lacroix, J.-C.; McCreery, R. L. J. Am. Chem. Soc. 2016, 138, 12287−12296.
(18) McCreery, R. L.; Bergren, A. J. Adv. Mater. 2009, 21, 4303− 4322.
(19) McCreery, R.; Bergren, A.; Morteza-Najarian, A.; Sayed, S. Y.; Yan, H. Faraday Discuss. 2014, 172, 9−25.
(20) McCreery, R.; Yan, H.; Bergren, A. J. Phys. Chem. Chem. Phys. 2013, 15, 1065−1081.
(21) Sayed, S. Y.; Fereiro, J. A.; Yan, H.; McCreery, R. L.; Bergren, A. J. Proc. Natl. Acad. Sci. U. S. A. 2012, 109, 11498−11503.
(22) Bergren, A. J.; McCreery, R. L.; Stoyanov, S. R.; Gusarov, S.; Kovalenko, A. J. Phys. Chem. C 2010, 114, 15806−15815.
(23) Anariba, F.; Steach, J.; McCreery, R. J. Phys. Chem. B 2005, 109, 11163−11172.
(24) Fereiro, J. A.; Kondratenko, M.; Bergren, A. J.; McCreery, R. L. J. Am. Chem. Soc. 2015, 137, 1296−1304.
(25) Bergren, A. J.; Zeer-Wanklyn, L.; Semple, M.; Pekas, N.; Szeto, B.; McCreery, R. L. J. Phys.: Condens. Matter 2016, 28, 094011.
(26) Ivashenko, O.; Bergren, A. J.; McCreery, R. L. Adv. Electron. Mater. 2016, 2, 1600351.
(27) Anariba, F.; Viswanathan, U.; Bocian, D. F.; McCreery, R. L. Anal. Chem. 2006, 78, 3104−3112.
(28) Liu, Y.-C.; McCreery, R. L. Anal. Chem. 1997, 69, 2091−2097. (29) Liu, Y.-C.; McCreery, R. L. J. Am. Chem. Soc. 1995, 117, 11254− 11259.
(30) Bousquet, A.; Ceccato, M.; Hinge, M.; Pedersen, S. U.; Daasbjerg, K. Langmuir 2012, 28, 1267−1275.
(31) Sano, K.; Shimoyama, M.; Ohgane, M.; Higashiyama, H.; Watari, M.; Tomo, M.; Ninomiya, T.; Ozaki, Y. Appl. Spectrosc. 1999, 53, 551−556.
(32) Morteza Najarian, A.; Szeto, B.; Tefashe, U. M.; McCreery, R. L. ACS Nano 2016, 10, 8918−8928.
(33) McCreery, R. L. Chem. Rev. 2008, 108, 2646−2687.
(34) Ranganathan, S.; McCreery, R. L. Anal. Chem. 2001, 73, 893− 900.
(35) Ranganathan, S.; McCreery, R. L.; Majji, S. M.; Madou, M. J. Electrochem. Soc. 2000, 147, 277−282.
(36) Nowak, A. M.; McCreery, R. L. J. Am. Chem. Soc. 2004, 126, 16621−16631.
(37) Chausse, A.; Chehimi, M. M.; Karsi, N.; Pinson, J.; Podvorica, F.; Vautrin-Ul, C. Chem. Mater. 2002, 14, 392−400.
(38) Hurley, B. L.; McCreery, R. L. J. Electrochem. Soc. 2004, 151, B252−259.
(39) Ivashenko, O.; Bergren, A. J.; McCreery, R. L. J. Am. Chem. Soc. 2016, 138, 722−725.
(40) Yan, H.; Bergren, A. J.; McCreery, R. L. J. Am. Chem. Soc. 2011, 133, 19168−19177.
(41) McCreery, R.; Wu, J.; Kalakodimi, R. J. Phys. Chem. Chem. Phys. 2006, 8, 2572−2590.
(42) Ramsey, J. D.; Ranganathan, S.; Zhao, J.; McCreery, R. L. Appl. Spectrosc. 2001, 55, 767−773.
(43) Blackstock, J. J.; Rostami, A. A.; Nowak, A. M.; McCreery, R. L.; Freeman, M.; McDermott, M. T. Anal. Chem. 2004, 76, 2544−2552.
(44) Chu, P. K.; Li, L. Mater. Chem. Phys. 2006, 96, 253−277. (45) Oklejas, V.; Sjostrom, C.; Harris, J. M. J. Phys. Chem. B 2003, 107, 7788−7794.
(46) Lacy, W. B.; Olson, L. G.; Harris, J. M. Anal. Chem. 1999, 71, 2564−2570.
(47) Roark, S. E.; Semin, D. J.; Rowlen, K. L. Anal. Chem. 1996, 68, 473−480.
(48) Liang, H.; Tian, H.; McCreery, R. L. Appl. Spectrosc. 2007, 61, 613−620.
(49) Lee, L.; Brooksby, P. A.; Downard, A. J. Electrochem. Commun. 2012, 19, 67−69.
(50) Lehr, J.; Garrett, D. J.; Paulik, M. G.; Flavel, B. S.; Brooksby, P. A.; Williamson, B. E.; Downard, A. J. Anal. Chem. 2010, 82, 7027− 7034.
(51) Laurentius, L.; Stoyanov, S. R.; Gusarov, S.; Kovalenko, A.; Du, R.; Lopinski, G. P.; McDermott, M. T. ACS Nano 2011, 5, 4219− 4227.
(52) Shewchuk, D. M.; McDermott, M. T. Langmuir 2009, 25, 4556−4563.
(53) Furukawa, Y.; Ohta, H.; Sakamoto, A.; Tasumi, M. Spectrochimica Acta Part A: Molecular Spectroscopy 1991, 47, 1367− 1373.
(54) Furukawa, Y.; Ohtsuka, H.; Tasumi, M. Synth. Met. 1993, 55, 516−523.
(55) Dubois, M.; Naji, A.; Billaud, D. Electrochim. Acta 2001, 46, 4301−4307.
(56) Abdulkarim, A.; Hinkel, F.; Jänsch, D.; Freudenberg, J.; Golling, F. E.; Müllen, K. J. Am. Chem. Soc. 2016, 138, 16208−16211.
(57) Chernyy, S.; Bousquet, A.; Torbensen, K.; Iruthayaraj, J.; Ceccato, M.; Pedersen, S. U.; Daasbjerg, K. Langmuir 2012, 28, 9573− 9582.
(58) Lee, C.-J.; Kang, J.-S.; Park, Y.-T.; Rezaul, K. M.; Lee, M.-S. Bull. Korean Chem. Soc. 2004, 25, 1779−1783.
(59) Shoute, L.; Pekas, N.; Wu, Y.; McCreery, R. Appl. Phys. A: Mater. Sci. Process. 2011, 102, 841−850.
(60) Bonifas, A. P.; McCreery, R. L. Anal. Chem. 2012, 84, 2459− 2465.