Publisher’s version / Version de l'éditeur:
Vous avez des questions? Nous pouvons vous aider. Pour communiquer directement avec un auteur, consultez la première page de la revue dans laquelle son article a été publié afin de trouver ses coordonnées. Si vous n’arrivez pas à les repérer, communiquez avec nous à PublicationsArchive-ArchivesPublications@nrc-cnrc.gc.ca.
Questions? Contact the NRC Publications Archive team at
PublicationsArchive-ArchivesPublications@nrc-cnrc.gc.ca. If you wish to email the authors directly, please see the first page of the publication for their contact information.
https://publications-cnrc.canada.ca/fra/droits
L’accès à ce site Web et l’utilisation de son contenu sont assujettis aux conditions présentées dans le site LISEZ CES CONDITIONS ATTENTIVEMENT AVANT D’UTILISER CE SITE WEB.
[Proceedings of the Conference], 2018-05
READ THESE TERMS AND CONDITIONS CAREFULLY BEFORE USING THIS WEBSITE. https://nrc-publications.canada.ca/eng/copyright
NRC Publications Archive Record / Notice des Archives des publications du CNRC :
https://nrc-publications.canada.ca/eng/view/object/?id=4d84f84a-c5df-4429-945d-f6b99fb1c317
https://publications-cnrc.canada.ca/fra/voir/objet/?id=4d84f84a-c5df-4429-945d-f6b99fb1c317
Archives des publications du CNRC
This publication could be one of several versions: author’s original, accepted manuscript or the publisher’s version. / La version de cette publication peut être l’une des suivantes : la version prépublication de l’auteur, la version acceptée du manuscrit ou la version de l’éditeur.
Access and use of this website and the material on it are subject to the Terms and Conditions set forth at
Value of 3D physical modeling in harbor design: gateway harbor
Chicago case study
1
VALUE OF 3D PHYSICAL MODELING IN HARBOR DESIGN -
GATEWAY HARBOR CHICAGO CASE STUDY
Andrew Cornett1, Scott Baker2, Bill Weaver3
ABSTRACT
In this paper the important role that physical modeling can play in enabling the efficient and optimized design of ports, harbors, and marinas is discussed with reference to a specific project example, known as Gateway Harbor, Chicago. A 3D hydraulic model study was commissioned to help optimize and validate the design of Gateway Harbor, a new harbor proposed for a site beside Navy Pier on the shore of Lake Michigan near the center of Chicago, Illinois, USA.
A 3D physical model of the eastern/outer portion of the proposed harbor was constructed in a 36m x 30m multidirectional wave basin at a geometric scale of 1/30. Accurate reproductions of a range of extreme wave conditions were generated in the model by means of a sophisticated 60-segment directional wave generator. The model was fitted with instrumentation to measure wave conditions within the harbor and uplift pressures on an existing deck-on-pile structure running along the south side of Navy Pier. After establishing wave conditions in the new harbor and wave-induced uplift pressures on the pile-supported deck structure for existing conditions and for the baseline harbor layout, the focus shifted to investigating alternative harbor layouts that would alleviate the uplift pressures and reduce wave agitation and wave overtopping as much as possible without increasing project costs substantially. Over twenty alternative harbor layouts were modeled and assessed in the physical model study. Some of the more effective harbor layouts were able to reduce uplift pressures, agitation levels and overtopping considerably compared to the baseline layout. The finding that excessive uplift pressures could be reduced to acceptable levels by making relatively small and inexpensive changes to the harbor layout was an important factor in the viability of the Gateway Harbor project. This important refinement and optimization of the baseline design would not have been possible without the 3D physical model study.
INTRODUCTION
In this paper the important role that physical modeling can play in supporting the efficient and optimized design of ports, harbors, and marinas will be discussed. While the power and capability of numerical modeling approaches has increased dramatically in recent decades, some important gaps remain where physical modeling approaches can deliver better, more reliable answers. Physical modeling facilities and technologies have also improved in recent decades, and physical modeling studies, particularly those conducted at large scale, remain the preferred approach to optimize the layout and design of rubble-mound breakwaters and revetments to suit local conditions, and validate the performance of proposed designs prior to construction. Physical model studies also remain the best approach to predict the magnitude and character of wave-induced uplift pressures on the underside of pile-supported deck structures, and to develop and evaluate alternative strategies for attenuating uplift pressures. Physical model studies are also the best approach for predicting overtopping flows due to waves at complex three dimensional structures, and predicting the behavior of ships moored within harbors. All of the important physical processes governing wave propagation and wave structure interactions, such as wave refraction, diffraction, reflection, wave breaking, non-linear wave-wave interactions, wave run-up, overtopping, interstitial flows, and armor unit stability, can be reproduced in a realistic manner in a large-scale 3D physical model.
The important role that a 3D physical model study can play in supporting the design of a new harbor will be illustrated through reference to a specific project. Gateway Harbor has been proposed as a new harbor to be constructed beside Navy Pier on the shore of Lake Michigan near the center of the
1
Program Leader, Ocean, Coastal & River Engineering, National Research Council Canada, Ottawa, Canada
2
Research Engineer, Ocean, Coastal & River Engineering, National Research Council Canada, Ottawa, Canada
3
City of Chicago, Illinois, USA. Gateway Harbor will be located just south of Navy Pier, and will offer sheltered moorage mainly for recreational yachts, tour boats, and passenger ferries. The project site is located behind an outer breakwater which offers partial sheltering during storms. However, because the outer breakwater is a low-crested structure that experiences a large amount of overtopping during extreme events, the Gateway Harbor site is exposed to moderate wave action during design events with elevated water levels, large waves, and strong onshore winds.
A 3D physical model study was commissioned to support the design of the new harbor. The model study was commissioned by AECOM, funded by the City of Chicago, and conducted by the Ocean, Coastal and River Engineering research centre (OCRE) of the National Research Council, Canada (NRC). Key issues to be addressed included:
a) Wave agitation within the new harbor, which is strongly influenced by the wave overtopping passing over the low-crested outer breakwater.
b) Wave uplift pressures on the underside of a lengthy existing pile-supported deck structure. c) Potential optimizations to the harbor layout and the design of the new structures to reduce
wave disturbance and wave loads, reduce costs, and improve constructability.
A three-dimensional 1/30 scale physical model of the proposed harbor was constructed in NRC-OCRE’s 36m by 30m directional wave basin located in Ottawa, Canada. Accurate reproductions of a range of extreme wave conditions were generated in the model by means of a sophisticated 60-segment directional wave generator. The model was fitted with instrumentation to measure wave agitation within the harbor and uplift pressures on the existing deck-on-pile structure running along the south side of Navy Pier, and with several video cameras to monitor conditions in the model.
An initial series of tests was conducted to verify the incident wave conditions in the model for existing conditions without the new harbor. Following this, a 1/30 scale model of the eastern/outer part of the new harbor was constructed and tested in a wide range of extreme water levels and wave conditions particular to the site. The new breakwater structures were constructed using rock materials that were selected to reproduce the hydraulic performance and submerged stability of the materials specified in the prototype design. More than twenty alternative harbor layouts were simulated in the model, and the results of these studies have been assessed to help develop an optimized, cost-effective design which minimizes wave uplift forces, wave agitation, and construction costs. After modifying the model to simulate the inner (western) part of the proposed harbor, a final series of tests was performed to investigate wave agitation throughout the inner harbor.
The study results showed that the initial harbor layout generated significant uplift pressures on the deck-on-pile structure running along the south side of Navy Pier under certain extreme wave conditions and water levels. Numerous modifications to mitigate the issue were subsequently developed, assessed, and verified in the model in an efficient and cost-effective manner. The most effective layouts delivered substantial and important reductions in wave loads, wave disturbance, and wave overtopping that were an important factor contributing to the viability of the new harbor. Such extensive and effective optimization could not have taken place without the 3D physical model study. Many researchers have studied wave-in-deck loads over the past decade using a variety of theoretical, experimental, and numerical methods. Wave-in-deck loads on various pile-supported coastal structures such as jetties, piers, wharves and bridges have been studied experimentally by Cornett et al. (2013), Tirindelli et al. (2003), Cuomo et al. (2007, 2009), Murali et al. (2009), and Meng et al. (2010). All these authors analyzed data from scale model tests to investigate the pressures and loads on beam and deck elements subject to wave impact under various conditions.
Project Background
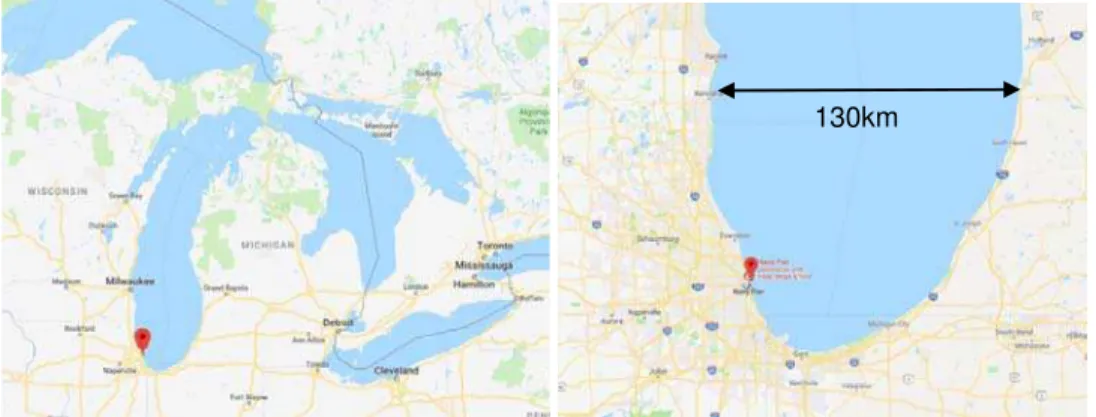
Gateway Harbor will be located on the western shore of Lake Michigan near the center of the City of Chicago, between Navy Pier and the entrance to the Chicago Sanitary and Ship Canal (see Figure 1 and Figure 2). The project site is located behind an existing offshore breakwater that provides partial sheltering during storms (see Figure 2). Existing conditions around Navy Pier can be seen in Figure 2, while Figure 3 shows a rendering of future conditions, including the baseline configuration of the proposed Chicago Gateway Harbor. The proposed development includes one or more new Landing Piers abutting the south edge of Navy Pier, improvements to Dime Pier, new arc-shaped rubble-mound breakwaters extending North and South from Dime Pier, a new rubble-rubble-mound breakwater extending north from the Canal entrance, and mooring infrastructure for recreational yachts. Further information on the proposed harbor is available at PBCC (2017).
3
Figure 1. Gateway Harbor is located in central Chicago on the southwest shore of Lake Michigan (images by Google).
Figure 2. Gateway Harbor is to be located immediately south of Navy Pier in downtown Chicago (images by Google).
Offshore Breakwater
Navy Pier
Dime Pier
Chicago Sanitary and Ship Canal
Gap Gap
Figure 3. Rendering of the proposed Chicago Gateway Harbor (source: AECOM).
Elevations for this study are referenced to the local Low Water Datum (LWD) which is 1.3 ft (0.4m) above Chicago City Datum (CCD). Lake levels at the site may vary from 0 ft LWD to roughly +6 ft (1.83m) LWD under extreme conditions. Previous analysis by Baird and Associates (1990) suggests that during severe storms, the site may experience significant wave heights up to 5.5 ft (1.68m) approaching from 135° (SE), 112.5° (ESE) and 90° (E) directions, with peak periods of 8 to 10 s. These design conditions result from wave energy overtopping the outer breakwater combined with wave energy penetrating through the gaps in the outer breakwater. The bathymetry throughout most of the harbor area is relatively flat at a depth near -26 ft (-7.9m); becoming gradually deeper heading offshore.
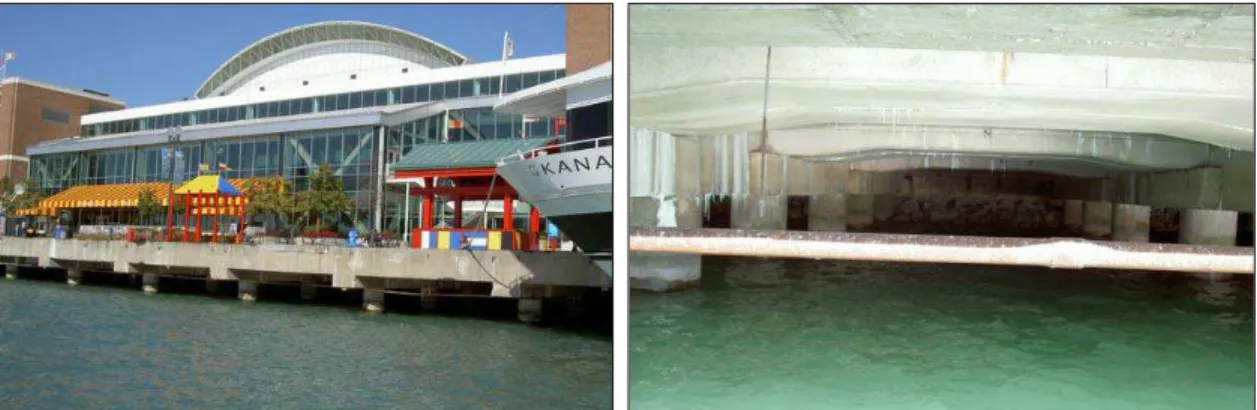
Navy Pier is an important Chicago landmark packed with a wide array of restaurants, shops, entertainment offerings, cultural attractions, and services for tourists. The south side of Navy Pier features a 96 ft (29.3m) wide by 2,429 ft (740.8m) long pile-supported deck structure (relieving platform) that was built in several stages over past years following several different designs. The outer (eastern) end of the deck-on-pile structure features a very dense array of vertical and battered piles. The lakebed under the relieving platform slopes up from an elevation near -25 ft (7.6m) along the south edge to approximately 0 ft next to Navy Pier. The upper part of this fill is protected with armor stone. A portion of the existing deck-on-pile structure can be seen in Figure 4.
Figure 4. Existing deck-on-pile structure along the south side of Navy Pier.
New rubble-mound breakwaters Dime Pier (enlarged) New Landing Piers Navy Pier (existing)
Inner Harbors
Outer Harbors Existing deck-on-pile structure
5
Dime Pier, which is currently in a poor state of repair, will be repaired and enlarged as part of the Gateway Harbor development. The existing pier is approximately 24 ft (7.3m) wide and has a crest elevation near +2 ft (0.61m) LWD. The enlarged pier will be approximately 30 ft (9.1m) wide and will have a crest elevation of +8.0 ft (2.44m) LWD.
The new Landing Piers are proposed as deck-on-pile structures. An option considered in conceptual design was to reduce wave agitation at the new piers by fitting the eastern pier with a vertical wave barrier (baffle wall). However, there was concern that such a wave barrier may reflect waves towards the deck-on-pile structure, thereby causing an increase in the uplift pressures exerted on the underside of the deck under certain conditions. The need for a vertical wave barrier and its effects under design conditions was uncertain and required further study.
The new North and South Arc Breakwaters (attached to Dime Pier) are proposed as a 24 ft (7.32m) wide sheet pile cell with +8.0 ft (2.44m) LWD crest elevation supporting a rubble-mound revetment on the exposed lake side. The new East Breakwater (attached to the north entrance to the Sanitary and Ship Canal) is proposed as a conventional rubble-mound structure with 1:1.5 side slopes, stone armoring, and a 12 ft (3.66m) wide crest at +8.0 ft (2.44m) LWD. Preliminary designs for these structures specified 2.9 and 2.0 ton armor stone.
PHYSICAL MODEL DEVELOPMENT
Study ObjectivesThe main objectives for the physical model study were as follows:
Measure wave agitation throughout the outer and inner harbor under the extreme storm conditions particular to the site;
Measure and observe wave interaction and overtopping at modified existing and proposed new structures within the harbor;
Measure the wave uplift pressures on the underside of the deck-on-pile structure running along the south side of Navy Pier; and
Help optimize the initial designs to improve their performance and constructability and reduce overall project costs.
These objectives were fulfilled by designing and constructing a 1/30 scale 3D physical model of Gateway Harbor (including the south side of Navy Pier), outfitting the model with instrumentation for measuring waves and pressures, and by conducting tests to investigate the wave agitation and wave-structure interactions in a range of moderate and severe storm conditions.
Physical Model Design
NRC’s 36 m by 30 m Multidirectional Wave Basin (MWB) features a 30 m by 20 m test area and is equipped with a powerful 30 m long 60-segment directional wavemaker. The model was designed according to Froude scaling principles, and scaling relationships derived from Froude scaling laws were used to relate conditions in the model to corresponding conditions in nature. The design philosophy was to adopt as large a model scale as possible to ensure that scale effects resulting from differences in Reynold’s number and surface tension would be minimized as much as possible. Freshwater was used in the model to represent the lake water at the project site. The rock materials on the surface of the various rubble-mound structures were sized to have a similar hydraulic stability as in nature.
The physical model was designed so that the outer part of the proposed Gateway Harbor could be modeled and studied in a range of extreme waves approaching from the SE, ESE and E directions. Moreover, the model was designed so that the impacts (if any) of the proposed developments on the uplift pressures exerted on the existing pile-supported deck on the south side of Navy Pier could be assessed. Unfortunately, the entire harbor could not be modeled within the MWB facility at 1/30 scale. However, it was judged better to model most of the new harbor at 1/30 scale, rather than model the
entire harbor at 1/50 scale, since the larger scale (1/30) would be technically superior and provide more reliable estimates of both wave disturbance and uplift pressure (see Figure 5).
In general, the bathymetry throughout most of the harbor area is relatively flat at a depth of approximately -26 ft. For sake of economy, the physical model assumed a constant lakebed elevation throughout the harbor area of -26 ft. It should be noted that the outer breakwater and its effects on the incident waves was not included in the physical model domain. Hence, the incident wave conditions for the physical model study were established on the west (shoreward) side of the outer breakwater.
Figure 5. 1/30 scale model of outer Gateway Harbor.
Construction and Outfitting
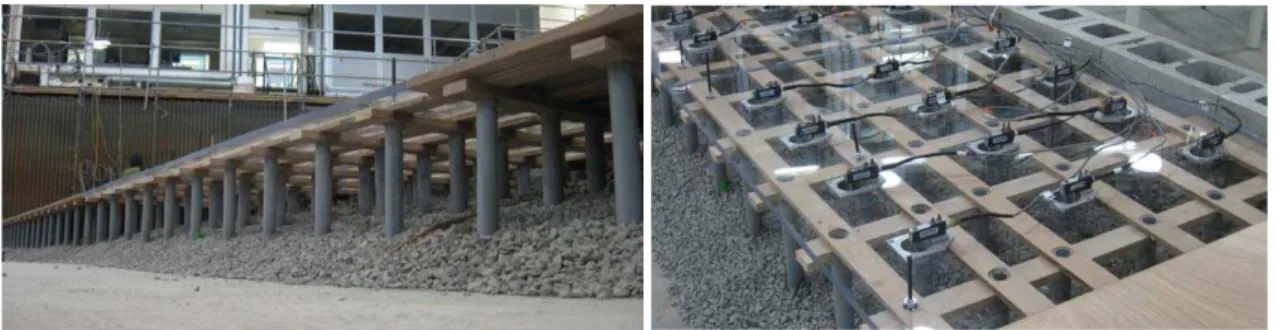
A 1/30 scale reproduction of the south-eastern part of Navy Pier, including a 1,435 ft (437.7m) long portion of the pile-supported deck, was constructed in the model (see Figure 6). Most of the 96 ft (29.3m) wide deck structure features concrete pile caps on 24 ft (7.32m) centers, each supported by six 3 ft (0.91m) piles. The solid deck is supported by a grid of concrete girders resting on the pile caps. In the model, the girders and pile caps were represented by strips of 19mm and 12mm marine plywood, the piles were representing by plastic tubing, and the deck was represented by sheets of 19mm thick marine plywood or Perspex. The underside of the decking was leveled to an elevation of +6.2 ft (1.89m) LWD to match existing conditions at the site. A sloping revetment was constructed below the deck-on-pile structure to replicate existing conditions. Each of the new 250 ft (76.2m) long Landing Pier structures was modeled in a similar manner, except that the sloping revetment was excluded.
Figure 6. 1/30 scale model of deck-on-pile structure fitted with pressure plate sensors.
Navy Pier deck-on-pile structure North breakwater Dime Pier Landing Piers East breakwater
7
Twenty-one pressure plate sensors were installed in the model and used to measure the uplift pressures due to water contact with the underside of the deck-on-pile structures (see Figure 6). The pressure plate design, shown in Figure 7, consists of a circular aluminum sensing plate connected by a stiff rod to a water-proofed high-precision shear beam load cell. The assembly is sealed against water intrusion by means of a thin latex membrane secured with an o-ring. For this study, the pressure plates were installed so that the circular sensing disk was mounted flush with the underside of the deck. Pressures were obtained by dividing the measured load by the effective surface area of the plate (17.5ft2 or 1.63m2 at full scale). The pressure plates feature fundamental free vibration frequencies in excess of 500 Hz, making them useful for measuring impulsive wave slamming loads. The load cells were calibrated prior to assembly, and the pressure plates were checked in situ by applying a static load. During the study, many of the pressure plate sensors were moved and re-installed several times to record uplift pressures in 46 different locations to suit the objectives of each test series. The pressure plate output was sampled at 500 Hz.
Figure 7. Pressure plate design and assembly.
Masonry blocks were used in the model to simulate the sheet-pile crib structures specified in preliminary designs for the North and South breakwater structures. Five different classes of crushed rock were prepared to match specifications and used to represent the core, filter, and armor layers of the new rubble-mound structures. Templates and precise surveying methods were used to ensure that the model structures conformed to prototype designs. The exposed surface of the armor stone was painted to facilitate visual assessment of damage. Finally, the elevation of the lakebed within the entrance to the southern harbor was replicated in the model by adding a layer of fine gravel on top of the level concrete floor.
Twenty-three capacitance-type wave gauges, which operate by sensing the change in capacitance that occurs as a portion of an insulated wire becomes wetted, were deployed to measure wave conditions at various locations throughout the model domain. The wave gauges were calibrated at regular intervals throughout the study by moving them vertically while the water level remained constant. The measured wave records were analyzed using comprehensive and well-proven GEDAP analysis programs and procedures. GEDAP (Miles, 1990) is a software system developed by NRC to support the synthesis and generation of waves in the laboratory, and for the analysis of waves and wave-related data from physical model studies. Numerous statistics and derived parameters consistent with PIANC-IAHR (1986) definitions were computed from the time histories and spectra recorded at each gauge, and many of these were stored in a spreadsheet database for further analysis, plotting, and manipulation.
Wave Conditions and Water Levels
Thirty-eight unique combinations of water level and incident wave condition were reproduced in the physical model to represent design conditions with return periods ranging from 12 months up to 1,000 years approaching Chicago from the east (90°), east-southeast (112.5°), and southeast (135°)
directions. Water levels ranged from +2.0 ft (0.61m) up to+6.2 ft (1.89m), peak periods ranged from 5.5 s to 9.5 s, and significant wave heights (Hm0) outside the outer breakwater ranged from 3.0 ft
(0.91m) up to 15.6 ft (4.76m). Wave heights inside (shoreward) the outer breakwater were estimated by AECOM using a combination of numerical simulation and analysis of wave buoy data from both sides of the outer breakwater. AECOM’s analysis found that the incident wave conditions inside the outer breakwater tended to vary spatially, with larger wave heights to the south of Dime Pier, and smaller wave heights to the north of Dime Pier. The significant wave height of the incident waves inside (shoreward) the outer breakwater and south of Dime Pier was determined to range from 1.75 ft (0.53m) up to 9.2 ft (2.81m).
All incident seastates were modelled as short-crested irregular waves. The distribution of wave energy with frequency was assumed to follow the well-known JONSWAP spectrum, while the distribution of wave energy with direction was assumed to follow a cosine-power spreading function. The directional spreading functions for this study had a standard deviation near 15°. Target wave time histories were synthesized from the target directional spectrum using the single summation model paired with the random phase method as described by Cornett et al. (1993). For this study, the duration of each wave train was set equal to one full scale hour (or 657 s at model scale).
For this study, in order to better simulate the spatially varying wave conditions inside the outer breakwater near the end of Dime Pier, the wavemaker was notionally divided into three zones, and different wave conditions were synthesized and generated in each zone. The northern zone included wavemaker segments 1 to 20 and was used to generate the wave conditions specified on the north side of Dime Pier. The southern zone extended from wavemaker segment 27 to 60 and this part of the machine was used to generate the wave conditions specified on the south side of Dime Pier. A smooth linear transition between the two different wave fields was specified over the third zone, between wavemaker segments 21 and 26. All of the incident wave conditions were generated, measured and verified in the physical model before constructing any of the new structures. The wavemaker command signals were tuned so that the incident wave conditions (Tp, Hmo and mean
direction) measured on the south and north sides of the outer end of Dime Pier were in good agreement with specifications.
Standard GEDAP time-domain and frequency-domain analysis algorithms were applied to analyze in considerable detail the wave conditions measured in the model. The directional properties of the incident waves were estimated using the Surface Slopes Maximum Entropy Method (SSMEM) described by Cornett et al. (2005), based on wave data measured at a compact 4-gauge array.
PHYSICAL MODEL OUTPUT
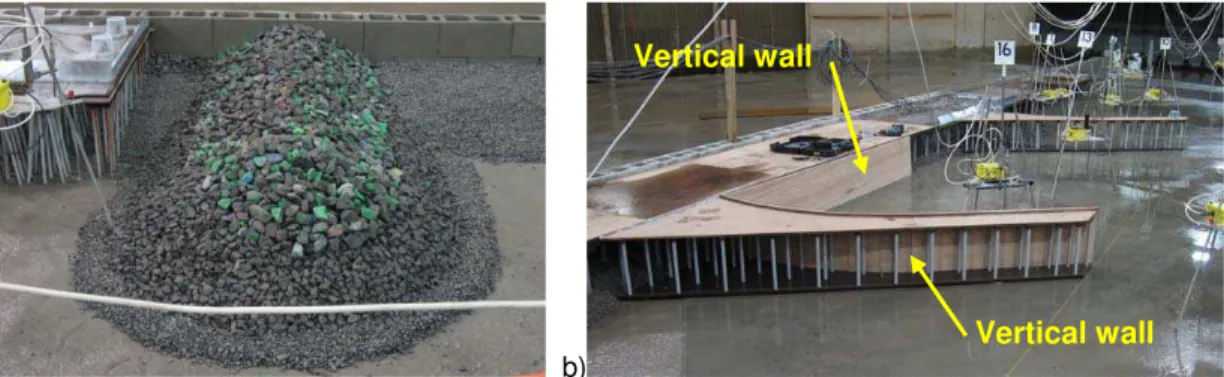
Test ProgramIn additional to modelling existing conditions, over twenty alternative layouts for Gateway Harbor were modelled and assessed in this study. Layout 1 simulated existing conditions (without the new harbor structures), while layouts 2 through 23 simulated alternative realizations of the Gateway Harbor development. Some of the layouts were quite similar to each other, while others featured significant differences. For the most part, these alternative layouts were explored while attempting to find an optimal layout that was economically viable, was able to attenuate the peak uplift pressures recorded on the underside of the existing deck-on-pile structure along the south side of Navy Pier, and was able to provide adequate protection for the inner harbor. For many of the layouts, vertical walls of various lengths were added to the southern edge of the deck-on-pile structure in order to block waves from penetrating under the platform. Harbor layouts 7 through 18 included a new rubble-mound breakwater structure attached to Navy Pier and located just beyond the eastern end of the deck-on-pile structure (see Figure 8a), which was not included in the baseline harbor layout. For layouts 19, 20, and 21, the new breakwater attached to Navy Pier was removed and a vertical wall was added to close off the east (outer) end of the deck-on-pile structure. The eastern Landing Pier was fitted with a solid vertical wall for harbor layouts 2, 4, 5, and 21. The western Landing Pier was fitted with a solid vertical wall for harbor layouts 3 and 14 (see Figure 8b).
9
a) b)
Figure 8. a) New spur breakwater attached to Navy Pier for harbor layout 8;
b) vertical walls added to Landing Pier and Navy Pier deck-on-pile structure for harbor layout 3.
Wave Disturbance
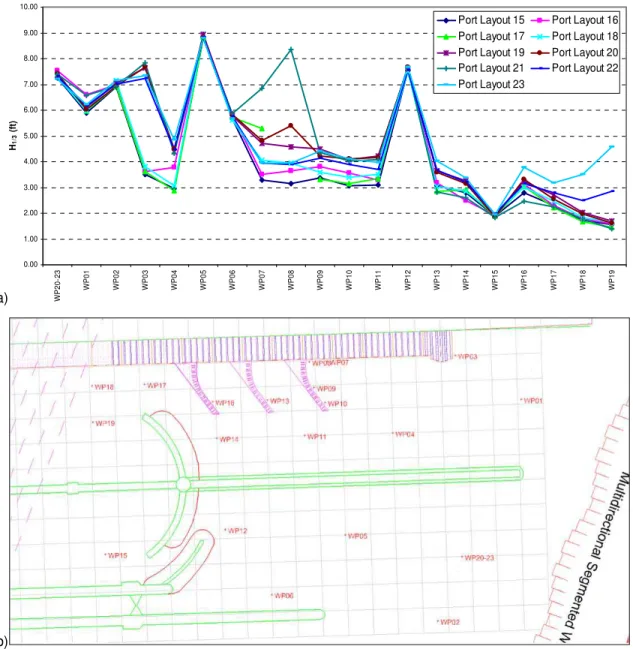
Wave conditions at multiple locations in the inner and outer harbors were measured for each of the harbor layouts described in the preceding section. In most cases, the performance of each layout was assessed for a few of the most critical combinations of water level and incident wave condition. In many cases, the changes in harbor layout considered in these tests had little influence on the wave conditions throughout many parts of the harbor. However, significant changes were sometimes observed at specific locations. Figure 9a shows an example of the wave condition measured at 20 locations in the physical model for a single test condition and nine different harbor (port) layouts. The measurement locations are shown in Figure 9b. Stations WP20-23 and WP01 are located on the south and north sides of the head of Dime Pier, WP15 is located within the south Inner Harbor, and WP19 is located within the north Inner Harbor. For this wave condition, wave heights in the outer harbour near the head of Dime Pier ranged from 6 ft (1.83m) north of Dime Pier) to ~7.4 ft (2.26m) south of Dime Pier. Wave heights in the south Inner Harbor (WP15) were steady at 2 ft (0.61m) for all layouts, while wave heights in the North Inner Harbor (WP 19) varied from 1.5 ft (0.46m) up to 4.5 ft (1.37m), depending on the harbor layout. The greatest variability in wave height occurred at locations WP07 and WP08, both located near the edge of the pile-supported deck structure and adjacent to the eastern Landing Pier, and at location WP03, near the southeast corner of the deck-on-pile structure. Wave heights in these three locations were larger for layouts where a vertical wall was added to the edge of the existing deck-on-pile structure in these locations. Results from three repetitions of a single test condition indicated that the wave conditions observed in the model were highly repeatable. The average standard deviation in significant wave height at each wave gauge was 0.10 ft (31mm), with a minimum standard deviation of 0.02 ft (6mm) and a maximum of 0.21 ft (64mm) full scale.
Compared to existing conditions, the baseline Gateway Harbor layout was responsible for significant reductions in wave agitation within the Inner Harbors over a wide range of moderate and extreme conditions. The addition of a vertical wall to one of the Landing Piers (see Figure 8b) caused the wave conditions in the vicinity of the Landing Pier to amplify and become more erratic; however, the vertical wall also served to reduce the amount wave energy able to penetrate into the inner portion of the North Harbor. This wave height reduction within the inner harbor was greatest when the vertical wall was added to the western Landing Pier, but was also significant when the eastern Landing Pier was fitted with a vertical wall.
The various forms of spur breakwater attached to Navy Pier studied in port layouts 7 – 18 (see Figure 8a) also provided notable reductions in overall wave agitation within the harbor for waves approaching from the east, but was less effective at attenuating waves approaching from more southerly directions. The test results clearly showed that the wave agitation in the south Inner Harbor remained unchanged after not only shortening the South Arc Breakwater (harbor layout 6) but also after removing a significant portion of the armor stone on the South Arc Breakwater (harbor layout 13). These alterations represent a significant cost savings without any noticeable penalty on wave agitation.
Vertical wall
Although quantitative measurements of wave overtopping were not collected, it was clear from qualitative observations that the pile-supported deck running along the south side of Navy Pier was regularly awash with water during the most severe test conditions. The overtopping was most frequent and most severe at the eastern end of the deck-on-pile structure. Significant sheet flows were observed across the deck throughout the duration of the worst storm events. Harbor layouts that included a new spur rubble-mound breakwater attached to Navy Pier were able to reduce this overtopping appreciably; however, it was not totally abated.
Significant levels of wave overtopping were also observed on the easternmost Landing Pier and near the junction between the Landing Pier and the existing deck-on-pile structure. The frequency and intensity of this overtopping was increased when the eastern side of the Landing Pier was outfitted with a vertical wall.
Further design work should bear in mind the potential risk to pedestrians and infrastructure due to overtopping flows during large storm events. It is noted that the wave agitation and wave overtopping may also be exacerbated by boat wakes, which were not simulated in these studies.
a)
b)
Figure 9. a) Influence of harbor layout on significant wave heights for seastate SE6; b) map of wave gauge locations.
0.00 1.00 2.00 3.00 4.00 5.00 6.00 7.00 8.00 9.00 10.00 WP 20-23 WP 01 WP 02 WP 03 WP 04 WP 05 WP 06 WP 07 WP 08 WP 09 WP 10 WP 11 WP 12 WP 13 WP 14 WP 15 WP 16 WP 17 WP 18 WP 19 H1/ 3 (ft )
Port Layout 15 Port Layout 16
Port Layout 17 Port Layout 18
Port Layout 19 Port Layout 20
Port Layout 21 Port Layout 22
11
Wave Uplift Pressure
A main focus of the testing was to determine the influence of the Gateway Harbor development on the wave uplift pressures on the pile-supported deck running along the south side of Navy Pier. Once this was established for the baseline harbor layout, the focus shifted to investigating alternative harbor layouts that would alleviate the uplift pressures and reduce wave agitation and wave overtopping as much as possible without increasing project costs substantially. Pressure readings were recorded at a rate of 500 samples per second (model scale) during every test conducted with harbor layouts 1 through 23. Uplift pressures were recorded in 46 locations using 21 pressure plate sensors. The pressure time histories were analyzed to determine various statistical quantities such as the maximum pressure, the average value of the five largest independent pressure pulses, and the average value of the ten largest independent pressure pulses. The latter two statistics provide less extreme, yet more statistically stable and reliable measures of the uplift pressure at each location. The average value of the five largest independent maximums can be thought of as the expected maximum over a 12 minute (prototype) duration. Similarly, the average value of the ten largest maximums is equivalent to the expected maximum over a 6 minute (prototype) duration.
Two representative examples of the pressure pulses recorded on the underside of the deck-on-pile structure are shown in Figure 10. Each figure shows the time history of the maximum pressure event (in black) together with the pressure fluctuations at neighboring sensors located nearby (colored lines). It should be noted that these pressure pulses are expressed in kilopascals (kPa) at full scale. It was evident that the largest uplift pressures were highly dynamic and impulsive and had short durations. Also, the pressures at neighboring sensors generally did not peak at the same time. In many cases the peak pressures at nearby locations were also much smaller. This implies that for any instant in time, the area of deck subject to high uplift pressures is localized and small.
Since the largest pressures were localized and acted over a very short interval, their impact may well be absorbed and dissipated within the deck-on-pile structure before any damage can occur. A dynamic analysis of the structure is recommended to properly interpret the impact and consequence of the impulsive pressures observed in this study.
Figure 10. Examples of uplift pressure pulses recorded during the Gateway Harbor study.
AECOM undertook a separate investigation to determine the load capacity of the Navy Pier deck-on-pile structure against uplift, which was estimated to be approximately 400 psf (19.2kPa). The easternmost part of the platform, constructed after 1991, was estimated to have a loading capacity against uplift of approximately 700 psf (33.5kPa). The pressures recorded in tests with the model configured to simulate existing conditions suggested that the existing deck-on-pile structure may have previously, or could in future, experience peak wave-induced uplift pressures nearing or exceeding the available loading capacity under severe storm conditions. The largest pressures were observed near the southern (outer) edge of the platform.
Results from tests with the baseline Gateway Harbor layout indicated that, for many test conditions, the peak uplift pressures on the deck-on-pile structure near the east Landing Pier were greater than for existing conditions. This pressure increase can be attributed to an increase in wave energy at the deck-on-pile structure caused by waves reflecting from the solid vertical wall installed on the curved east side of the eastern Landing Pier, as well as reflections from the North Arc Breakwater. Since the pressure sensors were concentrated in one area for these tests, it was difficult to discern the spatial extent of the pressure increase. For the next series of tests, the vertical skirt wall was removed from the eastern Landing Pier and installed on the western Landing Pier. At the same time, a 240 ft (73.2m) long skirt wall was installed along the southern edge of the deck-on-pile structure, near the junction with the western Landing Pier. The peak uplift pressures for this third harbor layout were smaller than for layout 2, but the wave conditions in the outer harbor were larger and more chaotic due to the wave energy reflecting from the vertical walls. In subsequent testing, several different arrangements of vertical skirt walls were modelled and assessed, while the 21 pressure plate sensors were moved to different locations to obtain information on uplift pressures on other regions of the deck-on-pile structure. A new rubble-mound spur breakwater extending south from the east end of Navy Pier was modelled in harbor layouts 7 through 18 (see Figure 8a), and this new structure proved effective in attenuating uplift pressures without exacerbating wave conditions in the outer and inner harbors for waves approaching from the east, particularly when the breakwater crest elevation was increased from +6 ft to +8 ft (1.83m to 2.44m). However, the new spur breakwater was less effective at attenuating waves approaching from the SE and ESE directions. Dime Pier was extended by 115 ft (35.1m) for harbor layouts 10 and 11 and this modification helped attenuate wave energy approaching from the SE and ESE directions.
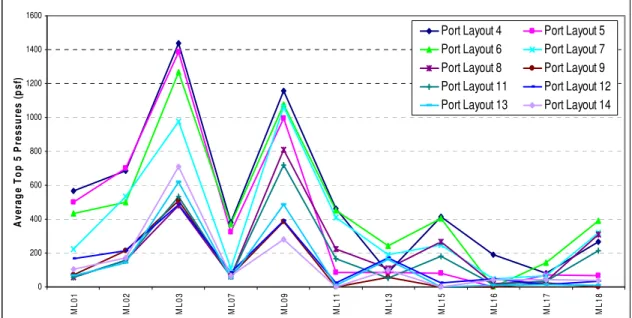
Some of the more effective harbor layouts were able to reduce uplift pressures below the levels observed for existing conditions. Figure 11 shows the changes in peak uplift pressure measured at eleven locations near the east end of the deck-on-pile structure in tests with harbor (port) layouts 4 through 14 and identical storm waves approaching from the east. This figure illustrates how optimizing the new harbor layout was able to reduce the largest uplift pressures to less than one-third of their earlier values. The finding that excessive uplift pressures could be reduced to acceptable levels by making relatively small and inexpensive changes in harbor layout was an important factor contributing to the viability of the Gateway Harbor development.
Figure 11. Influence of harbor (port) layout on peak uplift pressures at the east end of Navy Pier for storm waves from east.
0 200 400 600 800 1000 1200 1400 1600 M L01 M L02 M L03 M L07 M L09 M L11 M L13 M L15 M L16 M L17 M L18 A v e ra ge Top 5 P re s s ur e s ( ps f)
Port Layout 4 Port Layout 5 Port Layout 6 Port Layout 7 Port Layout 8 Port Layout 9 Port Layout 11 Port Layout 12 Port Layout 13 Port Layout 14
13
CONCLUSIONS
The important role that physical modeling can play in supporting the efficient and optimized design of ports, harbors, and marinas has been discussed in this paper with reference to a specific project example known as Gateway Harbor, Chicago. In this project, testing in a 1/30 scale 3D physical model played a key role in assessing wave loads, wave disturbance, and wave overtopping for the baseline layout, and in developing, assessing, and validating important design optimizations that could alleviate uplift pressures and reduce wave agitation and wave overtopping as much as possible without increasing project costs substantially. Over twenty alternative harbor layouts were modeled and assessed in the physical model study in a highly-efficient and cost-effective manner.
Some of the more effective harbor layouts were able to reduce uplift pressures, agitation levels, and overtopping considerably compared to the baseline layout. The improved performance resulting from these optimizations was important for the overall viability of the Gateway Harbour project, and would not have been possible without the 3D physical model study. The results of the study are being used by AECOM to develop a detailed final design for Chicago Gateway Harbor which reflects an optimized balance of cost, performance and risk.
REFERENCES
Cornett, A., Anglin, D., Elliot, T., 2013. Wave-in-Deck Loads for an Intricate Pile-Supported Pier and Variation with Deck Clearance. Proc. 32nd Int. Conf. on Ocean, Offshore and Arctic Eng.
(OMAE-2013), Nantes, France.
Cornett, A., M.D. Miles, & D. Pelletier. 2005. Measurement and Analysis of Multidirectional Waves Using Free Surface Slopes. Proc. 5th Int. Symposium on Wave Measurement and Analysis
(WAVES 2005), Madrid, Spain.
Cornett, A., Miles, M.D. & Nwogu, O.G. 1993. Physical Modelling of Multidirectional Waves. Proc. 2nd
Int. Symposium on Wave Measurement and Analysis (WAVES’93), New Orleans, USA.
Cuomo, G., Tirindelli, M., Allsop, W., 2007. Wave-in-deck loads on exposed jetties. J. Coastal Eng. 54 657-679.
Cuomo, G., Shimosako, K., Takahashi, S., 2009. Wave-in-deck loads on coastal bridges and the role of air. J. Coastal Eng. 56 (2009) 793-809.
Meng, Y., Chen, G., Yan, S. 2010. Wave interaction with deck of jetty on a slope. Proc. 2010 Int.
Conf. on Coastal Eng. (ICCE 2010), Beijing, China.
Miles, M.D., 1990. The GEDAP™ Data Analysis Software Package. NRC Technical Report TR-HY-030, Ottawa, Canada.
Murali, K., Sundar, V., Setti, K., 2009. Wave-induced pressures and forces on deck slabs near the free surface. J. Waterway, Port, Coastal and Ocean Eng. 135:269-277.
PIANC-IAHR (1986) List of Sea State Parameters. Supplement to Bulletin 52, PIANC, Brussels, Belgium.
Public Building Commission of Chicago (PBCC), ‘Gateway Harbor’, 2017. [Online]. Available: http://www.pbcchicago.com/projects/gateway-harbor. [Accessed 20 March 2018].
Tirindelli, M., Cuomo, G., Allsop, W., Lamberti, A., 2003. Wave-in-deck forces on jetties and related structures. Proc. 13th Int. Offshore and Polar Eng. Conf. (ISOPE 2003), pp 562-569.