Publisher’s version / Version de l'éditeur:
Vous avez des questions? Nous pouvons vous aider. Pour communiquer directement avec un auteur, consultez la
première page de la revue dans laquelle son article a été publié afin de trouver ses coordonnées. Si vous n’arrivez pas à les repérer, communiquez avec nous à [email protected].
Questions? Contact the NRC Publications Archive team at
[email protected]. If you wish to email the authors directly, please see the first page of the publication for their contact information.
https://publications-cnrc.canada.ca/fra/droits
L’accès à ce site Web et l’utilisation de son contenu sont assujettis aux conditions présentées dans le site
LISEZ CES CONDITIONS ATTENTIVEMENT AVANT D’UTILISER CE SITE WEB.
BMC Bioinformatics, 20, pp. 1-12, 2019-05-29
READ THESE TERMS AND CONDITIONS CAREFULLY BEFORE USING THIS WEBSITE.
https://nrc-publications.canada.ca/eng/copyright
NRC Publications Archive Record / Notice des Archives des publications du CNRC :
https://nrc-publications.canada.ca/eng/view/object/?id=caf4af02-5f73-4257-901b-92ed5416afd1
https://publications-cnrc.canada.ca/fra/voir/objet/?id=caf4af02-5f73-4257-901b-92ed5416afd1
NRC Publications Archive
Archives des publications du CNRC
This publication could be one of several versions: author’s original, accepted manuscript or the publisher’s version. / La version de cette publication peut être l’une des suivantes : la version prépublication de l’auteur, la version acceptée du manuscrit ou la version de l’éditeur.
For the publisher’s version, please access the DOI link below./ Pour consulter la version de l’éditeur, utilisez le lien DOI ci-dessous.
https://doi.org/10.1186/s12859-019-2902-6
Access and use of this website and the material on it are subject to the Terms and Conditions set forth at
Pairwise visual comparison of small RNA secondary structures with
base pair probabilities
R E S E A R C H A R T I C L E
Open Access
Pairwise visual comparison of small RNA
secondary structures with base pair
probabilities
Serge Léger
2†, Maria Beatriz Walter Costa
4†and Dan Tulpan
1,2,3*†Abstract
Background: Predicted RNA secondary structures are typically visualized using dot-plots for base pair binding probabilities and planar graphs for unique structures, such as the minimum free energy structure. These are however difficult to analyze simultaneously.
Results: This work introduces a compact unified view of the most stable conformation of an RNA secondary structure and its base pair probabilities, which is called the Circular Secondary Structure Base Pairs Probabilities Plot (CS2BP2-Plot). Along with our design we provide access to a web server implementation of our solution that facilitates pairwise comparison of short RNA (and DNA) sequences up to 200 base pairs. The web server first calculates the minimum free energy secondary structure and the base pair probabilities for up to 10 RNA or DNA sequences using RNAfold and then provides a two panel comparative view that includes CS2BP2-Plots along with the traditional graph, planar and circular diagrams obtained with VARNA. The CS2BP2-Plots include highlighting of the nucleotide differences between two selected sequences using ClustalW local alignments. We also provide descriptive statistics, dot-bracket secondary structure representations and ClustalW local alignments for compared sequences.
Conclusions: Using circular diagrams and colour and weight-coded arcs, we demonstrate how a single image can replace the state-of-the-art dual representations (dot-plots and minimum free energy structures) for base-pair probabilities of RNA secondary structures while allowing efficient exploration and comparison of different RNA conformations via a web server front end. With that, we provide the community, especially the biologically oriented, with an intuitive tool for ncRNA visualization.
Web-server:https://nrcmonsrv01.nrc.ca/cs2bp2plot
Background
Visual analysis of biological sequences is a crucial step in bioinformatics and computational biology and contributes substantially to biological data interpretation and algorithm development. Traditional representations of RNA second-ary structures, for example (such as linear arc diagrams, cir-cular diagrams and planar graphs), present a single state view of a structural conformation of a nucleic acid, which provide fundamental insights into the cellular function of
both coding and non-coding RNAs [1]. In reality, an RNA molecule transitions among a variety of energy states due to thermodynamic variations in its environment [2]. There-fore, more advanced and accurate visualization approaches are needed to characterize the whole ensemble of second-ary structure conformations for an RNA sequence.
Visualization approaches [3–6] based on predicted RNA secondary structures [7] have been developed to separately address these needs. Single state RNA confor-mations can be depicted with planar graphs, linear arc diagramsand circular diagrams, based on different ways of representing the RNA backbone.
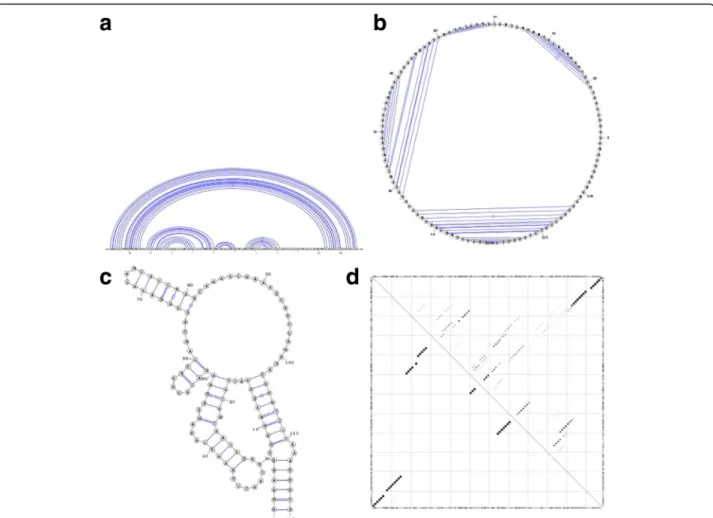
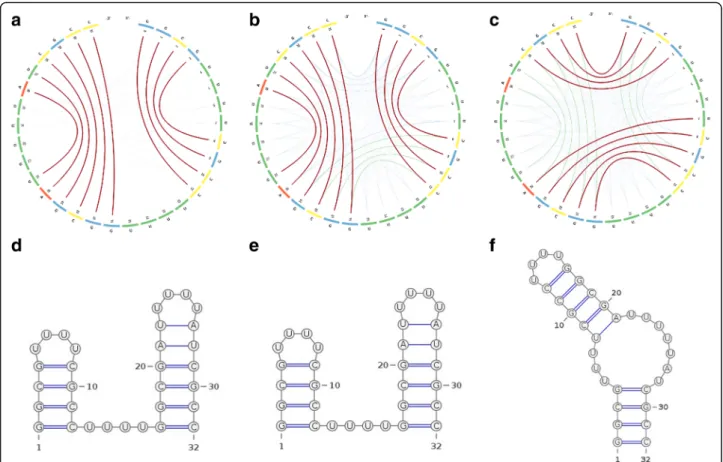
In linear arc diagrams (Fig.1a), the backbone is repre-sented by a straight line. The bases are consecutively placed along the line and paired bases are connected with arcs. To save space and accommodate longer RNA
© The Author(s). 2019 Open Access This article is distributed under the terms of the Creative Commons Attribution 4.0 International License (http://creativecommons.org/licenses/by/4.0/), which permits unrestricted use, distribution, and reproduction in any medium, provided you give appropriate credit to the original author(s) and the source, provide a link to the Creative Commons license, and indicate if changes were made. The Creative Commons Public Domain Dedication waiver (http://creativecommons.org/publicdomain/zero/1.0/) applies to the data made available in this article, unless otherwise stated. * Correspondence:[email protected]
†Serge Léger, Maria Beatriz Walter Costa and Dan Tulpan contributed equally to this work.
1
Department of Animal Biosciences, Centre for Genetic Improvement of Livestock, University of Guelph, Guelph, Ontario, Canada
2Digital Technologies Research Center, National Research Council Canada, 100 des Aboiteaux St, Moncton, NB E1A7R1, Canada
Full list of author information is available at the end of the article
Légeret al. BMC Bioinformatics (2019) 20:293 https://doi.org/10.1186/s12859-019-2902-6
sequences, the backbone can be displayed in a circular format as originally proposed by Nussinov et al. in 1978 [8]. A circular diagram (Fig.1b) will therefore consist of a circular backbone with bases lined up consecutively along the perimeter of the circle, while chords will connect the paired bases. A planar graph (Fig. 1c) is by far the most used visualization method to date, due to its flexibility and simplicity. It represents the backbone as a convoluted pla-nar curve with predefined distances between neighbouring paired bases and a minimum number of overlaps.
Base-pair probabilities are typically represented with dot-plots(Fig.1d)– bi-dimensional graph representations with positions and bases of the sequence being present on both x and y axis and dots being placed at positions where base pairs occur. In this case, the dot sizes are proportional to the base pair probabilities. An extensive presentation of RNA dot-plots and their usage is explored by Churkin and Barash [9]. Other RNA secondary structure alignment and pairwise comparison methods have been published in the past, most notably RNAforester [10], R-chie [5] and BEAGLE [11]. RNAforester calculates RNA secondary
structures alignments using dot-parentheses representa-tions as input and applies a tree alignment model on all sequence secondary structures in a progressive fashion. R-chie focuses on highlighting structure and primary sequence conservation and variation in multiple RNA secondary structures. BEAGLE exploits a new encoding for RNA secondary structure and a substitution matrix of RNA structural elements to perform RNA structural alignments and easily identify structural similarities between RNAs.
In 2013, Aalberts and Jannen [4] introduced the RNAbows diagrams, the first successful attempt to combine two representations of RNA secondary structures with base pair probabilities. It captures both the minimum free energy (MFE) structure and the base pair probabilities into a single image. While their method is versatile and allows for comparison of pairs of RNA secondary structures, their choice of linear arc diagrams places serious constraints on the maximum length of RNA sequences that can be represented (less than 100 bases in a legible format). Moreover, pairwise (bottom-up) comparisons require sequences of equal length that can be horizontally aligned.
Fig. 1 Different representations of an RNA secondary structure. Sub-figure (a) depicts a linear arc diagram, figure (b) a circular diagram, sub-figure (c) a planar graph, and sub-sub-figure (d) a dot-plot diagram for the ancestral ncRNA region of HAR1
Other bioinformatics tools have been recently proposed for visualization or comparison of RNA secondary struc-tures, such as RNA-TVCurve [12] for secondary structure comparisons and TRAVeLer [13] for visualization of struc-tures in the presence of a template. While interesting, they solve different problems and require additional constraints that limit their applicability for both comparison and visualization of RNA secondary structures with base-pair probabilities, such as the need of external structure tem-plates, as is the case of TRAVeLer.
To alleviate these limitations and to propose an alterna-tive tool that is informaalterna-tive and easy to use for biologists, we present the Circular Secondary Structure Base Pairs Probabilities Plot (CS2BP2-Plot) – an intuitive visual
rep-resentation of an RNA secondary structure that includes all possible base pair probabilities. The CS2BP2-Plot uses a chord diagram layout comprised of two concentric graph-ical layers representing (i) the RNA sequence and corre-sponding positions for each base pair (outer layer), and, (ii) the base pair probabilities and MFE base pairings (inner layer).
Results and discussion
We consider five use cases in this study to further show how the CS2BP2-Plot can be successfully used as a
comparative tool to discover important characteristics of RNA molecules and shed light on pertinent biological questions. The applications we show are very diverse and exemplify how our new tool can be used in studies of evo-lution, function and engineering of ncRNAs.
Case study 1: visualization of evolutionary changes in non-coding RNAs
Human accelerated regions (HARs) are sequences in the DNA that have an accumulation of human spe-cific changes [14], which were caused by accelerated rates of nucleotide substitutions in humans, when compared to other vertebrates. Located at the end of chromosome 20 in humans, the HAR1 in particular, shows the highest substitution rate among HARs. The HAR1 is 118 bp long and has 18 substitutions that are specific to the human species. The HAR1 is part of two overlapping long ncRNAs, HAR1F and HAR1R, both of which are expressed very specifically in the brain in a developmental time point that is fundamental for brain formation [14]. Different stud-ies of experimental biology have shown that the 118 bp HAR1 [14–18] folds into a stable secondary struc-ture, which differs between the human species and the other vertebrates. If we consider the structure of
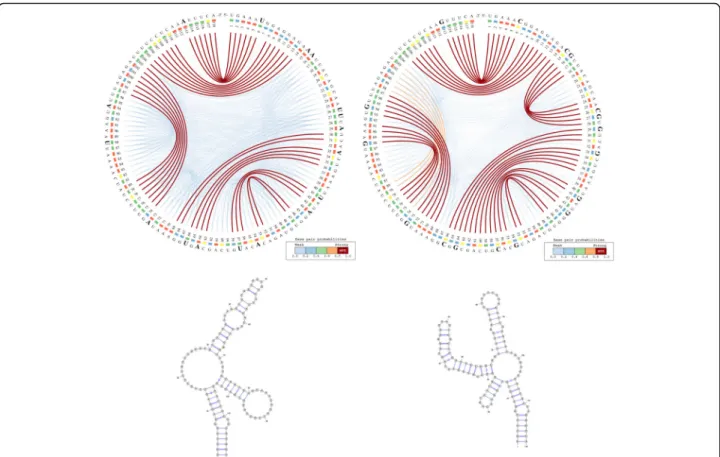
Fig. 2 CS2BP2-Plot (top) and planar graphs (bottom) for ancestral (left) and Denisovan (right) HAR1 secondary structures. The CS2BP2-Plots include sequence differences highlighted in bold. The sequence differences are highlighted after we infer them from a ClustalW pairwise local alignment
non-human species as the ancestral structure, that means that the HAR1 has been kept conserved in non-human species since the last common ancestor and changed only in the human lineage. This is a likely indicator of adaptive evolution acting on the human version of HAR1. To confirm this hypothesis, it is of great importance to compare structures. In this way, we can better understand how the HAR1 evolved in humans. Since the HAR1 is extremely similar in non-human vertebrates, we considered the chimpanzee sequence as a proxy of the ancestral sequence.
We use the CS2BP2-Plot to highlight the major simi-larities and differences among the predicted secondary structures for the ancestral, an archaic human (Deniso-van) and the modern human HAR1. For convenience and comparison purposes, the planar graph representa-tion of each secondary structure is also included.
The information represented in Fig.2can be interpreted based on the predominance and the location of various vis-ual cues related to colour and position. For example, the CS2BP2-Plot of the ancestral HAR1 structure (Fig.2– left
side images) displays two internal sequences with no base pairings between positions 15 and 29 and between positions 81 and 96. By comparison, the corresponding internal se-quence in the Denisovan (Fig. 2 – right side images and
Fig.3– left side images) HAR1 structure contains two solid
4 base-pair stems formed due to 2 base pair mutations at positions 88 and 94 replacing the A and U bases in ances-tral with the more stable Gs in Denisovan.
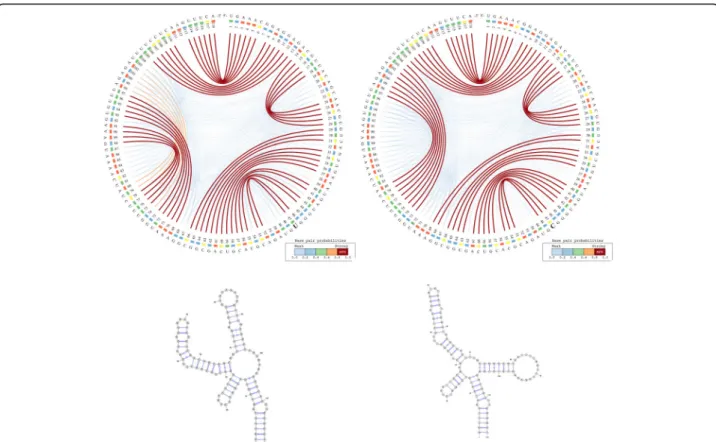
A total of 17 single and consecutive base pair muta-tions (posimuta-tions 6, 15–16, 26–27, 29, 33, 41, 44, 54, 57, 64, 66, 73, 88, 94 and 113) can be identified between the ancestral and the Denisovan HAR1 structures, while only one mutation (U replaced by C) at position 47 occurred between the Denisovan and the modern human structures. The large number of mutations that distinguish the Denisovan from the ancestral sequences was apparently caused not only by the emerging of 2 new 4-base pair stems in Denisovan, but also caused by the breakdown of multiple existing stems in the ances-tral, as well as the creation of new stems in Denisovan. The orange arcs in the Denisovan HAR1 CS2BP2-Plot suggest the existence of a powerful energetic pressure to create a stem between positions 74–80 and 98–103. This stem appears in the human HAR1 structure due to changes in the stem structures between positions 69–78 and 88–97. Importantly, the single mutation that differentiates the sequences of modern and archaic humans caused a stabilization of a stem that reverted back to the ancestral state. This observation is biologic-ally very relevant, since it also corroborates the hypoth-esis that the HAR1 structure adapted in the human
Fig. 3 - CS2BP2-Plot (top) and planar graphs (bottom) for Denisovan (left) and Human (right) HAR1 secondary structures. The CS2BP2-Plots include sequence differences highlighted in bold
lineage towards an increase in stability. This is a novel piece of information that could not be acquired with the visual comparison of the classical dot-plots.
In a previous work on the HAR1 [19], we constructed a model showing that the most likely last step in turning the ancestral state into the modern human state was exactly the substitution at position 47 that distinguishes the modern human sequence from that of the Deniso-van, which provides an independent support for the con-clusions we drew from our visualizations.
We can also notice in the CS2BP2-Plot that the human secondary structure is by far the most stable with a total MFEhuman=− 33.5 Kcal/mol out of all three HAR1
struc-tures (MFEancestral=− 20.0 kcal/mol; MFEDenisovan=− 32.1
Kcal/mol). This is likely due to the emergence of stronger base pairings in the modern human structure (low num-ber of blue arcs), which could have occurred in the human lineage as a result of adaptive pressures.
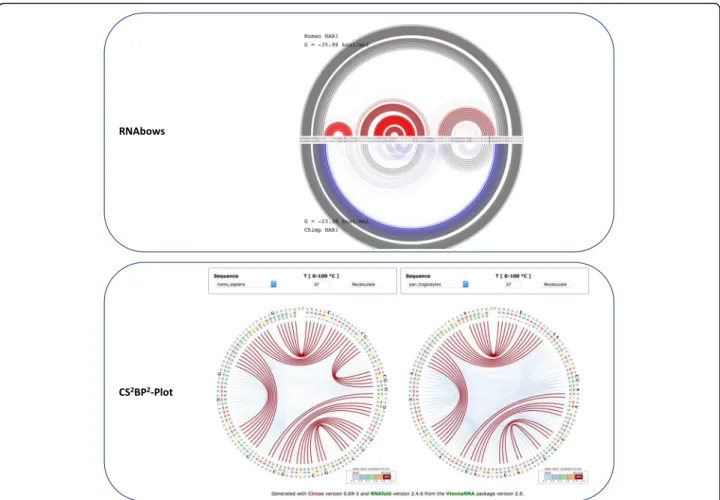
We also use this use case to show how the CS2BP2-Plot representation of human versus ancestral HAR1 ncRNAs compares with the RNAbows representations (Fig.4). The stem structure differences between the two secondary
structures of human and ancestral are explained in detail above and are much easier to identify when using the CS2BP2-Plot versus the RNAbows representation.
Case study 2: visualization of energetic transitions between RNA secondary structures
The RNA folding process leading to a native fold with a minimum free energy is typically perceived as a succession of transitions between intermediate states or conformations that represent local minima in the free energy landscape. While the free energy barrier between two consecutive states of an RNA structure is typically small allowing for smooth and fast transitions, large energy barriers are some-times encountered. These barriers act as folding traps and slow down the folding process, leading to bi-stable RNA structure. The first bi-stable RNA structure had around 150 bp in length and represented a ribozyme, which was re-ported in 2000 [20]. Since then, other studies proposed shorter RNA sequences (20–40 bp) with computationally proven bi-stable secondary structures [21,22]. Nevertheless their experimental validation, based on UV-melting and gel assays, was not possible at the time due to their significantly
Fig. 4 The RNAbows (top) and CS2BP2-Plots (bottom) representations for the human and ancestral HAR1 secondary structures. The RNAbows arc
diagram was obtained using the diffRNABow functionality available athttp://rna.williams.edu/rnabows/using the Vienna-2.0.2 folding method. The CS2BP2-Plots were obtained using the default parameter settings available athttps://nrcmonsrv01.nrc.ca/cs2bp2plot/
fast timescale folding process. In 2003, Hobartner and Micura [23] successfully used 1H NMR spectroscopy to study a series of bi-stable RNAs of 18–20 bp in length, each RNA comprising of two competing stem-loop motifs.
The CS2BP2-Plot can be used to visualize the energetic transitions between two stable secondary structures of the RNA sequence 4 proposed by Hobartner and Micura [23]. Images (a) and (d) in Fig. 5 depict the secondary structure formed at 25 °C with an MFE =− 17.85 Kcal/ mol. The two stems formed at positions 0–3/8–11 and 16–21/26–31 are in agreement with the reported 85– 15 equilibrium by imino proton NMR spectroscopy. We can also notice that virtually no competing base pairs (no green or orange arcs) exist at this temperature. When the temperature is increased to 70 °C (images (b) and (e) in Fig. 5), two competing stems depicted by green arcs appear at positions 0–3/28–31 and 7–11/16–20 and the MFE of the secondary structure de-creases to − 4.06 Kcal/mol. With further increase in temperature, the new stems will break the existing ones, thus forming a new secondary structure for the RNA sequence 4. Images (c) and (f ) in Fig. 5 depict the second stable conformation of the RNA structure formed at 75 °C with MFE =− 2.63 Kcal/mol, which is
supported by the UV-melting analysis reported in Hobartner and Micura [23].
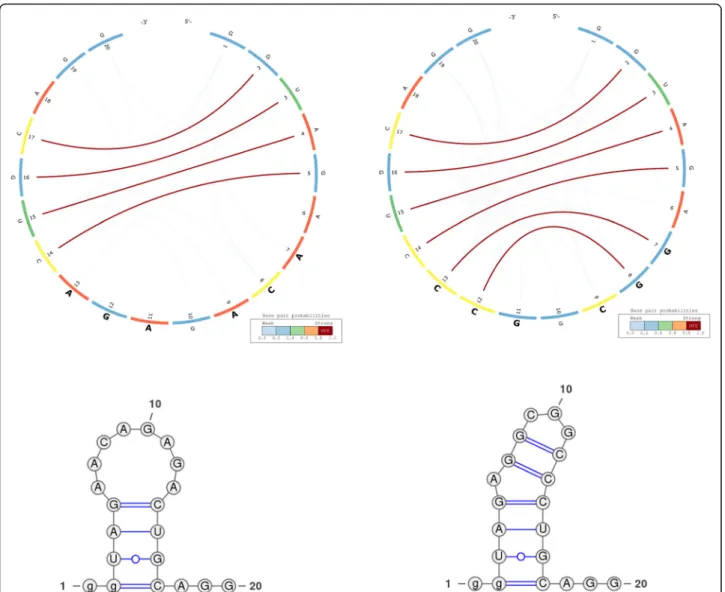
Case study 3: gRNAs for CRISPR/Cas systems
Guide RNAs (gRNAs) are typically used in CRISPR/Cas systems to direct sequence-specific DNA cleavage at desired locations along the target sequence. Nevertheless, gRNAs have a wide spectrum of cleavage effectivity. While there is a large amount of active research in the field, the mechanisms and factors governing their activities are still poorly understood.
Thyme et al., 2016 [24] suggest that there are two po-tential mechanisms that decrease gRNA performance: (i) weak gRNA sequence content that do not form active Cas9-gRNA complexes, and (ii) gRNAs with in vivo re-fractory target sites.
Here, we use CS2BP2-Plot to: (i) provide a visual inter-pretation that supports the hypothesis that gRNA second-ary structure plays a significant role in the modulation of Cas9 cleavage efficiency, and (ii) suggest a third potential mechanism that might contribute to better gRNA per-formance, which is the need to design gRNAs with min-imal self-folding structures.
Fig. 5 The CS2BP2-Plots (top) and planar graphs (bottom) for secondary structures of a small bi-stable RNA. Sub-figures (a) and (d) describe the secondary structure conformations at 25 °C. Sub-figures (b) and (e) depict the secondary structure conformations at 70 °C and sub-figures (c) and (f) depict the secondary structure conformations at 75 °C
Figure6depicts the predicted secondary structures of an active (left) and an inactive (right) gRNA sequence from Thyme et al. (2016). The inactive gRNA has a significantly more stable secondary structure (MFE =− 4.40 kcal/mol) compared to the active gRNA (MFE =− 2.6 kcal/mol). This suggests that strong hairpin formation hampers the ability of gRNAs to interact with the desired target, an effect that can be observed on all gRNA sequences and their mutated variants from Thyme et al. (2016).
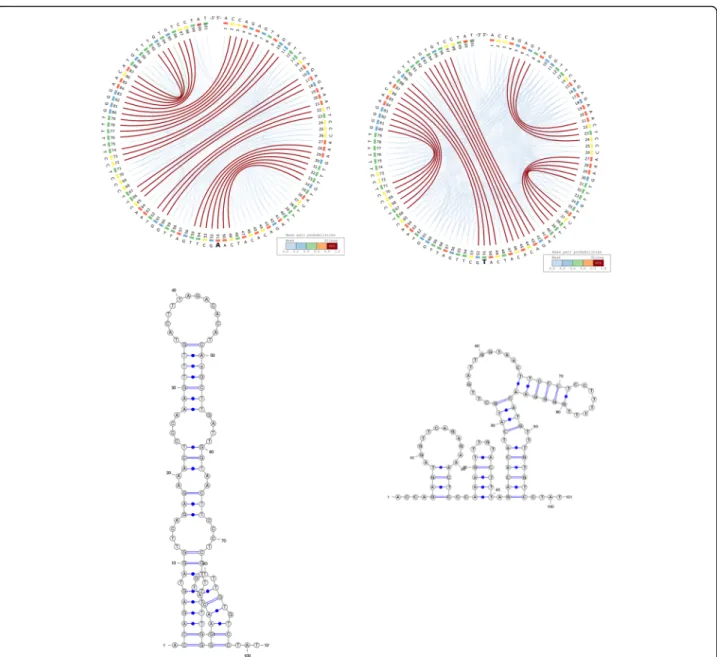
Case study 4: RiboSNitches
A RiboSNitch is a regulatory RNA in which a specific Single Nucleotide Polymorphism (SNP) has a structural consequence that results in a local or global conform-ational change in the secondary structure, which could lead to a disease phenotype.
Unlike a riboswitch, a RiboSNitch results in a perman-ent change in regulation and can thus lead to disease phenotypes. RiboSNitches represent a novel diagnose and therapeutic target, since small molecules can repar-tition the RNA structural ensemble [25].
Here we use CS2BP2-Plots to computationally validate and visualize one of the riboSNitches presented by Cor-ley et al. [26], which represents a sequence flanking an SNV in the 3′ untranslated region of the activated RNA polymerase II transcriptional co-activator p15 (SUB1). A single base mutation at position 51 has a major effect not only on the MFE structure, but also on the entire structural landscape of the RNA secondary structure as depicted in Fig. 7, which can be more clearly visualized with our new representation. In a similar manner, the CS2BP2-Plot could be used to investigate other putative RiboSNitches, providing valuable and intuitive visual
Fig. 6 Active (left) and inactive (right) gRNAs from Thyme et al., 2016. The secondary structures of the gRNAs include a pair of non-canonical base pairs (G-U) at positions 3–16
clues about the impact of SNPs on the entire landscape of the structure.
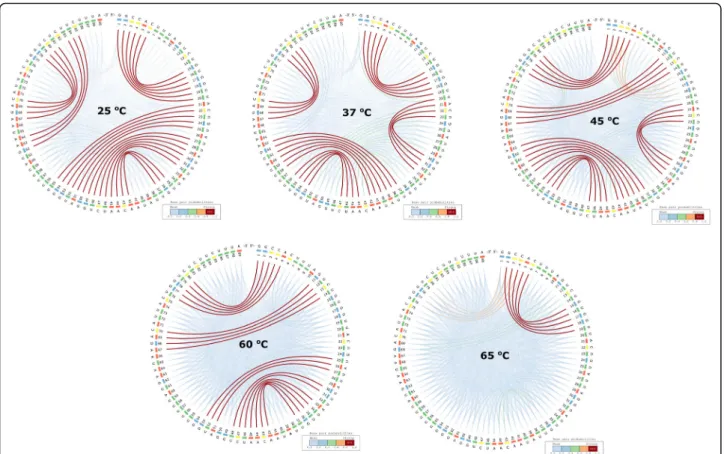
Case study 5: RNA thermometers
The RNA world is very diverse and their role in living or-ganisms spans a large spectrum. Some RNAs are able to control gene expression in a temperature-dependent man-ner and are called “RNA thermometers”, such as those identified in the structurome of Yersinia pseudotuberculo-sis[27]. Righetti et al. (2016) identified two candidate viru-lence factors for this pathogen: ailA (attachment invasion locus protein) and cnfY (cytotoxic necrotizing factor). They reported the genome-scale landscape of RNA struc-tures of the human pathogen Y. pseudotuberculosis at
three physiologically relevant temperatures reflecting en-vironmental (25 °C), host body (37 °C), and heat shock (42 °C) conditions at single-nucleotide resolution.
The CS2BP2-Plots and planar graph secondary structure representations from Fig. 8 are in agreement with the findings of Righetti et al. (2016), suggesting that the ex-pression of virulence-relevant functions in Y. pseudotuber-culosisand reprogramming of its metabolism in response to temperature is associated with a restructuring of some of its RNAs. We also performed in-silico experiments for higher temperatures (60 °C and 65 °C) and we observed a changing structural landscape for ailA by losing existing stems while forming new ones, which could qualify this molecule as a 5-phase riboswitch. Although experimental
Fig. 7 The CS2BP2-Plots and planar graph diagrams of the sequence flanking an SNV in the 3’UTR of SUB1. The activated RNA polymerase II transcriptional co-activator p15 or SUB1 homolog was previously identified as a riboSNitch by Corley et al. [24]
evidence is needed to further confirm these observations, our plots allow for a straightforward comparison of the landscape change when the temperature varies.
Conclusions
Our results demonstrate that a single image consisting of circular diagrams combined with color and weight-coded arcs (the CS2BP2-Plot) can efficiently represent both the minimum free energy secondary structure and the base pair probabilities for an RNA structure. The CS2BP2-Plot significantly simplifies the interpretation, analyses and comparisons of RNA secondary structures, thereby making evolutionary and energetic transition re-sults more easily understandable.
Methods
The CS2BP2-Plot currently use Circos [28] as a graphical library and Go Language (https://golang.org/) scripts to prepare the input files for Circos. Nevertheless, other more versatile approaches could be considered in the fu-ture, such as the JavaScript D3 library, for enhanced inter-activity and user experience. Our current input consists of up to 10 RNA sequences in FASTA format. In addition the RNA sequences were computationally folded with the
aid of RNAfold from the ViennaRNA Package [6] version 2.0 at different temperatures. Nevertheless other RNA folding algorithms can also be used, such as Mfold [29], RNAsoft [30] and RNAstructure [31]. Default RNAfold parameters (−-partfunc = 1, −-temp = 37, −-dangles = 2) were used, with the exception of the bi-stable RNA sec-ondary structures calculated at non-standard tempera-tures (25oC, 70oC and 75oC).
Linear arc diagrams and planar graphs were gener-ated with VARNA [3] version 3–93 using corresponding
parameter settings (−algorithm line, −algorithm circu-lar), while dot-plots were calculated with RNAfold version 2.4.6.
The circular secondary structure base pair probabilities plot (CS2BP2-plot)
The CS2BP2-Plot challenges the classical ways of represent-ing RNA secondary structures and combines base pairrepresent-ings with dot-plot values in a single graphical representation (Fig. 9) capable of assisting biologists in quickly spotting similarities and differences among a large number of sec-ondary structures and their corresponding RNA sequences.
The use of a circular diagram instead of a linear one is justified by the equivalent ofπ times savings in horizontal
Fig. 8 CS2BP2-Plots for ailA putative virulent factor in Yersinia pseudotuberculosis at five different temperatures. The ailA putative virulent factor from Y. pseudotuberculosis shows significantly different layouts of their secondary structures at 5 different temperatures: 25 °C, 37 °C, 45 °C, 60 °C and 65 °C
spread, whereπ (3.14 …) equals the circle length (i.e. the length of the RNA sequence) divided by the circle diam-eter (i.e. the width of the graphical representation).
The outer layer (the RNA sequence) consists of 4 types of equally spaced blocks colored and labeled corre-sponding to each base (A, C, G and U).
The inner layer consists of a set of colored arcs that con-nect base pairs on the RNA sequence showing hydrogen bonds depicted by short segments in a typical linear graph RNA secondary structure representation. The arc colours, currently using a 5-color palette assigned values within 0.2 unit intervals spanning the interval [0,1], are assigned based on the corresponding base pair probabilities, ranging from blue (less stable) to dark orange (more stable) with green representing base pairs with medium energetic stability. The thickness of each arc is also proportional with the un-certainty probabilities using 5 incremental sizes ranging from 1 (less stable) to 9 (more stable). The dark red arcs represent the MFE base pairing corresponding to the most stable interactions. Each plot includes a legend summariz-ing the probabilistic range significance for each color.
Originally implemented in Perl and currently con-verted to the Go programming language and using Circos version 0.69–3 [28] as graphical library, the CS2BP2-Plot can be applied to represent and compare secondary structures of various types of RNAs, such as small (< 200 bp) non-coding (ncRNAs) and bi-stable small RNAs.
The CS2BP2-plot web server
We provide a web server implementation that allows pairwise comparison of two predicted RNA secondary structures. As depicted in Fig.10, the web server accepts as input up to 10 RNA sequences, each no longer than 200 bases and uses RNAfold version 2.4.6 from the Vien-naRNA package version 2.0 [6] to predict their second-ary structures and corresponding base pair probabilities. The user can adjust the temperature and 5 other parame-ters such as the linearity of the RNA molecule (linear or cir-cular), G-quadruplex formation incorporation, forbidden lonely pairs, and forbidden GU pairs along the whole se-quence or at the ends of helices.
Fig. 9 The planar graph, dot plot and CS2BP2-Plot of the nucleotide sequence of wheat-embryo cytosol 5.8S ribosomal RNA. The CS2BP2-Plot
includes information typically included in two separate graphical representations (a planar graph for the minimum free energy base pairing configuration and a dot-plot for base pair probabilities)
Once the secondary structures and base pair probabil-ities are calculated for all sequences, two sequences are selected for visualization and their corresponding CS2BP2-Plots are generated using Circos version 0.69–3 [28] and a customized template design that allows for highlighting of base pair differences between two se-quences based on a local alignment performed using ClustalW version 2.1. This provides a significant advan-tage over other secondary structure comparative tools such as diffRNABow [4], which work only for two se-quences of the same length. In addition to this, we use VARNA version 3–93 to generate the corresponding traditional planar graph, arc and circular diagram plots for the convenience of the users that are more accus-tomed with this type of visualization.
The webserver also provides information regarding the sequence length and base content (single bases, AT/AU and GC), the MFE of the predicted structure, the number of MFE base pairs, the number of similar and different base pairs between the two sequences, and the dot-bracket rep-resentation of the MFE secondary structure. The informa-tion is structured so that each secinforma-tion can be expanded or contracted allowing the user to focus on the relevant sec-tions. In addition, all the information generated by the web-server is downloadable as a ZIP archive.
Acknowledgements
We thank the editorial team and anonymous reviewers for excellent comments and suggestions.
Funding
The work was supported by the University of Guelph (Food from Thought Initiative) and National Research Council of Canada.
Availability of data and materials
The authors provide free access to the web server that implements the new visualization approach presented in the manuscript:https://nrcmonsrv01.nrc. ca/cs2bp2plot
Authors’ contributions
DT and MBWC edited the paper. SL implemented the web server application. DT identified and developed the use cases. All authors read and approved the final manuscript.
Ethics approval and consent to participate Not applicable.
Consent for publication Not applicable. Competing interests
The authors declare that they have no competing interests.
Publisher’s Note
Springer Nature remains neutral with regard to jurisdictional claims in published maps and institutional affiliations.
Author details
1
Department of Animal Biosciences, Centre for Genetic Improvement of Livestock, University of Guelph, Guelph, Ontario, Canada.2Digital Technologies Research Center, National Research Council Canada, 100 des Aboiteaux St, Moncton, NB E1A7R1, Canada.3School of Computer Science, University of Guelph, Guelph, Ontario, Canada.4Department of Computer Science, TFome Research Group, Bioinformatics Group, Interdisciplinary Center of Bioinformatics, University of Leipzig, Härtelstrasse 16-18, D-04107 Leipzig, Germany.
Fig. 10 CS2BP2-Plot web server functionality flowchart. The web-server pipeline that implements and automatically generates the CS2BP2-Plots is
depicted here. All data files (input and output) are depicted as round boxes, while the software used to process the files are described with rectangles
Received: 6 February 2019 Accepted: 14 May 2019
References
1. Mortimer SA, Kidwell MA, Doudna JA. Insights into RNA structure and function from genome-wide studies. Nat Rev Genet. 2014;15:469–79.
https://doi.org/10.1038/nrg3681.
2. Cruz JA, Westhof E. The dynamic landscapes of RNA architecture. Cell. 2009; 136:604–9.https://doi.org/10.1016/j.cell.2009.02.003.
3. Darty K, Denise A, Ponty Y. VARNA: interactive drawing and editing of the RNA secondary structure. Bioinformatics. 2009;25:1974–5.https://doi.org/10. 1093/bioinformatics/btp250.
4. Aalberts DP, Jannen WK. Visualizing RNA base-pairing probabilities with RNAbow diagrams. RNA. 2013;19:475–8.https://doi.org/10.1261/rna.033365.112. 5. Lai D, Proctor JR, Zhu JYA, Meyer IM. R-CHIE: a web server and R package
for visualizing RNA secondary structures. Nucleic Acids Res. 2012;40:e95.
https://doi.org/10.1093/nar/gks241.
6. Lorenz R, Bernhart SH, Höner Zu Siederdissen C, Tafer H, Flamm C, Stadler PF, et al. ViennaRNA Package 2.0. Algorithms Mol Biol. 2011;6:26.https://doi. org/10.1186/1748-7188-6-26.
7. Seetin MG, Mathews DH. RNA structure prediction: an overview of methods. Methods Mol Biol. 2012;905:99–122.https://doi.org/10.1007/978-1-61779-949-5_8. 8. Nussinov R, Pieczenik G, Griggs JR, Kleitman DJ. Algorithms for loop
matchings. SIAM J Appl Math. 1978;35:68–82.https://doi.org/10.1137/ 0135006.
9. Churkin A, Barash D. RNA dot plots: an image representation for RNA secondary structure analysis and manipulations. Wiley Interdiscip Rev RNA. 2013;4:205–16.https://doi.org/10.1002/wrna.1154.
10. Höchsmann M, Töller T, Giegerich R, Kurtz S. Local similarity in RNA secondary structures. Proceedings IEEE Comput Soc Bioinforma Conf. 2003;2:159–68
http://www.ncbi.nlm.nih.gov/pubmed/16452790. Accessed 11 Apr 2019. 11. Mattei E, Pietrosanto M, Ferrè F, Helmer-Citterich M. Web-Beagle: a web
server for the alignment of RNA secondary structures. Nucleic Acids Res. 2015;43:W493–7.https://doi.org/10.1093/nar/gkv489.
12. Li Y, Shi X, Liang Y, Xie J, Zhang Y, Ma Q. RNA-TVcurve: a web server for RNA secondary structure comparison based on a multi-scale similarity of its triple vector curve representation. BMC Bioinformatics. 2017;18:51.https:// doi.org/10.1186/s12859-017-1481-7.
13. Elias R, Hoksza D. TRAVeLer: a tool for template-based RNA secondary structure visualization. BMC Bioinformatics. 2017;18:487.https://doi.org/10. 1186/s12859-017-1885-4.
14. Pollard KS, Salama SR, Lambert N, Lambot M-A, Coppens S, Pedersen JS, et al. An RNA gene expressed during cortical development evolved rapidly in humans. Nature. 2006;443:167–72.https://doi.org/10.1038/ nature05113.
15. Ziegeler M, Cevec M, Richter C, Schwalbe H. NMR studies of HAR1 RNA secondary structures reveal conformational dynamics in the human RNA. Chembiochem. 2012;13:2100–12.https://doi.org/10.1002/cbic.201200401. 16. Prabhakar S, Visel A, Akiyama JA, Shoukry M, Lewis KD, Holt A, et al.
Human-specific gain of function in a developmental enhancer. Science. 2008;321: 1346–50.https://doi.org/10.1126/science.1159974.
17. Beniaminov A, Westhof E, Krol A. Distinctive structures between chimpanzee and human in a brain noncoding RNA. RNA. 2008;14:1270–5.
https://doi.org/10.1261/rna.1054608.
18. Burbano HA, Green RE, Maricic T, Lalueza-Fox C, de la Rasilla M, Rosas A, et al. Analysis of human accelerated DNA regions using archaic hominin genomes. PLoS One. 2012;7:e32877.https://doi.org/10.1371/journal.pone. 0032877.
19. Walter Costa MB, Höner zu Siederdissen C, Tulpan D, Stadler PF, Nowick K. Temporal ordering of substitutions in RNA evolution: uncovering the structural evolution of the human accelerated region 1. J Theor Biol. 2018; 438:143–50.
20. Schultes EA, Bartel DP. One sequence, two ribozymes: implications for the emergence of new ribozyme folds. Science. 2000;289:448–452.
http://www.ncbi.nlm.nih.gov/pubmed/10903205. Accessed 8 Jan 2016. 21. Flamm C, Hofacker IL, Maurer-Stroh S, Stadler PF, Zehl M. Design of
multistable RNA molecules. RNA. 2001;7:254–65http://www.pubmedcentral. nih.gov/articlerender.fcgi?artid=1370083&tool=pmcentrez&rendertype= abstract. Accessed 8 Jan 2016.
22. Tøstesen E, Chen S-J, Dill KA. RNA folding transitions and cooperativity. J Phys Chem B. 2001;105:1618–30.https://doi.org/10.1021/jp002877q.
23. Höbartner C, Micura R. Bistable secondary structures of small RNAs and their structural probing by comparative Imino proton NMR spectroscopy. J Mol Biol. 2003;325:421–31.https://doi.org/10.1016/S0022-2836(02)01243-3. 24. Thyme SB, Akhmetova L, Montague TG, Valen E, Schier AF. Internal guide
RNA interactions interfere with Cas9-mediated cleavage. Nat Commun. 2016;7:11750.https://doi.org/10.1038/ncomms11750.
25. Halvorsen M, Martin JS, Broadaway S, Laederach A. Disease-associated mutations that Alter the RNA structural ensemble. PLoS Genet. 2010;6: e1001074.https://doi.org/10.1371/journal.pgen.1001074.
26. Corley M, Solem A, Qu K, Chang HY, Laederach A. Detecting riboSNitches with RNA folding algorithms: a genome-wide benchmark. Nucleic Acids Res. 2015;43:1859–68.https://doi.org/10.1093/nar/gkv010.
27. Righetti F, Nuss AM, Twittenhoff C, Beele S, Urban K, Will S, et al. Temperature-responsive in vitro RNA structurome of Yersinia
pseudotuberculosis. Proc Natl Acad Sci U S A. 2016;113:7237–42.https://doi. org/10.1073/pnas.1523004113.
28. Krzywinski M, Schein J, Birol I, Connors J, Gascoyne R, Horsman D, et al. Circos: an information aesthetic for comparative genomics. Genome Res. 2009;19:1639–45.https://doi.org/10.1101/gr.092759.109.
29. Zuker M. Mfold web server for nucleic acid folding and hybridization prediction. Nucleic Acids Res. 2003;31:3406–15.https://doi.org/10.1093/ nar/gkg595.
30. Andronescu M, Aguirre-Hernández R, Condon A, Hoos HH. RNAsoft: a suite of RNA secondary structure prediction and design software tools. Nucleic Acids Res. 2003;31:3416–22.https://doi.org/10.1093/nar/gkg612.
31. Reuter JS, Mathews DH. RNAstructure: software for RNA secondary structure prediction and analysis. BMC Bioinformatics. 2010;11:129.https://doi.org/10. 1186/1471-2105-11-129.