HAL Id: hal-01565681
https://hal.inria.fr/hal-01565681
Submitted on 20 Jul 2017HAL is a multi-disciplinary open access archive for the deposit and dissemination of sci-entific research documents, whether they are pub-lished or not. The documents may come from teaching and research institutions in France or abroad, or from public or private research centers.
L’archive ouverte pluridisciplinaire HAL, est destinée au dépôt et à la diffusion de documents scientifiques de niveau recherche, publiés ou non, émanant des établissements d’enseignement et de recherche français ou étrangers, des laboratoires publics ou privés.
Distributed under a Creative Commons Attribution - ShareAlike| 4.0 International License
Genetic determinism of flowering regularity over years
in an apple multi-family population
Jean-Baptiste Durand, Alix Allard, Baptiste Guitton, Eric van de Weg, Marco
C. A. M. Bink, Evelyne Costes
To cite this version:
Jean-Baptiste Durand, Alix Allard, Baptiste Guitton, Eric van de Weg, Marco C. A. M. Bink, et al.. Genetic determinism of flowering regularity over years in an apple multi-family population. Interna-tional Symposium on Flowering, Fruit Set and Alternate Bearing, Jun 2017, Palermo, Italy. pp.15-22, �10.17660/ActaHortic.2018.1229.3�. �hal-01565681�
Genetic determinism of flowering regularity over
years in an apple multi-family population
J.B. Durand1,2†, A. Allard3†, B. Guitton3, E. van de Weg4, M.C.A.M Bink5,6 and E. Costes3a † First co-authorship
1Univ. Grenoble Alpes, CNRS, Inria, Grenoble INP*, LJK, 38000 Grenoble, France
* Institute of Engineering Univ. Grenoble Alpes, France; 2CIRAD/Inria, Virtual Plants
Team, UMR AGAP, Montpellier, France; 3INRA, UMR AGAP, Equipe Architecture et
Fonctionnement des Espèces Fruitières, Montpellier, France;
4UR Plant Breeding, Wageningen University and Research Centre, Netherlands; 5Biometris, Wageningen University and Research Centre, Netherlands; 6 Research &
Technology Centre, Hendrix Genetics, Boxmeer, Netherlands
Abstract
Irregular flowering over years is commonly observed in fruit trees and is assumed to be, at least partly, under genetic control. This study aimed at predicting genotype flowering behaviours and at detecting QTL associated to regularity, in a multi-family apple tree population. Successions of vegetative and floral annual shoots (AS) were observed along axes in trees belonging to five apple related full-sib families, observed at two experimental sites. Sequences were analysed using Markovian and linear mixed models including year and site effects. Indices of flowering regularity, periodicity and synchronicity were estimated, at tree and axis scales. First indices were derived from the Biennial Bearing Index (BBI). A second index was the auto-regressive correlation coefficient between flowering in consecutive years. A third index quantified the synchronicity of meristems within the trees through the measure of differences in the predictability of flowering over years, from a probabilistic viewpoint. These three types of indices were used to predict tree behaviour and to detect QTL with a Bayesian pedigree-based analysis, using an integrated genetic map containing 6,849 SNPs. The combination of the three indices efficiently predicted and classified the genotype behaviours despite few miss-classifications. Four common QTLs for BBIs and auto-regressive coefficient were highlighted (on LG4, 5, 8 and 10) and one for synchronicity (on LG9) in the integrated multi-family map, thus revealing the complex genetic architecture of the considered traits. This study proposes a posteriori sampling of axes within trees as a relevant and time-saving method to estimate tree flowering behaviours. Coupled to appropriate statistical indices, it is efficient to evaluate the tree breeding values for flowering regularity. In apple tree, biennial bearing appeared to result from high AS synchronism in flowering, i.e. with all axes alternatively flowering or not in a given year, whereas regularity resulted from either asynchronous alternating or regular flowering of AS.
Key words: Floral induction, Biennial bearing, Entropy, Malus x domestica, Markov
models, Pedigree based analysis, Bayes factor
INTRODUCTION
Biennial bearing is defined as irregular fruit or seed production over consecutive years. This trait is commonly observed in perennial crops (Monselise & Goldschmidt, 1982, Samach & Smith, 2013). In fruit trees, yield and fruit quality depend on bearing behaviour, which is in turn strongly dependent on flowering intensity.
a E-mail: evelyne.costes@inra.fr
Management techniques are usually required for controlling biennial bearing in fruit production. An alternative strategy would be to select cultivars combining high fruit quality, long-term resistance to pests and diseases, tree architecture adapted to modern training systems and regular production. Predicting bearing habit as soon as possible from the beginning of the genotype production is thus of high interest, since breeding programmes are particularly long for trees. This strategy is reinforced by the existence of large differences in bearing behaviour among cultivars (Lauri et al., 1997) and of genetic control of biennial bearing (Guitton et al., 2012, Durand et al., 2013).
The Biennial Bearing Index (BBI), which estimates the intensity of deviation in yields during successive years (Wilcox, 1944), has become the accepted standard to describe biennial bearing. However, the measure of the magnitude of irregular bearing by BBI is questionable, especially for trended series (Huff, 2001). A new methodology was thus introduced to characterize the bearing habit of trees as early as the first years of production, when the production is increasing. This methodology was based on a trend model on the yearly number of flowers, combined with a BBI-derived index and an index based on correlations between residuals, denoted . An entropy criterion was proposed to assess synchronicity of flowering in a given year, allowing a connection to be drawn between axis- and tree-scale behaviours. However, the ability of axis-scale indices to predict genotype habits at tree scale was investigated on a single family and the annual shoot sequences were merely used to approximate the total number of flowering AS.
In the present study, we extended previous investigations by further exploring the sequences of flowering shoots and by performing a multi-family QTL detection to enlarge the genetic basis of biennial bearing variation in apple trees. We assumed that the analysis of entire sequences of successive AS, combined to flowering synchronicity in each year, would provide new insights on the genotype behaviours. We thus proposed to use not only the total number of flowering AS, but also the vegetative ones and their succession and to re-examine previous assumptions on the relation between alternation and regularity at tree and axis scales. Regarding genetics, we considered a larger germplasm to allow the comparison of alleles’ performance in different genetic backgrounds (Pauly et al., 2012). We assumed that this would increase the number of segregating QTLs, detection power, accuracy of positions, and give more robust estimation of QTL effects (Bink et al., 2002). Our aim was to confirm previously found QTLs on the SG family and find new ones, deepening our understanding of the genetic determinisms of biennial bearing in apple tree.
MATERIAL AND METHODS
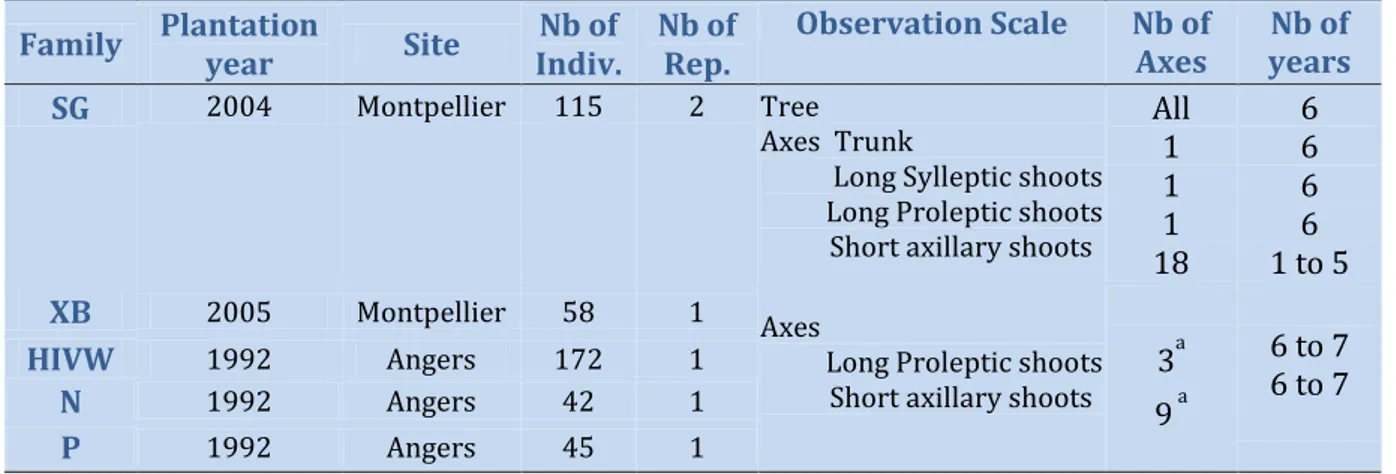
Five segregating families with known and related pedigrees were used (See Allard et al., 2016 for family and pedigree description). The first family (SG) is derived from a cross between ‘Starkrimson’Starkrimson® Red Delicious’ (biennial bearer) and ‘Granny Smith’ (regular). It was composed of 115 genotypes, each replicated twice (Table 1). In the second family (XB) derived from a cross between the hybrid X3263 (regular) and ‘Belrène’ (biennial), 58 genotypes were considered. These families were planted in 2004 and 2005, respectively, at the Diascope INRA Montpellier experimental unit. The three other families were chosen for their related pedigree. The HIVW family had a parent (X3263) common to the XB family and the other one (X3259) to the N family. Both N and P families had a common parent (X3305) and these last three families derived from ‘Golden Delicious’. They were composed of 171, 42 and 45 individuals, respectively, each with a single replicate. They were planted at the INRA Angers experimental station. The trees were trained in vertical axis with an annual manual thinning that was performed at the end of June, and left one fruit per inflorescence. At both sites, pest and disease management was performed consistently with professional practices. On each individual tree, successions of vegetative vs. floral AS were observed over consecutive years (based on the presence/absence of an inflorescence) along different types of axes, classified depending on their length (Table 1).
Table 1. Information on the five families used and sampling strategy.
Family Plantation year Site Indiv.Nb of Nb ofRep. Observation Scale Nb of Axes yearsNb of SG 2004 Montpellier 115 2 Tree
Axes Trunk
Long Sylleptic shoots Long Proleptic shoots Short axillary shoots
All 1 1 1 18 6 6 6 6 1 to 5 XB 2005 Montpellier 58 1 Axes
Long Proleptic shoots Short axillary shoots 3
a 9 a 6 to 7 6 to 7 HIVW 1992 Angers 172 1 N 1992 Angers 42 1 P 1992 Angers 45 1 a: on average
Statistical analysis was based on indices defined in Durand et al. (2013): a BBI-derived index denoted BBI_res_norm, an autoregressive coefficient denoted g and
entropy, denotedEntg. They are based on counts of flowering AS at axis and whole-tree
scales, whenever possible. The description of the trend and autoregressive models, BBI-derived indices and the statistical methodology for classification of genotype habit can be found in Durand et al. (2013 and 2017). The indices at axis scale, denoted by BBI_res_norm_ax, and ax, were computed as those defined at tree scale but using the
total yearly counts of flowering AS in axes sampled within each tree replicate. These counts were also used to compute two entropies, denoted Entg (entropy based on
frequencies) and Entglmm,g (entropy based on a generalized linear mixed model - GLMM).
We assumed that the true class of each genotype (regular, irregular or biennial) could be deduced from the tree-scale indices for the SG family, using a clustering method developed in Durand et al. (2013). The classification of the genotypes of all families from axis-scale indices was achieved using as predictors BBI_res_norm_ax,ax,
g Ent and g
glmm
Ent , , which were available for every genotype, as opposed to whole tree-scale
predictors. Note however that some predictors could be missing for some genotypes, or highly correlated and redundant. To handle both issues, a principal component analysis (PCA) for partially missing data was used, with the R package missMDA (Josse & Husson, 2012). Classification was performed using neural networks. The number of principal components (PCs) and the NN regularisation parameter were determined by out-of-sample validation. Because classification prediction provides a rough summary (through three classes only) of the flowering behaviour, quantitative assessment of the bearing behaviour was achieved through the tree-scale indices BBI_res_norm and g(when
measured). Since these indices were known for SG only, approximation was performed by regression, using axis-scale indices BBI_res_norm_ax, ax,
g
Ent andEntglmm,gas
predictors. NNs were used as nonlinear regression functions, also using missing data PCA. The NN parameters were estimated by least squares minimization. Since the optimal numbers of PCs to be used in classification and regression NNs may be different, they were both chosen independently by out-of-sample validation. The approximated values of BBI_res_norm andg are referred to as BBI_res_norm_pred and
pred
,
The five full-sib families and their progenitors were genotyped with the Infinium® 20K SNP array (Bianco et al., 2014). A genetic map composed of 7,100 SNPs was integrated over 27 full-sib families (Di Pierro et al. 2016) and used for QTL mapping. 6,849 SNPs were used after careful checking of their robustness (Van de Weg et al., 2013; Di Guardo et al., 2015), consistency and recombination pattern on the 5 families and the pedigree members (Allard et al., 2016). Then sets of single SNPs were integrated into haploblocks, corresponding to successive 1 cM segments. Haplotypes were composed using the software FlexQTLTM and PediHaplotyper (Voorrips et al., 2016).
QTLs were detected using a linear model that comprised an intercept , the regression coefficients a on the QTL covariates, and a residual e, as: yWae (1)
where W is the design matrix for the QTL effects. As QTL genotypes of individuals are a priori unknown, modelling is based on independent assignment of alleles to founders and segregation indicators to trace transmission from parents to offspring (Bink, 2002; Bink et al., 2008). The number of QTLs was assigned a Poisson prior, but results are reported for a prior mean of 5, only. Samples from the joint posterior distribution of the model parameters were obtained by Markov chain Monte Carlo (MCMC) simulation in FlexQTLTM (Bink et al., 2008 and 2014). The number of QTLs was inferred from a pairwise comparison of models differing by one QTL, and considering twice the natural logarithm of the Bayes Factors, denoted 2*lnBF. Values greater than 2, 5 and 10 indicate positive, strong, and decisive evidence for the presence of a QTL, respectively. QTL positions were based on posterior QTL intensities, and QTL contributions on the posterior mean estimates of the QTL effects.
RESULTS
According to BIC values, the best trended model included all fixed (site, memory, year) and the random replication effects (data not shown; see Durand et al., 2017). The trees in Montpellier had lower flowering probability than those in Angers. Flowering AS were more frequent after a vegetative AS preceded by a flowering AS, than directly after a flowering AS, showing frequent biennial alternation in flowering at axis scale. The probability of flowering was the highest in 2008, whereas it was particularly low in 2010 and 2012, whatever the site.
BBI_res_norm and g were regressed with three or four principal components
(PCs) using NNs, and the best cross-validated correlations were obtained with three PCs. The optimal correlation between BBI_res_norm and its prediction BBI_res_norm_pred was 0.71 when using BBI_res_norm_ax, ax and
g
Ent as predictors, and 0.72 when using
the PCs. The optimal correlation between g and pred was 0.60 using BBI_res_norm_ax,
ax
and Entg, and 0.64 using PCs.
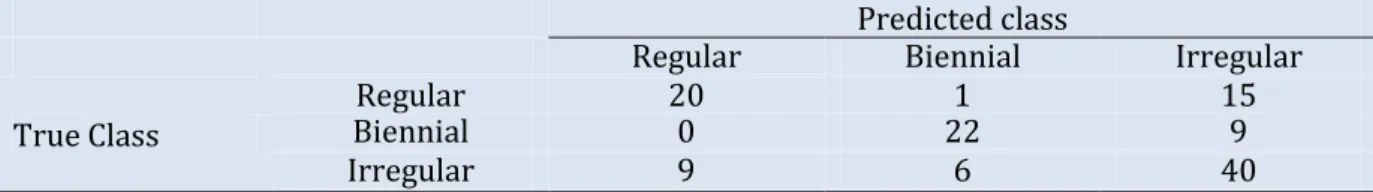
Table 1. Contingency table for the number of genotypes of each possible true class (corresponding to observations on SG family) assigned to each possible predicted class by NN on local indices. For example, among the 36 regular genotypes, 15 were predicted as irregular.
Predicted class
Regular Biennial Irregular
True Class
Regular 20 1 15
Biennial 0 22 9
Irregular 9 6 40
The unknown bearing habits at tree-scale of the genotypes of XB, HIVW, N and P were predicted by using the optimal NN model on SG that was re-estimated on the whole data set, using genotypes with known classes (i.e. 122 genotypes in SG) for learning the mapping between local indices and classes. Confusion between classes concerned irregular genotypes that could hardly be discriminated from regular and biennial bearing genotypes (Table 1). This comes from irregular genotypes having
intermediate values of their indices, between those for the regular and biennial bearing genotypes. As a result, 15 regular and 9 biennial genotypes were classified as irregular, and 9 irregular genotypes were classified as regular. In contrast, one misclassification only occurred between regular and biennial bearing genotypes, highlighting that discrimination between both behaviours is easy.
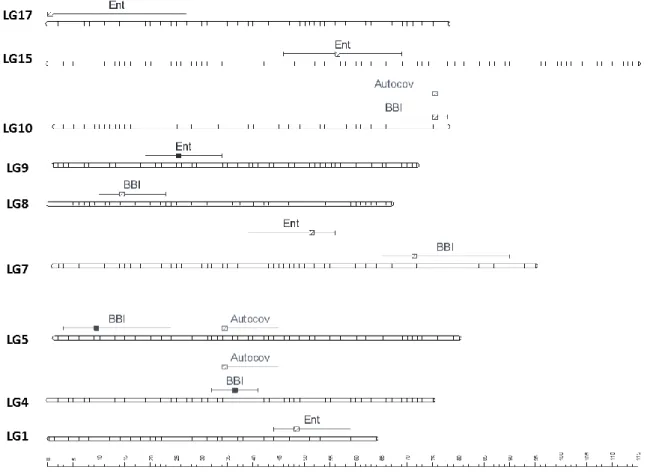
Two major QTLs were detected with a strong evidence (2*lnBF ≥ 5) on LG4 and LG5, for the two BBI-derived indices (BBI_res_norm_ax, BBI_res_norm_pred) (Table 2, Figure 1 A and B). The QTL detected on LG4 explained 11.5, and 13.3% of variance, respectively. The QTL on LG5 explained 6.9, and 8.3% of the variance of each index, respectively (Table 2). Two other QTLs were detected on LG8 and LG10 but had a strong evidence for BBI_res_norm_pred only. They explained 11.7% and 10% of variance of this index, respectively. Two QTLs were detected on LG8 and LG10 but had a strong evidence for BBI_res_norm_pred only. They explained 11.7% and 10% of variance of this index, respectively.
Figure 1. Posterior probability of QTL positions along genome, the beginning and the end of the chromosomes are represented by vertical dashed lines. The variables displayed are (A) BBI_res_norm_ax, (B) BBI_res_norm_pred, (C) ax , (D) pred, (E) ENTg, (F) ENTglmm,g. See text for abbreviation meaning.
For the autoregressive coefficient ax the same regions along the genome were
detected. Three QTLs were detected on LG4, LG 5 and LG 10 (Figure 1C) but none with a strong evidence (Table 1). The QTLs on LG5 and LG10 colocalized with that of the BBI indexes (Figure 1). Four QTLs were mapped for gpred on LG4, LG5, LG8 and LG10 (Figure
1D) and colocalized with BBI_res_norm_pred. QTLs on LG4 and LG8 explained 12%, and those on LG5 and LG10 explained 10% of the variance (Table 1). Five QTLs were detected for Entglmm,g (Figure 1F), among which only that on LG9 had a strong evidence
and explained 20% of the variance. No interaction between QTLs could be identified for BBI_res_norm_ax and ax, whereas interactions were identified for BBI_res_norm_pred
between QTLs on LG4 and LG8, and for Entglmm,gbetween QTLs on LG7, LG9 and LG17,
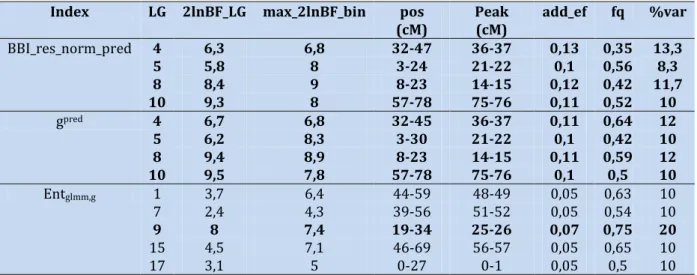
Table 2 - Parameters associated with the QTL detected for BBI derived indices and autoregressive coefficients and entropy. The first column indicates the variable concerned, the following columns indicate the linkage group (LG) where the QTL is located, 2ln(BF) value at LG scale, 2ln(BF) value at bin scale, the position of the QTL in cM, the position of the QTL peak, its additive effect, the frequency of positive allele and percentage of variance explained, respectively.
Index LG 2lnBF_LG max_2lnBF_bin pos
(cM) Peak (cM) add_ef fq %var BBI_res_norm_pred 4 6,3 6,8 32-47 36-37 0,13 0,35 13,3 5 5,8 8 3-24 21-22 0,1 0,56 8,3 8 8,4 9 8-23 14-15 0,12 0,42 11,7 10 9,3 8 57-78 75-76 0,11 0,52 10 gpred 4 6,7 6,8 32-45 36-37 0,11 0,64 12 5 6,2 8,3 3-30 21-22 0,1 0,42 10 8 9,4 8,9 8-23 14-15 0,11 0,59 12 10 9,5 7,8 57-78 75-76 0,1 0,5 10 Entglmm,g 1 3,7 6,4 44-59 48-49 0,05 0,63 10 7 2,4 4,3 39-56 51-52 0,05 0,54 10 9 8 7,4 19-34 25-26 0,07 0,75 20 15 4,5 7,1 46-69 56-57 0,05 0,65 10 17 3,1 5 0-27 0-1 0,05 0,5 10
Only 2lnBF values corresponding to the comparison of a model with 0 QTL to a model with 1 QTL are presented. QTLs in bold are those with a 2*lnBF >5.
DISCUSSION AND CONCLUSIONS
In conclusion, three indices can be considered as key and complementary descriptors of the bearing behaviour of genotypes at either tree or axis scales: BBI_res_norm, and entropy. The first two are sufficient to classify the genotypes into regular, irregular and biennial classes. However, entropy allows this diagnostic to be refined by providing information on the within-tree strategy of regular genotypes, with potential consequences on tree management and breeding goals. The correlations between tree- and axis-scale descriptors suggest that biennial bearing at tree scale results from the conjunction of synchronism in flowering between AS in a given year and biennial alternation at AS scale between consecutive years. On the contrary, regularity at tree scale results from either asynchronous locally alternating flowering or regular flowering at AS scale. Irregular genotypes exhibit intermediate values for every descriptor, suggesting that these genotypes are characterised by partial biennial alternation at AS scale or strong biennial alternation with partial synchronism. However, more complex within-tree organisation of synchronisms could exist (Couranjou, 1983). We suggest that selecting genotypes with regular desynchronized axes could be an appropriate strategy.
The lower flowering probability at Montpellier than Angers may result from the absence of thinning practices on XB family, which may have hampered tree flowering capacity over years (Dennis & Neilsen, 1999). However, thinning was performed quite lately in Angers, due to a large dispersion of phenological stages among genotypes (Allard et al., 2016). This practice likely had a relatively low impact on floral induction which is assumed to occur mid-June in apical meristems of spurs (Hanke et al., 2007) and therefore on alternation. Even though the mean probability of flowering of all genotypes per site highlighted phase opposition in the last three years (data not shown), no clear characterisation of years as being ‘ON’ or ‘OFF’ could be made on the mean values per family. Although critical climatic conditions such as frost (Nagy et al., 2010) can synchronise trees in a given year and site, different genotypes in opposition phase for flowering can be observed in a given year.
The predicted BBI_res_norm and appeared robust based on QTL detection, but the classification error was still of 35%. The miss-classification mainly concerned the
irregular genotypes, whereas the regular and biennial behaviours could be predicted with good accuracy. The misclassification of regular genotypes considered as irregular (15 over 36, see Table 1) could lead to discard them during the selection process. However, this type of error is less problematic than the reverse (selecting irregular genotype that would be misclassified as regular) especially if we consider the drastic reduction in the number of individual selected in the early stages of breeding process. Therefore, the simplified phenotyping strategy that consists in sampling axes within the tree structure with an a posteriori observation appears to be relevant. Indeed, this is a time-saving strategy for phenotyping that can be combined to computation of indices for rejecting biennial and irregular genotypes during the assessment of agronomic performance of pre-selected genotypes in breeding programmes.
In a breeding perspective, the three descriptors (i.e. BBI_res_norm_pred, pred and
entropy) and five major QTLs on LG 4, 5, 8, 9 and 10 could be considered to ensure regular bearing behaviour with alleles adequately combined in new released materials. As underlined by Samach and Smith (2013), the evolutionary advantage of masting remains questionable. Our results suggest that flowering synchronicity at the tree level could not be associated with regularity, probably because it would lead to over-cropping and major drawbacks in an agronomic context. This study revealed a complex genetic architecture of flowering habit in apple. The overview of all loci involved in trait variation led us to assess promising individuals and progenitors (Durand et al., 2017). The pedigree-based approach used herein appears particularly relevant for plant species in which varieties are tightly related to each other, which is the case in most crops. In addition, the relative importance of loci and the cumulative effects of small loci should not be overlooked. In this perspective, genomic selection models would be complementary to QTL analyses to evaluate the genetic value of individuals.
ACKNOWLEDGEMENTS
The authors acknowledge Y. Guédon and C. Trottier for fruitful discussions and advices, S. Martinez, S. Hanteville and Y. Holtz for their contribution in phenotyping and data analyses. The FruitBreedomics project N°. 265582 of the EU seventh Framework Programme (www.FruitBreedomics.com) is acknowledged for the usage of SNP, pedigree and genetic linkage map. The views expressed in this work are the sole responsibility of the authors and do not necessary reflect the views of the European Commission.
Literature cited
Allard A, Bink MCAM, Martinez S, Kelner JJ, Legave JM, Guardo M di, Pierro EAD, Laurens F, Weg EW van de, Costes E. 2016. Detecting QTLs and putative candidate genes involved in budbreak and flowering time in an apple multiparental population. Journal of Experimental Botany 67, 2875-2888 doi: 10.1093/jxb/erw130.
Bianco L, Cestaro A, Sargent DJ, et al. 2014. Development and Validation of a 20K Single Nucleotide Polymorphism (SNP) Whole Genome Genotyping Array for Apple (Malus × domestica Borkh). PLoS ONE 9, doi:10.1371/journal.pone.0110377.
Bink MCAM. 2002. On flexible finite polygenic models for multiple-trait evaluation. Genetical Research 80, 245-256.
Bink MCAM, Boer MP, Braak CJF, Jansen J, Voorips RE, Van de Weg E. 2008. Bayesian analysis of complex traits in pedigreed plant population. Euphytica 161, 85-96.
Bink MCAM, Jansen J, Madduri M, et al. 2014. Bayesian QTL analyses using pedigreed families of an outcrossing species, with application to fruit firmness in apple. Theoretical and Applied Genetics 127, 1073-1090.
Bink MCAM, Uimari P, Sillanpää MJ, Janss LLG, Jansen RC. 2002. Multiple QTL mapping in related plant populations via pedigree-analysis approach. Theoretical and Applied Genetics 104, 751-762.
Couranjou J. 1983. Facteurs variétaux de l’alternance des arbres fruitiers. Résultats de quinze années de recherches chez le prunier domestique. Fruits 38, 705-728.
Dennis FG, Neilsen JC. 1999. Physiological Factors Affecting Biennial Bearing in Tree Fruit: The Role of Seeds in Apple. HortTechnology 9, 317-322.
Di Guardo M, Micheletti D, Bianco L, et al. 2015. ASSIsT: An an Automatic automatic SNP ScorIng scorIng Tool tool for in- and outbreeding species. Bioinformatics 31, 3873-3874.
Durand JB, Guitton B, Peyhardi J, Holtz Y, Guédon Y, Trottier C, Costes E. 2013. New insights for estimating the genetic value of segregating apple progenies for irregular bearing during the first years of tree production. Journal of Experimental Botany 64, 5099-5113.
Durand J.B., Allard A., Guitton B., van de Weg E., Bink M.C.A.M., Costes E. 2017. Predicting flowering behavior and exploring its genetic determinism in an apple multi-family population based on statistical indices and simplified phenotyping. Frontiers in Plant Science, 8, 858. https://doi.org/10.3389/fpls.2017.00858
Guitton B, Kelner JJ, Velasco R, Gardiner SE, Chagné D, Costes E. 2012. Genetic control of biennial bearing in apple. Journal of Experimental Botany 63, 131-149. doi:10.1093/jxb/err261.
Hanke MV, Flachowsky H, Peil A, Hättasch C. 2007. No flower no fruit—genetic potentials to trigger flowering in fruit trees. Genes Genomes Genomics 1, 1-20.
Huff A. 2001. A significance test for biennial bearing using data resampling. Journal of Horticultural Science & Biotechnology 76: 534-535.
Josse J, Husson F. 2012. Selecting the number of components in principal component analysis using cross-validation approximations. Computational Statistics & Data Analysis 56, 1869-1879. Lauri PE, Terouanne E, Lespinasse JM. 1997. Relationship between the early development of apple fruiting branches and the regularity of bearing—An approach to the strategies of various cultivars. Journal of Horticultural Science 72, 519-530.
Monselise SP, Goldschmidt EE. 1982. Alternate Bearing in Fruit Trees. In: Janick J, ed. Horticultural Reviews. Palgrave Macmillan UK, 128-173.
Nagy PT, Szabo Z, Nyeki J, Dussi MC. 2010. Effects of Frost-Induced Biennial Bearing on Nutrient Availability and Fruit Disorders in an Integrated Apple Orchard. In: Costa G, ed. Xi International Symposium on Plant Bioregulators in Fruit Production. Leuven 1: International Scociety of Horticultural Science, 753-757.
Pauly L, Flajoulot S, Garon J, Julier B, Béguier V, Barre P. 2012. Detection of favorable alleles for plant height and crown rust tolerance in three connected populations of perennial ryegrass (Lolium perenne L.). Theoretical and Applied Genetics 124, 1139-1153.
Pierro EAD, Gianfranceschi L, Guardo MD, Koehorst-van Putten HJJ, Kruisselbrink JW, Longhi S, Troggio M, Bianco L, Muranty H, Pagliarani G, Tartarini S, Letschka T, Lozano Luis L, Garkava-Gustavsson L, Micheletti D, Bink MCAM, Voorrips RE, Aziz E, Velasco R, Laurens F, van de Weg WE. 2016. A high-density, multi-parental SNP genetic map on apple validates a new mapping approach for outcrossing species. Horticulture Research 3, 16057.
Samach A, Smith HM. 2013. Constraints to obtaining consistent annual yields in perennials. II: Environment and fruit load affect induction of flowering. Plant Science 207, 168-176.
Van de Weg, W. Eric, Mario Di Guardo, Herma Koehorst-van Putten, Sara Longhi, Y. Noordijk, Helene Muranty, Elisa Banchi, et al. 2013. A Pipeline for Robust Marker Calling from Infinium SNP Arrays for Diploid Crops. https://hal.archives-ouvertes.fr/hal-01209967.
Voorrips RE, Bink MCAM, Kruisselbrink JW, Koehorst-Van Putten, Van de Weg WE. 2016. PediHaplotyper: software for consistent assignment of SNP haplotypes in pedigrees. Molecular Breeding 36 (8), 119.
Wilcox J. 1944. Some factors affecting apple yields in the Okanagan Valley: tree size, tree vigor, biennial bearing, and distance of planting. Scientific Agriculture 25: 189.