Publisher’s version / Version de l'éditeur:
Scientific Reports, 7, 2017-02-23
READ THESE TERMS AND CONDITIONS CAREFULLY BEFORE USING THIS WEBSITE. https://nrc-publications.canada.ca/eng/copyright
Vous avez des questions? Nous pouvons vous aider. Pour communiquer directement avec un auteur, consultez la
première page de la revue dans laquelle son article a été publié afin de trouver ses coordonnées. Si vous n’arrivez pas à les repérer, communiquez avec nous à PublicationsArchive-ArchivesPublications@nrc-cnrc.gc.ca.
Questions? Contact the NRC Publications Archive team at
PublicationsArchive-ArchivesPublications@nrc-cnrc.gc.ca. If you wish to email the authors directly, please see the first page of the publication for their contact information.
Archives des publications du CNRC
This publication could be one of several versions: author’s original, accepted manuscript or the publisher’s version. / La version de cette publication peut être l’une des suivantes : la version prépublication de l’auteur, la version acceptée du manuscrit ou la version de l’éditeur.
For the publisher’s version, please access the DOI link below./ Pour consulter la version de l’éditeur, utilisez le lien DOI ci-dessous.
https://doi.org/10.1038/srep42835
Access and use of this website and the material on it are subject to the Terms and Conditions set forth at
Ectopic expression of Arabidopsis Target of Rapamycin (AtTOR)
improves water-use efficiency and yield potential in rice
Bakshi, Achala; Moin, Mazahar; Kumar, M. Udaya; Reddy, Aramati Bindu
Madhava; Ren, Maozhi; Datla, Raju; Siddiq, E. A.; Kirti, P. B.
https://publications-cnrc.canada.ca/fra/droits
L’accès à ce site Web et l’utilisation de son contenu sont assujettis aux conditions présentées dans le site LISEZ CES CONDITIONS ATTENTIVEMENT AVANT D’UTILISER CE SITE WEB.
NRC Publications Record / Notice d'Archives des publications de CNRC:
https://nrc-publications.canada.ca/eng/view/object/?id=7b5db050-ebf8-4ff7-869d-d802b3de07c9
https://publications-cnrc.canada.ca/fra/voir/objet/?id=7b5db050-ebf8-4ff7-869d-d802b3de07c9
ectopic expression of Arabidopsis
Target of Rapamycin (AtTOR)
improves water-use eiciency and
yield potential in rice
Achala Bakshi
1, Mazahar Moin
1, M. Udaya Kumar
2, Aramati Bindu Madhava Reddy
3,
Maozhi Ren
4, Raju Datla
5, e. A. Siddiq
6& p. B. Kirti
1The target of Rapamycin (TOR) present in all eukaryotes is a multifunctional protein, regulating growth, development, protein translation, ribosome biogenesis, nutrient, and energy signaling. In the present study, ectopic expression of TOR gene of Arabidopsis thaliana in a widely cultivated indica rice resulted in enhanced plant growth under limiting conditions conferring agronomically important water-use eiciency (WUE) trait. The AtTOR high expression lines of rice exhibited profwater-use tillering, increased panicle length, increased plant height, high photosynthetic eiciency, chlorophyll content and low ∆13C. ∆13C, which is inversely related to high WUE, was as low as 17‰ in two AtTOR high expression lines. These lines were also insensitive to the ABA-mediated inhibition of seed germination. The signiicant upregulation of 15 stress-speciic genes in high expression lines indicates their contribution to abiotic stress tolerance. The constitutive expression of AtTOR is also associated with signiicant transcriptional upregulation of putative TOR complex-1 components, OsRaptor and OsLST8. Glucose-mediated transcriptional activation of AtTOR gene enhanced lateral root formation. Taken together, our indings indicate that TOR, in addition to its multiple cellular functions, also plays an important role in response to abiotic stress and potentially enhances WUE and yield related attributes.
Rice is a staple cereal food consumed by more than half of the world population and widely cultivated mostly in Asian countries. Environmental factors such as drought and high salinity are the major yield constraints for the high productivity of rice. he recent advancements in genetic engineering has provided new opportunities to enhance yield potential and tolerance to drought and other stresses by manipulating some of the regulatory genes involved in complex physiological and biochemical processes such as osmotic adjustment under water deicit environment.
he Target of Rapamycin (TOR) is one of such genes, which encodes a protein that is involved in the regu-lation of diverse cellular and metabolic processes, distributed in all eukaryotes including plants, yeast, animals and human. It has important functions in growth, development and metabolism. TOR is a conserved 280 kDa serine/threonine protein kinase belonging to a phosphatidylinositol-3-kinase family possessing ive conserved domains represented by HEAT repeat, FAT (Focal adhesive Target), FRB (FKBP12, FK506 drug binding protein 12/Rapamycin Binding), Kinase and FATC domains from N to C-terminus, respectively. HEAT repeats bind directly to the promoter and 5′ UTR regions of 45S rRNA via its Leucine zipper domain and regulates 45S rRNA synthesis1. Inducible TOR knockout Arabidopsis plants displayed growth arrest via a reduction in polysome
accu-mulation, which ultimately resulted in a severe reduction in plant biomass, organ and cell size2. FAT domain is
involved in protein-protein interactions, while FRB is sensitive and speciically binds to an anti-inlammatory drug, Rapamycin3–6. he Kinase domain belongs to Ser/hr kinase family that regulates embryogenesis and
1Department of Plant Sciences, University of Hyderabad, Hyderabad-500046, India. 2Department of crop
Physiology, University of Agricultural Sciences-GKVK, Hebbal, Bangalore, India. 3Department of Animal Biology,
University of Hyderabad, Hyderabad-500046, India. 4Plant Biotechnology Institute, National Research Council of
Canada, Saskatoon, Saskatchewan, S7N 0W9, Canada. 5Biotechnology research Institute, Chinese academy of
Agricultural Sciences, Beijing, P.R. China; School of Life Sciences, Chongqing University, Chongqing, P.R. China.
6Institute of Agricultural Biotechnology, PJTS Agricultural University, Rajendranagar, Hyderabad-500030, India.
Correspondence and requests for materials should be addressed to P.B.K. (email: pbkirti@uohyd.ac.in) Received: 27 May 2016
Accepted: 16 January 2017 Published: 23 February 2017
nuclear localization. Deletion of kinase domain in Arabidopsis resulted in embryonic lethality1. he FATC at the
C-terminal region is involved in protein scafolding.
Yeast expresses two TOR proteins; TOR1 and TOR2, whereas animals and plants possess only one copy of TOR. In yeast and mammals, TOR exists as two complexes TORC1 and TORC2 whereas plants have only one known TORC complex. hese TOR complexes are mainly localized to endo-membranes and the nucleus and also exhibit mobilization according to the varied environmental conditions7. he TORC1 complex composed
of TOR proteins, LST8 and Raptor6 (Regulatory associated protein of TOR) regulates translation, nutrient and
energy signaling and is sensitive to Rapamycin6. he Rapamycin-insensitive TORC2 complex consists of TOR,
Rictor (Rapamycin-insensitive companion of TOR), Lst8 and SIN18. However, these TORC2 components have
not been identiied so far in plants and other photosynthetic organisms5,6,9,10. TORC2 regulates the organization
of cytoskeletal structure and cell survival6,11.
Unlike animals and yeast, plant TOR is insensitive to rapamycin12–14. Based on the position of introns in the
genic regions of TORC1 components, Raptor and LST8 in human are similar to plants indicating that they are evo-lutionarily conserved10. he glucose-activated TOR signaling regulates genes involved in root meristem growth,
cell proliferation, cell cycle, and nucleotide synthesis12. Auxin-activated TOR pathway regulates translation
ini-tiation and polysome accumulation15. Other phytohormones such as ABA regulate plants response to abiotic
stresses such as dehydration and salinity by controlling stomatal aperture and transcription of stress-responsive genes5,16 while other cis-regulating elements such as DREB1/CBF and DREB2A are ABA-independent
dehydra-tion stress-responsive elements.
he multiple metabolic and regulatory cellular functions of TOR and also presence of cis-regulatory elements in the putative promoter region of its gene have prompted us to study the efect of ectopic expression of AtTOR for its ability to enhance water-use eiciency (WUE) in rice without compromising on the yield, which is a very important manipulation with signiicant agronomic considerations. We have generated transgenic rice plants overexpressing AtTOR and our key indings in the context of WUE, phenotypic and physiological characteriza-tion and regulacharacteriza-tion of stress-speciic genes in high TOR expression lines in a very widely cultivated indica variety of rice, BPT-5204 (Samba Mahsuri), in which water is a major yield limiting factor, are reported here.
Materials and Methods
Regulation of OsTOR by Amino acid supplements.
Amino acids induce the expression of TOR gene in mammalian systems. To check whether the plant TOR is also regulated by amino acids, wild type (WT) indica rice seedlings were germinated on 15 diferent amino acid supplements at a concentration of 1 mM each on solid MS medium. he WT seedlings grown on MS medium without amino acid supplement were taken as a control to normalize the expression patterns. he shoot and root samples were collected ater 7 d of treatment. Total RNA was isolated from root and shoot tissues, and the synthesized cDNA samples were used for qRT-PCR analysis.Germination of WT rice seeds on Rapamycin.
TOR protein exists as two complexes, TORC1 and TORC2. he TORC2 is insensitive to Rapamycin. he structural analysis of yeast TORC2 complex showed that it has a pseudo-symmetrical rhomboid shape with the prominent central cavity and its C-terminal subunit, Avo3 resembles FRB domain of TOR2 protein. hus, a Rapamycin-sensitive, TORC2 can be produced by removing the C-terminal sequences17. Plants have only TORC1 complex, which is insensitive to Rapamycin. Arabidopsis wasinsensitive even at concentrations >10 µg/mL Rapamycin14. In contrast to this, maize was found to be sensitive to
even 0.1 µM Rapamycin18. To check the sensitivity of rice to Rapamycin, WT rice seeds were allowed to germinate
ater surface sterilization on solid MS medium supplemented with six diferent concentrations of Rapamycin separately viz., 20 µg/mL, 50 µg/mL, 100 µg/mL 150 µg/mL, 200 µg/mL and 250 µg/mL. Seed germination was compared with WT seeds cultured on solid MS medium without Rapamycin.
Protein extraction and Western blot Analysis.
Total protein was extracted from one gram of 200 µg/mL and 250 µg/mL Rapamycin-treated and untreated 7 d-old WT seedlings by phenol extraction method. he protein precipitate was re-suspended in rehydration bufer (7 M urea, 2 M thiourea, 4% CHAPS and 30 mM DTT) and quantiied by Bradford method using BSA as a standard. About 60 µg of total protein was loaded for SDS-PAGE and Western blot analysis.To detect the TOR-mediated phosphorylation of OsS6K1, Western blot was performed using mouse antibody against human phospho70S6K1 (hr(P)-389) (Cell Signaling Technologies, cat# 9206), anti-70S6K1 (CST, cat# 2708S), anti-GAPDH (Santa Cruz, FL-335#SC25778) with respective HRP-conjugated secondary antibodies and immunoreactions were detected by a chemiluminescent method (ChemiDoc XRS, Bio-Rad). S6K1 proteins of human, Arabidopsis and rice are 70 kDa proteins and the phosphorylation sites of these proteins are conserved. he human S6K1 antibodies were demonstrated to be reactive against S6K1 proteins of plants such as Arabidopsis and rice12,13,19. Because of the high conservation and speciicity, we have used human p70S6K1 antibody raised in
mouse (CST, cat# 9206) to detect rice S6K1 phosphorylation.
AtTOR Vector details and in planta transformation of indica rice.
he 7.4 kb, full-length TOR cDNA was derived from Arabidopsis thaliana (Col.). he cDNA was ampliied using NotI restriction site at the 5′ end and XmalI site at the 3′ end of the sequence. he full-length AtTOR was then cloned into the p8GWN vector at NotI/XmaI sites and was inally transformed into binary vector, pEarleyGate 203 through LR recombination. he binary vector also carries the bar gene under Mannopine synthase promoter as a plant selection marker1.he binary vector carrying 35S: AtTOR was transformed into a widely cultivated indica rice variety BPT-5204 using a novel in planta transformation protocol. Rice seeds of BPT-BPT-5204 (Samba Mahsuri) were manually de-hulled and surface sterilized with 70% ethanol for 1 min and then twice for 10 min with 4% aqueous sodium hypochlorite containing a drop of Tween-20, followed by ive washes with sterile double-distilled water. Sodium
hypochlorite not only sterilizes the seeds but also removes the seed waxes, which could otherwise inhibit the entry of Agrobacterium20. he Agrobacterium culture carrying the binary vector, 35S: AtTOR was grown
over-night at 28 °C on a rotary shaker in 100 mL Luria Bertani (LB) medium containing the antibiotics Kanamycin and Rifampicin (50 mg/L each). he culture (OD600 = 1.0) was centrifuged at 5000 rpm for 5 min and the pellet was
re-suspended in an equal volume of Agrobacterium suspension solution (MS basal salts supplemented with 68 g/L sucrose, 10 g/L glucose, 0.6 g/L proline, 200 µM Acetosyringone, 3g/L each of KCl and MgCl2 at pH 5.4). A ine
sterile needle was dipped in the Agrobacterium suspension and gently pierced at the basal part of the embryo of seeds. Ater infection, the infected seeds were kept in a vacuum jar. Using an air-out vacuum system, air was evac-uated and the seeds were maintained under a vacuum of about 15 mmHg for 20 min, ater which the vacuum was released as quickly as possible. Following this, the infected seeds were further incubated in the Agrobacterium sus-pension at 28 °C under gentle agitation (100 rpm) for 20 min. hen the seeds were maintained for 3 d in the dark at 28 °C with the embryonic portion of the seed in contact with the co-cultivation medium (MS salts containing 30 g/L sucrose, 1.0 g/L proline, 300 mg/L casein hydrolysate, 150 µM Acetosyringone and 7 g/L agar, pH 5.4). Ater 3 d, seeds were washed thrice with water and allowed to recover on blotting paper moistened with half strength liquid MS medium21 containing the antibiotics, Carbenicillin and Cefotaxime (250 mg/L each) up to a
week until the growth of the seedlings was observed. he seedlings were then transferred to pots and grown under greenhouse conditions to select for T1 plants.
Selection and molecular analysis of rice AtTOR transgenic plants.
he T-DNA of the AtTOR binary vector contains a plant selection marker gene, bar that provides resistance to the herbicide phosphinothricin (PPT). Seeds obtained from the Agrobacterium treated rice plants were germinated on a medium containing 10 mg/L PPT to select the transgenic plants for a detailed analysis and maintenance. hose seeds that germinated on the PPT selection medium were transferred to the pots in the greenhouse under the controlled conditions.PCR ampliication was performed on the transformed plants using primers speciic for the various elements present in the T-DNA. PCR reactions were performed in a 25 µl total reaction volume containing 2.5 µl 10X bufer, 1 unit Taq polymerase, 10 µM of each primer and 10 ng of plasmid (35S: AtTOR) was used as a positive control. PCR was carried with an initial denaturation at 94 °C for 4 min followed by 35 repeated cycles of 94 °C for 1 min, 56 °C for 50 sec, and 72 °C for 1 min. his was followed by a inal extension at 72 °C for 10 min. Ater PCR conirmation, seeds were collected from T1 generation plants and were proceeded further to raise T2 generation
by screening them again on the selection medium. All the phenotypic, physiological and molecular analysis were carried out on T2 generation PPT resistant transgenic plants (which are a mixture of homozygous and
hemizy-gous plants). he observations on the responses of ABA and glucose and the expression studies of stress-related genes and TORC1 complex components have been obtained from T3 generation plants.
Southern-blot hybridization analysis of transgenic plants.
Southern-blot hybridization was per-formed to conirm the transgenic nature of the plants and also to verify the copy number of the integrated T-DNA in the genomes of transgenic rice plants. Genomic DNA was isolated from the leaves of T2 generation plants usingthe CTAB method. About 10 µg of genomic DNA was digested overnight with AsiSI and ClaI restriction enzymes (which does not have internal restriction sites within the T-DNA) at 37 °C. he fully digested genomic DNA fragments were electrophoresed on 0.8% agarose gel at 20 V for 16–18 h. he digested DNA fragments were alkali (NaOH) denatured and transferred onto Hybond N+ nylon membrane (GE Healthcare Life Sciences), followed by
UV cross-linking (120 kJ/cm2). he PCR-ampliied product of the bar gene was labeled with DIG-dUTP using the
Klenow polymerase and used as a probe in the hybridization analysis. Ater hybridization and repeated stringency washes, binding of the probe was detected using anti-DIG-alkaline phosphatase enzyme and NBT/BCIP substrate according to the manufacturer’s protocol (Roche Life Sciences, Germany).
Semi-quantitative (semi-Q) and Quantitative real-time PCR (qRT-PCR).
Semi-Q and qRT-PCR analysis were performed on T2 generation rice transgenic plants to separate the low, medium and high expressionlines of AtTOR. Total RNA was isolated from the leaves of one-month-old transgenic and WT plants using Trizol (Sigma-Aldrich, US) method. About 2 µg of total RNA was used for irst-strand cDNA synthesis using SMARTTM
MMLV Reverse Transcriptase (Takara Bio, Clontech, USA). he synthesized cDNA was diluted seven times (1:7) and 2 µl of this was used for analyzing the transcript level of TOR gene using primers that speciically bind and amplify Arabidopsis TOR-kinase. he conditions used in semi-Q PCR include an initial denaturation at 94 °C for 3 min, followed by 26 repeated cycles of 94 °C for 30 sec, 61 °C for 25 sec and 72 °C for 30 sec with a inal exten-sion for 5 min at 72 °C. he OsActin was used as an endogenous reference gene in both semi-Q and qRT-PCR analyses of all the genes studied. Based on the band intensity observed on the agarose gel ater semi-Q PCR, the transgenic lines were categorized as low, medium and high expression lines, which were further characterized with qRT-PCR.
he same cDNA that was diluted in 1:7 proportions used in semi-Q PCR was also used in qRT-PCR to analyze the transcript levels in three classes of AtTOR plants (low, medium and high) that were separated through semi-Q PCR. Since the TOR gene in rice transgenic plants has been derived from Arabidopsis, WT rice cannot be used to normalize the expression. herefore, we have used a low-expression transgenic plant as a control to normalize the expression using primers speciic to AtTOR. Among these, the transgenic plant, TR5.1 with a weak band inten-sity (low-expression line) in Semi-Q PCR was considered as a control to normalize the fold level in qRT-PCR, performed using SYBR Green
®
Premix (Takara Bio, USA). he qRT-PCR reaction conditions included an initial denaturation at 94 °C for 2 min, followed by 40 cycles of 94 °C for 15 sec, 61.9 °C for 25 sec and 72 °C for 30 sec followed by a melting curve. he qRT-PCR data was analyzed according to the ∆∆CT method22.Transcript analysis of OsTOR Complex-1 (TORC1) components in transgenic rice plants.
he OsRaptor and OsLst8 are the components of TORC1 complex that directly interact with HEAT repeats and the kinase domain of TOR protein, respectively. To check whether the expression pattern of these two genes varied in relation to the expression of AtTOR in rice transgenic plants, we analyzed the transcript levels of rice OsRaptor and OsLst8 in root and shoot tissues of two medium (TR10.2 and TR22.6), two high (TR2.24, TR15.10) and one low AtTOR expression lines (TR5.1) in 7 d old seedlings through qRT-PCR.Screening of transgenic plants for high WUE.
To examine whether TOR enhances WUE in rice, the T2generation AtTOR transgenic plants along with WT were grown under limited water availability conditions. Ater selection on PPT medium for two weeks, the AtTOR transgenic plants along with WT were transferred to pots and allowed to grow with adequate water supply in the pots (with 3–4 cm water overlay as in normal conditions) in the greenhouse. Ater four weeks of normal growth, the surface water was withdrawn, and the water level was adjusted such that wet/moist conditions were maintained in the soil (100% ield capacity). hese conditions were maintained till the plants reached maturity. All the phenotypic and physiological observations were recorded dur-ing these growth conditions of the plants, and the measurements were compared with two types of WT, one grown with adequate water supply and the other maintained along with transgenic plants under water-limited conditions.
Phenotypic characterization of transgenic plants.
Yield-related phenotypic parameters such as the number of tillers, productive tillers (panicles), panicle length and plant height were recorded 45 d ater growth under limited water conditions and 70 d ater transfer to the greenhouse. he phenotypic parameters were col-lected from ive individual plants of each transgenic line and WT, and the mean of these recordings was plotted as a histogram using an online tool (http://www.wessa.net/).Measurement of Chlorophyll luorescence of photosystem-II.
Chlorophyll (Chl) luorescence was measured using a portable pulse-amplitude modulated photosynthesis yield analyzer (MINI-PAM) essentially according to the manufacturer’s protocol (Heinz Walz, Germany). Chl luorescence is a key indicator of the over-all photosynthetic performance of a plant and also indicates whether a plant is experiencing stress23. It also givesan insight into the use of excitation energy by photosystem II (PSII).
When leaves, that have been adapted to a brief dark period are exposed to a beam of low intensity light (0.1 µmol m2 s1), chlorophyll gets excited to a minimal level (F
o). Application of a saturating pulse (8000 µmol m2 s1) results
in the formation of a maximum possible yield of luorescence (Fm). he diference between Fm and F0 gives a
variability in luorescence (Fv) and the efective quantum yield of PSII was calculated as Fv/Fm23. he quantum
eiciency of unstressed plants grown under normal conditions was in the range of 0.83–0.84. Low Fv/Fm values
indicate that plants are under stress; higher values represent high quantum yield24. Two readings were taken in
all the transgenic plants along with WT ater exposing them to a dark period of 30 min at an interval of 15 d each ater withdrawing water. he mean of all these readings was plotted as a histogram.
Estimation of Chlorophyll content.
he Chl content was measured in the leaves of WT, low, medium and high expression lines three weeks before and ater their growth under water deicit conditions. he Chl was extracted using 100 mg of leaf tissue in 80% acetone and absorption of the extracts was measured at OD 663 nm and 645 nm using a UV spectrophotometer25. he concentrations of Chl-a, Chl-b and total chlorophyll (Chl-t)were then calculated using the equations as described earlier26.
∆
13C analysis of transgenic plants.
Carbon exists as two stable isotopes (13C and 12C) in the atmospherewith a molar ratio of 1:99, C3 photosynthetic plants prefer 12C over 13C27. he photosynthetic enzyme RubisCO
discriminates the carbon isotopes during photosynthesis by sensing the diference in CO2 difusion through
sto-mata. Environmental factors such as temperature, water and other stresses reduce the leaf stomatal conductance due to which the internal leaf CO2 concentration gradient also changes, which ultimately afects carbon
assim-ilation during photosynthesis in plants. hese changes due to environmental efects can be assessed by carbon isotope composition (∆13C) in leaf tissue i.e. discrimination against heavier isotope (13C) from lighter isotope
(12C) in C
3 or C4 plants during photosynthesis. Deviation in CO2 concentration, changes the biochemical and
metabolic products and contributes to variation in plants internal isotopic composition. his deviation from the existing ratio can be used to know the internal changes in plants due to the environmental stress factors. his ratio of 13C/12C can be correlated to the ratio of photosynthesis and stomatal conductance, which is also known
as water-use eiciency (WUE).
Under water limited conditions stomata tend to close to reduce the transpirational water loss, which in some genotypes results in an improvement of the WUE. During such situations, plants exhibit low internal CO2
con-centration and reduced discrimination for 13C from 12C along with improved WUE. his increase in WUE results
in decreased biomass of the plant. he ∆13C value calculated as a molar ratio (R) of 13C/12C of transgenic plants
is compared to WT (R sample leaf/R standard control leaf –1) ‰ and is normalized with the international PDB standard, which has a deviation of approximately 8‰ for free atmospheric CO227. To measure ∆13C and hence
WUE, 150 mg of leaf samples of transgenic plants and WT grown under limited water conditions for 45 d were dried at 65 °C for three days. he powdered samples were analyzed in Isotope Ratio Mass Spectrometer (IRMS) to determine the carbon isotope ratios28.
Determination of Glucose-mediated activation of TOR.
Previous reports have suggested that Glucose-mediated activation of TOR is necessary for root meristem growth12. he seeds of low, medium andhigh expression lines along with WT were germinated on MS medium with and without glucose (0.3% w/v). he growth of primary and lateral roots in transgenic lines and WT grown with or without glucose was observed 5 d ater germination (DAG) under a stereomicroscope. he lateral roots were counted from ive seedlings of each
treated and untreated samples and mean values were plotted as bar diagrams with ± standard error. On 7 DAG, RNA was extracted from WT and each transgenic line and the expression of the kinase domain of TOR gene was determined in transgenic lines (T3) grown with and without glucose, which were normalized with WT seedlings
that were grown with and without glucose, respectively.
Seed germination assays on ABA.
About 25 seeds from each of low, medium and high AtTOR rice expression lines along with WT were allowed to germinate on MS medium supplemented with ABA (50 µM). he seed germination rate was scored at 3 and 5 DAG. All the experiments were repeated thrice and the average of three replicates was plotted with standard errors.Stress treatments and transcriptional regulation of stress-speciic genes in high expression
lines of AtTOR rice transgenic plants.
To investigate whether TOR regulates the expression of any stress-speciic genes, we analyzed the expression pattern of 15 stress-speciic genes in both abiotic stress treated and untreated seedlings of T3 generation rice AtTOR high expression lines through qRT-PCR. he transcript levelsof stress-speciic genes in untreated seedlings of high expression lines were normalized with untreated WT seed-lings while the transcript levels in treated seedseed-lings of high expression lines were normalized with abiotic treated seedlings of WT. he two high expression lines, TR2.24 and TR15.10 having single T-DNA integration copy, high photosynthetic yield, and low ∆13C were selected for the expression studies. Seeds derived from these lines
car-rying AtTOR along with WT were germinated on MS medium and grown for two weeks at 28 °C, 12 h light-dark photoperiod. Ater two weeks, seedlings of the two transgenic lines along with the WT were subjected to three abi-otic treatments such as ABA (100 µM), 15% (w/v) PEG-8000 and NaCl (300 mM). Ater treatments root and shoot samples of transgenic and WT samples were collected separately as three biological replicates at 5 min, 3 h, 6 h and 24 h intervals ater treatments. Total RNA isolation and cDNA synthesis was performed as discussed earlier. he cDNA was diluted as 1:7 proportions and 2 µl of diluted cDNA was used to analyze the transcript level of each gene by qRT-PCR. he OsActin was used as an endogenous reference gene and fold changes of transgenic lines were normalized using seedlings dipped in water at corresponding time intervals. Each qRT-PCR reaction was performed as three technical replicates using samples collected in three biological replicates. Fiteen stress-speciic genes from rice such as OsDHODH1, OsNADPH1, OsSKIP1a, OsALDH2a, OsAOX1a, OsTPP1, OsLEA3-1, OsGL1-2 OsbZIP23, OsNAC1, OsNAC2, OsWRKY72, OsDREB2B, OsPP2C and OsSIK1 that were shown to be involved in earlier studies on immediate response in plants to abiotic stress were selected and their expression was analyzed in shoot and root tissues of untreated and ABA, PEG and NaCl-treated AtTOR high expression lines.
In silico putative promoter and protein phylogenetic analysis of TOR.
To identify the presence of cis-regulatory sequences in the putative promoter regions of rice and Arabidopsis TOR genes, a 1.5 kb sequence upstream of each gene was obtained from OryGenesDB and TAIR databases, respectively and submitted in PlantCare database. To analyze the protein phylogeny, protein sequences of TOR derived from the members belonging to Poaceae (Sorghum bicolor; SbTOR, Zea mays; ZmTOR, Triticum uratu; TuTOR, Oryza sativa ssp. japonica, O. sativa ssp. indica, O. sativa ssp. brachyantha), Brassicaceae (A. thaliana; AtTOR, Brassica napus; BnTOR), Solanaceae (Solanum tuberosum; StTOR, Nicotiana tabacum), Fabaceae (Vigna radiate; VrTOR, Arachis duranensis; AdTOR), Malvaceae (Gossypium rainmondii) and Pedaliaceae (Sesamum indicum) were aligned with TOR sequences of human (HumanTOR), Caenorhabditis elegans (CeTOR), Drosophila melanogaster (DmTOR), Saccharomyces cerevisiae (ScTOR1 and ScTOR2 aligned sequence) and Chlamydomonas reinhardtii (CrTOR) that were retrieved from NCBI. he retrieved sequences were aligned and the protein-based phylogenetic tree was constructed using MEGA7 program.Results
Activation of OsTOR by amino acids.
he predicted OsTOR is a 270 kDa protein composed of 2465 amino acids with a pI of 6.62. Amino acid residues such as leucine, alanine and serine are widely distributed con-stituting 12.8%, 9.2% and 7.3% of the total OsTOR protein, respectively. In shoots, arginine, leucine, and proline upregulated the OsTOR expression above 8-fold while serine and methionine-induced the transcript level up to 3-fold (Supplementary Fig. 1a). In roots, arginine, leucine, and proline activated the OsTOR transcript level more than a 10-fold while, alanine, valine, glutamine, threonine, isoleucine and phenylalanine-induced the expression up to 3-fold (Supplementary Fig. 1b). he OsTOR expression was downregulated by cysteine, tryptophan, histi-dine and lysine in both shoots and roots. Leucine, an essential component for TOR activation transports into the cells through glutamine-dependant manner and activates mTORC1 by phosphorylation of serine2448 residue through the Rag-GTPase pathway29–31.Rapamycin insensitivity of WT rice.
TOR protein belongs to a phosphatidylinositol-3-kinase related kinase family, and it is a target of an anti-proliferative drug, Rapamycin4. he formation of a ternary complex ofRapamycin binding FRB (FKBP12/rapamycin- binding) domain of TOR with FK506-binding protein 12 leads to the inactivation of TOR protein where Rapamycin forms non-covalent links between FRB domain and FKBP12 protein32. In contrast to Drosophila, mammals and yeast, plant TOR was found to be insensitive to Rapamycin.
Arabidopsis vegetative growth was not inhibited by Rapamycin even above 10 µg l−1 concentration, whereas the
growth of yeast was restricted at even 0.1 µg l−1 of Rapamycin14,33,34. his insensitivity might be due to the inability
to form the FKBP12–Rapamycin–FRB complex in the plants34. To check the sensitivity of OsTOR to the drug,
Rapamycin, we germinated WT rice seeds on six diferent concentrations of the antibiotic, 20 µg/mL, 50 µg/mL, 100 µg/mL, 150 µg/mL, 200 µg/mL and 250 µg/mL. At as high as 250 µg/mL Rapamycin concentration, there was no inhibition of the germination and growth of rice seeds, indicating that OsTOR is also insensitive to Rapamycin (Supplementary Fig. 1c).
Rapamycin insensitivity of OsTOR-kinase.
Rapamycin blocks TOR mediated phosphorylation of S6K in eukaryotic cells. hus TOR-kinase activity based on S6K phosphorylation had been used as a tool to unravel the TOR downstream signaling pathways in plants. Since no inhibition was observed in seed germination even at higher concentrations of Rapamycin, we checked the TOR-kinase activity based on OsS6K phosphorylation by using anti-mouse-phospho-p70S6K (hr(P)-389). Although the inhibition of TOR kinase activity had been reported with Rapamycin treatment in maize18, S6K phosphorylation was detected in our study in rice seedlingsgerminated even at high concentrations (200 and 250 µg/mL) of Rapamycin indicating insensitivity of OsTOR kinase activity by Rapamycin (Fig. 1). Since, human S6K1 antibody has been shown to detect the phospho-rylation of S6K1 in plant systems like Arabidopsis and rice12,13,19, we have used the same in our analysis and
the binding appears to be very speciic. he full Western blots and protein gel equal loading were depicted in Supplementary Fig. 1d. As, it has been shown that the activation of S6K1 phosphorylation would be undertaken by TOR-Raptor2 complex in rice19, we have also demonstrated the activation of OsRaptor in the AtTOR
trans-genic lines of rice, implying that rice S6K1 would also get activated by the same complex.
Screening of transformants and molecular analysis of AtTOR rice transgenic plants.
he binary vector contains the bar gene as a selection marker, conferring resistance to the herbicide phosphinothricin. Seeds obtained from the primary Agrobacterium-treated plants were screened on PPT selection medium. he transgenic seedlings started germination within 3–4 d ater inoculation, while non-transgenic and WT became bleached (Fig. 2a). Ater selection, plants were analyzed for the diferent elements present in the T-DNA by PCR amplii-cation (Fig. 2b). he Agrobacterium transformation rate was calculated in T1 generation as described by Cloughand Bent, 198935:
×
(PPT resistant seedlings)/(Total number of seedlings tested) 100
Of about 500 primary plants that were infected with Agrobacterium carrying AtTOR binary vector, 127 were found to be positive on 10 mg/L PPT selection medium with a transformation eiciency of 25.4%.
Southern-blot hybridization analysis.
Southern-blot hybridization was performed to conirm the trans-genic nature and also to investigate the copy number of T-DNA integration into the genome of the T2 generationrice transgenic plants carrying AtTOR. he independent nature of T-DNA integration into the genome of trans-genic plants was identiied by the diferent restriction fragments binding to the probe. Of the 12 samples analyzed, single insertions were found in 7 plants, while one plant carried two insertions (Fig. 2c). Few transgenic plants did not show any band, probably because of improper digestion or poor genomic DNA quality. he high expression plants, TR2.24 and TR15.10 selected for molecular investigations had a single copy of T-DNA integration in their genome.
Semi-Q and qRT-PCR to separate AtTOR lines based on kinase expression.
Based on the band intensity of AtTOR kinase domain speciic ampliication observed through semi-Q PCR, the AtTOR rice T2gen-eration transgenic plants were separated into low, medium and high expression lines. Rice actin was used to
Figure 1. Western blot analysis to determine efect of rapamycin on OsS6K phosphorylation. Western blot
analysis was performed with 7d-old WT untreated and 200 µg/mL and 250 µg/mL Rapamycin-treated seedlings using (a) Human anti-phospho-p70S6K (hr(P)-389), (b) anti-70S6K, and (c) anti-GAPDH with respective HRP-conjugated secondary antibodies. No inhibition of TOR-mediated-S6K phosphorylation was observed in Rapamycin-treated WT rice seedlings.
normalize the expression patterns (Fig. 3a–c). Based on the band intensity, rice lines were categorized into low, medium and high expression using Arabidopsis speciic kinase (Fig. 3d–f). he transcript levels of the same were further determined by qRT-PCR using the line with low-band intensity to normalize the expression pattern of other lines. he lines with transcript levels up to 15-fold were considered as medium while more than 15-fold were considered as high expression lines. Two lines, TR-2.24 and TR-15.10, were identiied as high expression lines, having transcript levels up to 30-fold in shoots and up to 80-fold in roots. Transgenic lines, TR-9.23, 22.6, 23.14, 10.2, 8.3, 6.2, 19.1 were categorized as medium with transcript levels up to 15-fold (Fig. 3g,h).
Transcript analysis of OsTORC1 components in transgenic plants.
Since OsRaptor and OsLst8 interact with HEAT repeats and the kinase domain of TOR protein, respectively, we analyzed the expression pattern of these two genes in root and shoot tissues of one low, two medium and two high expression lines. In the high expression lines, TR2.24 and 15.10, the transcript level of OsRaptor was more than 30-fold in shoots and up to 70-fold in roots whereas the transcript level of OsLST8 in these lines was up to 12-fold in shoots and 25-fold in roots (Fig. 3i). In shoots, of medium expression lines, TR-22.6, and TR-10.2, the transcript level of OsRaptor and OsLst8 ranged between 8 to 12 and 30 to 35-fold, respectively whereas the transcript levels of OsRaptor and OsLst8 upregulated up to 20 and 25-fold, respectively in roots (Fig. 3j). he transcripts of these two genes in low expres-sion line, TR5.1 were same as in WT. he expresexpres-sion levels of OsRaptor and OsLst8 transcripts were in accordance with the lines selected based on the expression levels of AtTOR indicating that the AtTOR gene directly regulates the Raptor and Lst8.Phenotypic analysis of AtTOR transgenic plants.
We observed various growth and yield related parameters in low, medium and high expression lines such as the number of tillers, panicles, the length of panicles and total seed yield. All the phenotypic and physiological measurements of the transgenic plants were recorded ater their growth under limited water conditions only and the readings were compared with two types of WT, one grown with adequate water and the other grown with limited water. he medium and high expression lines exhibited higher yield compared with the low expression lines and WT. Ater 45 d of continuous growth under limited water supply, WT started to undergo wilting, while the two high expression transgenic lines (TR2.24 and TR15.10), continued to stay green till plant maturity and seed harvest. hese plants had increased tillering, plant height, panicle length and number of productive tillers under limited water conditions with respect to WT. he high expression lines, TR2.24, and TR15.10 reached a height of 166.2 cm and 138.6 cm, respectively (Fig. 4a), while medium expression lines, TR10.2, TR22.6, TR9.23, TR8.3, and TR23.14 had 116.7 cm, 113.6 cm, 111.5 cm and 108.4 cm 102.6 cm plant height respectively. he plant height in the low expression lines TR12.23, TR13.2, TR18.6, TR21.1, was 82.5 cm, 80.7 cm, 78.7 cm and 72.9 cm, respectively, compared with WT with a height of 68.2 cm.he plant height of low expression line, TR5.1 was 66.8 cm which was almost equal to the WT. he high expression lines also had increased leaf area (Fig. 4b) and the panicle length in the range of 20.4 cm and 19.2 cm, respectively (Fig. 4c), whereas medium expression lines such as, TR10.2, TR22.6, TR9.23 and TR23.14 ranged
Figure 2. Selection and Molecular screening of transgenic plants. (a) Germination of primary transformed
35 S: AtTOR seeds on PPT (10 mg/L) selection medium. PCR screening of transformants selected on PPT medium with (b) bar gene (550 bp) in T1 generation. M, λ.EcoRI-HindIII DNA Marker; PC, Positive Control;
NC, Negative Control, 1.9 transgenic plants. (c) Southern-blot hybridization analysis of T2 generation 35 S:
AtTOR (Lanes 1–10 represents line numbers TR2.24, TR15.10, TR10.2, TR22.6, TR5.1, TR17.6, TR21.1, respectively) plants were digested with the restriction enzymes AsiSI and ClaI and hybridized with the DIG-dUTP labeled bar gene probe.
from 14 cm to 17 cm and the low expression lines TR1.3, TR4.6, TR5.1, TR12.23, TR13.2, TR18.6 and TR21.1 ranged from 11 cm to 13 cm.
he number of tillers per plant in high expression lines, TR2.24, and TR15.10 was as high as 35, medium expression lines TR6.2, TR8.3, TR9.23 TR22.6 and TR10.2 had 20 to 30 tillers under limited water conditions while WT had 6–7 tillers. he number of productive tillers or panicles is a major factor that determines the overall
Figure 3. Semi-Quantitative and qRT-PCR analysis of AtTOR transgenic plants in T2 generation and expression analysis of TORC1 components. Rice actin (Act1) was used as an internal reference gene (a–c).
AtTOR speciic kinase was used to assess the transcript levels that ampliies only in AtTOR transgenic plants but not in WT rice (d–f). Based on the band intensity on the gel, lines TR5.1, TR18.6, TR12.23, TR1.3, TR4.6 and TR13.2 were considered as low expression lines. Lines TR6.9, TR4.11, TR8.3, TR8.7, TR11.3, TR11.9, TR10.2, TR6.2 TR19.1, TR9.23, TR22.6, TR16.8, TR7.9, TR14.1, and TR20.4 were considered as medium expression lines. Lines TR2.24, TR2.12, and TR15.10 were categorized as high expression lines. Line TR5.1 was used to normalize the expression pattern in (g,h) qRT-PCR. (i,j) he expression patterns of OsRaptor and OsLst8 were studied in one low, two medium and two high expression lines. he relative expression was considered statistically signiicant at P value < 0.05 (represented with asterisks) based on one-way ANOVA in all the analyzed genes.
yield of a plant. he high expression lines, TR2.24 and TR15.10 carried more than 30 productive tillers or panicles out of total 35 tillers while medium expression lines had 13 to 25 productive tillers. he yield and productivity in the two high expression lines of rice were more than that of WT grown with adequate water, suggesting that overexpression of TOR helps the plant in combating water deiciency and also plays a major role in maintaining or improving plant development and yield. he mean values of plant height (Fig. 4d), panicle length (Fig. 4e), the number of tillers (Fig. 4f), panicles (Fig. 4g) was plotted as histograms and these growth related parameters in diferent lines were detailed in Table 1.
Photosynthetic eiciency of PSII in transgenic plants.
he quantum yield of WT grown with ade-quate and limited water measured through MINI-PAM was in the range of 0.75–0.80 and 0.65, respectively while the quantum yield of the AtTOR rice transgenic plants grown under limited water conditions ranged from 0.65 in low expression lines to as high as 0.90 in high expression lines (Fig. 4h). Two transgenic lines, TR2.24, and TR15.10 had the highest quantum yield of 0.948 and 0.927, respectively while medium and low expressions linesFigure 4. Phenotypic characterization, Quantum eiciency, ∆13C analysis and Chlorophyll estimation in 35 S: AtTOR transgenic rice plants in T2 generation. (a) Phenotypic observations of high expression lines,
TR2.24, TR.15.10; medium expression line, TR10.20 with respect to WT grown under limited water conditions. (b) Variation in size of boot leaf and (c) Panicle length. Graphical representation of (d) plant height, (e) panicle length, (f) number of tillers and the (g) number of productive tillers observed under limited water conditions. (h) Quantum eiciency of PSII in transgenic plants was measured under water-limited conditions. High expression transgenic lines, TR2.24 and TR15.10, had the highest quantum yield of >0.90 (i) Transgenic plants TR2.24, and TR 15.10 had low ∆13C values of 17.02‰ and 17.4‰, respectively under limited water conditions
indicating their high WUE while WT grown under similar circumstances had a ∆13C value of 21.95‰. ∆13C
was analyzed using IRMS. (j) Chlorophyll-a, (k) Chlorophyll-b content, and l) total chlorophyll content in low (TR5.1), medium (TR10.2, TR22.6) and high (TR2.24, TR15.10) expression lines were measured before and ater growth of plants under limited water conditions. Mean values of chlorophyll data with ± SE represented with asterisks were considered statistically signiicant at P < 0.05.
ranged from 0.7 to 0.8 and 0.6 to 0.7, respectively indicating that AtTOR high expression lines were more photo-synthetically active compared with WT under water-limited conditions.
Carbon isotope (∆
13C) analysis.
he carbon isotope ratio 12C/13C (∆13C), is an important parameter toestimate the WUE of a plant, which is the amount of biomass produced per unit water transpired by the crop36.
Low ∆13C values represent higher WUE27,28. In naturally occurring genotypes, high WUE is always associated
with reduced biomass and yield, while in our study, we attempted to recombine the high yielding parameters under limited water availability. he high expression lines with higher biomass and yield had low ∆13C compared
with WT grown under limited water conditions, indicating signiicantly high WUE (Fig. 4i). Lines, TR2.24 and TR 15.10 had lowest ∆13C value of 17.04‰ and 17.419‰, respectively as against the WT with 21.95‰ and
23.914‰ grown under adequate and limited water conditions, respectively. he medium expression lines showed considerable variation in ∆13C ranging from 19.26‰ to 20.728‰. he low expression AtTOR line, TR5.1 had
highest ∆13C value, 24.295‰, which is almost at par with the WT. he photosynthetic quantum yield and ∆13C
values measured in low, medium and high expression lines were presented in Table 1.
Chlorophyll content in transgenic lines.
he content of Chl-a in high expression lines, TR2.24 and TR 15.10 grown with suicient water was observed up to 8 mg/g and 6 mg/g, respectively and this level was reduced ater three weeks of water limiting conditions to 5 mg/g and 4 mg/g of leaf tissue (Fig. 4j). he medium expression lines, TR10.2 and TR22.6 had Chl-a content of 4.8 mg/g and 3.6 mg/g before and 3.2 mg/g and 3 mg/g ater growth under water-limited conditions, respectively. he Chl-b content in high and medium expression lines was more than 3 mg/g and 2.5 mg/g before water stress while it was reduced to 2 mg/g and 1.5 mg/g, respectively (Fig. 4k) ater growth under water deicit conditions. he total chlorophyll content in high expression lines was also as high as 14 mg/g and reduced to 8 mg/g, whereas the total chlorophyll content in medium expression lines, was more than 7 mg/g and up to 5 mg/g before and ater growth under water-limited conditions (Fig. 4l). he reduction inS No. Line Name Plant height (cm)
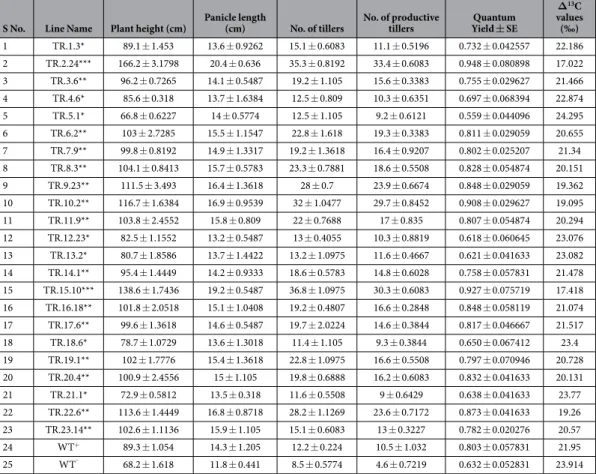
Panicle length (cm) No. of tillers No. of productive tillers Quantum Yield ± SE ∆13C values (‰) 1 TR.1.3* 89.1 ± 1.453 13.6 ± 0.9262 15.1 ± 0.6083 11.1 ± 0.5196 0.732 ± 0.042557 22.186 2 TR.2.24*** 166.2 ± 3.1798 20.4 ± 0.636 35.3 ± 0.8192 33.4 ± 0.6083 0.948 ± 0.080898 17.022 3 TR.3.6** 96.2 ± 0.7265 14.1 ± 0.5487 19.2 ± 1.105 15.6 ± 0.3383 0.755 ± 0.029627 21.466 4 TR.4.6* 85.6 ± 0.318 13.7 ± 1.6384 12.5 ± 0.809 10.3 ± 0.6351 0.697 ± 0.068394 22.874 5 TR.5.1* 66.8 ± 0.6227 14 ± 0.5774 12.5 ± 1.105 9.2 ± 0.6121 0.559 ± 0.044096 24.295 6 TR.6.2** 103 ± 2.7285 15.5 ± 1.1547 22.8 ± 1.618 19.3 ± 0.3383 0.811 ± 0.029059 20.655 7 TR.7.9** 99.8 ± 0.8192 14.9 ± 1.3317 19.2 ± 1.3618 16.4 ± 0.9207 0.802 ± 0.025207 21.34 8 TR.8.3** 104.1 ± 0.8413 15.7 ± 0.5783 23.3 ± 0.7881 18.6 ± 0.5508 0.828 ± 0.054874 20.151 9 TR.9.23** 111.5 ± 3.493 16.4 ± 1.3618 28 ± 0.7 23.9 ± 0.6674 0.848 ± 0.029059 19.362 10 TR.10.2** 116.7 ± 1.6384 16.9 ± 0.9539 32 ± 1.0477 29.7 ± 0.8452 0.908 ± 0.029627 19.095 11 TR.11.9** 103.8 ± 2.4552 15.8 ± 0.809 22 ± 0.7688 17 ± 0.835 0.807 ± 0.054874 20.294 12 TR.12.23* 82.5 ± 1.1552 13.2 ± 0.5487 13 ± 0.4055 10.3 ± 0.8819 0.618 ± 0.060645 23.076 13 TR.13.2* 80.7 ± 1.8586 13.7 ± 1.4422 13.2 ± 1.0975 11.6 ± 0.4667 0.621 ± 0.041633 23.082 14 TR.14.1** 95.4 ± 1.4449 14.2 ± 0.9333 18.6 ± 0.5783 14.8 ± 0.6028 0.758 ± 0.057831 21.478 15 TR.15.10*** 138.6 ± 1.7436 19.2 ± 0.5487 36.8 ± 1.0975 30.3 ± 0.6083 0.927 ± 0.075719 17.418 16 TR.16.18** 101.8 ± 2.0518 15.1 ± 1.0408 19.2 ± 0.4807 16.6 ± 0.2848 0.848 ± 0.058119 21.074 17 TR.17.6** 99.6 ± 1.3618 14.6 ± 0.5487 19.7 ± 2.0224 14.6 ± 0.3844 0.817 ± 0.046667 21.517 18 TR.18.6* 78.7 ± 1.0729 13.6 ± 1.3018 11.4 ± 1.105 9.3 ± 0.3844 0.650 ± 0.067412 23.4 19 TR.19.1** 102 ± 1.7776 15.4 ± 1.3618 22.8 ± 1.0975 16.6 ± 0.5508 0.797 ± 0.070946 20.728 20 TR.20.4** 100.9 ± 2.4556 15 ± 1.105 19.8 ± 0.6888 16.2 ± 0.6083 0.832 ± 0.041633 20.131 21 TR.21.1* 72.9 ± 0.5812 13.5 ± 0.318 11.6 ± 0.5508 9 ± 0.6429 0.638 ± 0.041633 23.77 22 TR.22.6** 113.6 ± 1.4449 16.8 ± 0.8718 28.2 ± 1.1269 23.6 ± 0.7172 0.873 ± 0.041633 19.26 23 TR.23.14** 102.6 ± 1.1136 15.9 ± 1.105 15.1 ± 0.6083 13 ± 0.3227 0.782 ± 0.020276 20.57 24 WT+ 89.3 ± 1.054 14.3 ± 1.205 12.2 ± 0.224 10.5 ± 1.032 0.803 ± 0.057831 21.95 25 WT¯ 68.2 ± 1.618 11.8 ± 0.441 8.5 ± 0.5774 4.6 ± 0.7219 0.632 ± 0.052831 23.914
Table 1. Phenotypic characterization, Quantum yield, and ∆13C values of low, medium and high AtTOR expression rice transgenic lines with respect to wild type. Phenotypic observations included, the number of
tillers, panicle length, productive tillers (seed yielding panicles) and plant height were recorded as the mean of 5 plants of the corresponding low, medium and expression line with respect to WT. Transgenic lines TR2.24, TR15.10, had highest seed yield under limited water conditions. Quantum yield of PSII was taken as the mean of three values, each measured at 15 d intervals ater growth of plants under limited water conditions. Carbon isotope analysis (∆13C) of low, medium and high expression transgenic lines ater six weeks of withdrawing
water along with WT. he high expression line, TR2.24 showed lowest ∆13C value. WT+; WT grown with
adequate water conditions, WT−; WT grown under limited water (High expression lines indicated as ***,
Chl content under water stress conditions is a commonly observed phenomenon37, but the medium and high
expression lines yet maintained suiciently high chlorophyll content even ater their growth under limited water conditions. he percent degradation of Chl-a, and -b was more in WT (50%) grown under limiter water availa-bility followed by low-expression lines (40–45%). he percent degradation in high expression lines were as low as 10–15% (Supplementary Fig. 2a,b).
Glucose-mediated activation of TOR.
Glucose is an important plant regulatory molecule and linked to TOR activation in Arabidopsis root meristem12,13. Reports have suggested that glucose increases the TOR activityby regulating the binding of v-ATPase to Rag-GTPases suggesting a link between regulation of TOR by sugars and amino acids38. High expression lines, TR2.24, and TR15.10 showed a maximum number of lateral roots 5 DAG
on glucose medium compared with the seedlings grown without glucose (Supplementary Fig. 3a,b). hese two lines grown without glucose showed signiicantly higher lateral roots with respect to WT grown with glucose. he transcript levels of the kinase domain of TOR gene in these two lines increased up to 40-fold in shoots and up to 90-fold in roots (Supplementary Fig. 3c,d). he TOR levels increased to more than 10-fold in both shoot and roots of transgenic lines and WT grown with glucose compared with transgenic plants and WT grown without glucose, suggesting that like amino acids, glucose also activates the transcription of TOR in rice.
ABA insensitivity of high AtTOR expression transgenic lines of rice.
ABA is a stress hormone, which has an important role in the plants response under stress conditions39. Under water stress conditions,stomatal closure is an immediate response, which is controlled by ABA40. he direct role of TOR gene in ABA
signaling under stress conditions is not yet studied, but the interaction of SnRKs and TOR has been reported41.
he SnRKs (Sucrose-non-fermenting-1-related protein kinase-1) are metabolic sensors for energy deiciency sig-nals42. he SnRK2 and SnRK3 are unique to plants and are also involved in plant response to several stresses43.
Overexpression of SnRK2 participates in ABA signaling, response to cold and drought tolerance44,45 and it also
transcriptionally upregulates several transcription factors and other stress responsive genes45. he seed
germi-nation assay of low, medium and high expression lines and WT on ABA (50 µM) showed that high and medium expression lines germinated and continued to grow normally indicating that they are insensitive to ABA treat-ment, whereas the low expression line along with WT was found to be sensitive to ABA. he germination rate of WT and transgenic lines grew on MS without ABA was 95% (Supplementary Fig. 3e). Whereas, the germi-nation rate of high (TR2.24) and medium (TR10.2) expression lines on ABA was more than 80% measured ater 3 and 5 DAG while the germination of WT and low expression line, TR5.1 was less than 40% on ABA (Supplementary Fig. 3f).
Transcriptional regulation of stress-speciic genes by AtTOR in high expression lines.
To deter-mine the role of AtTOR in the regulation of stress tolerance, we studied the expression pattern of genes speciic or common to two or more abiotic conditions in two high expression lines of AtTOR under both treated and untreated conditions. he expression pattern of these stress-speciic genes in untreated seedlings of high expres-sion lines was normalized with untreated seedlings of WT, whereas treated seedlings of high expresexpres-sion lines were normalized with treated WT seedlings so that the level of expression of stress-speciic genes in transgenic lines was due to the regulation by TOR gene.One week old seedlings of two high expression lines were subjected to three abiotic treatments; ABA, PEG and NaCl and the transcript levels of 15 stress-speciic genes have been characterized in the root and shoot tis-sues using qRT-PCR. We found that genes involved in osmotic protection such as OsDHODH1, OsNADPH1, OsSKIP1a, OsALDH2a, OsAOX1a, OsTPP1, OsLEA3-1, OsGL1-2, post-transcriptional modifications such as OsPP2C and OsSIK1 and drought responsive transcription factors such as OsNAC1, OsNAC2, OsWRKY72, OsDREB2B, OsbZIP23 were highly upregulated in high expression lines, TR2.24 and TR15.10 in both treated and untreated conditions. The level of expression was almost similar in shoot and root tissues of both the lines. hese results suggest the possible role of AtTOR in transcriptional regulation of stress-responsive genes (Supplementary Fig. 4).
Most of the genes analyzed in the AtTOR transgenic plants also showed some constitutive upregulation in untreated conditions except for the genes OsGL-2, OsSKIP-1a, OsAox-1a in the shoot tissues, while roots showed upregulation of these genes. However, the expression of all the genes became many fold upregulated in both shoot and root tissues in all the treatments, and this upregulation has been observed within 5 min treatment ater treat-ment. he levels of upregulation have been represented in the form of Heat Maps (Fig. 5).
he transcript level of OsDHODH1 in shoots of AtTOR lines TR2.24 and TR15.10 was up-regulated above 50-fold ater 24 h of PEG treatment, while under ABA and NaCl treatments, the OsDHODH1 transcript level was upregulated to 80 and 60-fold respectively ater 3 h ater the onset of the treatment. he transcript levels of OsNADPH1 in shoots and roots of high expression lines was signiicantly upregulated up to 90- and 110-fold respectively ater 3 h of NaCl treatment, while ater 24 h of ABA and PEG treatments in shoots and ater 6 h in roots, the mRNA level was more than 50 and 90–fold respectively. he OsSKIP1a, OsAOX1a, OsDHODH1, and OsALDH2 were upregulated more than 50-fold in shoots of high expression lines ater 24 h of PEG treat-ment, whereas OsPP2C, OsLEA3-1 showed increased transcript level up to 10-fold and OsNAC2 was upregu-lated up to 100-fold upregulation ater 6 h of PEG treatment in shoots. he transcription factors OsDREB2B and OsbZIP23 had 90 and 100-fold, respectively ater 3 h of PEG treatment in shoots while other such as OsNAC1 and OsWRKY72 were upregulated as early as 5 min ater immediate exposure to dehydration stress in shoots. he other genes such as OsLEA3-1 and OsNAC2 were upregulated up to 50-fold ater 6 h of PEG treatment in roots. PEG-induced the expression of OsPP2C up to 80, OsNADPH1 up to 60, OsNAC1 up to 87 ater 3 h of stress treat-ments. Under ABA treatment, OsPP2C, OsDREB2B, and OsNADPH1 were signiicantly upregulated up to 70-fold ater 24 h in the shoot, while the transcript levels of OsALDH2 were upregulated 20-fold and OsNAC1, OsNAC2,
OsSIK1, OsGL1-2, and OsbZIP23 were more than 25-fold ater 6 h of treatment in shoots. Similarly, the OsLEA3-1 and OsWRKY72 was upregulated ater 3 h of ABA treatment in shoots up to 8-fold in shoots. he root tissues of high expression lines, under ABA treatment, showed a transcript level of OsPP2C up to 96-fold immediately ater 5 min; OsDREB2B and OsbZIP23 up to 60-fold and 47-fold ater 24 h of treatment respectively, whereas OsNAC1and OsSKIP1a expression level was increased up to 9-fold and 33-fold ater 24 h of ABA treatment. In the roots of two high expression lines, genes such as OsALDH2, OsGL1-2 and OsNAC2 were highly regulated 6 h post treatment to ABA. he transcript level of OsNADPH1 in shoots and roots of both transgenic lines were signiicantly upregulated above 70-fold at 3 h ater 300 mM NaCl treatment.
Promoter and protein phylogenetic analysis of TOR.
he upstream 1500 bp regions of OsTOR and AtTOR were found to have multiple cis-regulatory elements that respond to plant signaling molecules and stress treatments. Sequence alignment of the two putative promoter elements of rice and Arabidopsis showed 45% nucleotide similarity, indicating the presence of similar motifs. Elements that respond to hormones such as ABA,Figure 5. Heat map depiction of stress-speciic genes in high expression lines of transgenic rice carrying AtTOR. he heat map was generated using GENE-E program to represent the transcriptional regulation of 15 stress-speciic genes in (a) untreated and ABA, PEG, NaCl-treated shoots and roots of high expression lines (b,c) TR2.24 and (d,e) TR15.10.
(ABRE), salicylic acid (TCA element), auxin (AuxRR) and methyl jasmonate (CGTCA and TGACG motifs) are distributed widely within the putative promoter of OsTOR. Also, heat stress responsive element (HSE) and two repeats of MYB binding sites, involved in drought-induced response are also present (Supplementary Fig. 5a,b).
he phylogenetic analysis of protein sequences derived from a diverse range of eukaryotes showed that TOR gene evolved from a possible common ancestor. All the three subspecies of rice were present on the same clade showing high similarity within the family. he TuTOR showed similarity with OsTOR, whereas ZmTOR and SbTOR exhibited high similarity with each other compared with OsTOR. he other members such as VrTOR and AdTOR belonging to Fabaceae, AtTOR and BnTOR belonging to Brassicaceae showed high similarity to the members of the same family (Supplementary Fig. 5c). he phylogenetic tree had been generated using MEGA7 program by the text neighbor joining tree option with a boot strap value of 1000.
Discussion
TOR is a multifunctional protein, with roles in the regulation of diverse signaling pathways. he AtTOR overex-pression and RNAi-mediated silencing directly inluenced Arabidopsis growth, seed yield, osmotic stress toler-ance, ABA and sugar sensitivity as well as polysome accumulation2,46. he overexpression of the AtTOR resulted
in increased biomass, shoot growth, leaf size, increased inlorescence size, seed production and resistance to metabolic and osmotic stresses1,2 while AtTOR disruption showed retarded shoot growth and root development
ater germination in Arabidopsis12–14,47.
TOR protein positively regulates biosynthetic pathways such as cell wall modiication, cell cycle, carbon and nitrogen utilization, photosynthesis and nutrient transport but negatively regulates catabolic processes such as autophagy and senescence47. Glucose-activated TOR signaling networks regulate a large number of conserved
chromatin modulators, signaling regulators, transcription factors and growth and stress-related proteins in eukaryotes and thereby helps in mitigating environmental stresses2,14.
Since the full-length sequence of OsTOR was not available at the initiation of this research activity, we have used the functionally characterized and available Arabidopsis AtTOR sequence and gene constructs to explore efects of ectopic expression of this heterologous but highly conserved plant representative TOR sequence in rela-tion to WUE in indica rice in the present study.
In the present study, the overexpression of AtTOR resulted in increased biomass and higher yield potential under limited water conditions. he plant biomass and yield have been in accordance with the level of AtTOR expression. An increase in AtTOR expression increased the biomass with high tillering, panicle length, panicle number and leaf area under limited water conditions, whereas, the low expression lines exhibited phenotypes similar to the WT plants, indicating that the TOR protein works in a dose-dependent manner, and its level of expression is directly linked to the phenotypes. he high AtTOR expression lines exhibited sustained or improved growth and productivity under limited water conditions compared with WT, which started wilting ater three weeks of water deicit conditions, suggesting that AtTOR has the potential to improved yield under limited water conditions.
Previous reports showed that yeast TORC1 activity inhibited in response to carbon, nitrogen, phosphate dei-ciency, high salinity, high temperatures and oxidative stresses48. his downregulation of TOR gene under stresses
is probably to slow down the energy consumption or nutrient uptake under stress conditions to extend the sur-vival of plants. In plants, TOR is negatively regulated by stress, but the high transcript levels of TOR in transgenic overexpression lines could likely maintain a balance in the normal growth even under stress conditions. Also, TOR mitigates the efects of stress by positively modulating the expression of multiple stress-speciic genes, which act concurrently in plants defense against various stresses.
he knowledge on the mechanism, signaling pathway and genes involved in TOR signaling in plants remain to be unravelled. he AtTOR overexpression lines exhibited increased primary roots to relieve the stress caused by excess nitrogen2. he ectopic expression of TOR regulatory component AtRaptor1 and TOR substrate AtS6K1,
which is sensitive to osmotic stress in tobacco increased osmotic stress tolerance by relieving AtS6K1 sensitivity49.
Our observations show that the transcript levels OsTOR regulatory elements; OsRaptor and OsLST8 increased with an increase in the level of AtTOR transcripts, likely indicating the function of TOR in regulation of its own machinery components. All plants have been reported to be insensitive to Rapamycin12,14,50, but maize seeds
were found to be sensitive to rapamycin18. he WT rice plants were germinated on four diferent concentrations
of Rapamycin from 20 µg/mL to 250 µg/mL, but the germination and growth were not afected at even higher concentrations, indicating the insensitivity of OsTOR to Rapamycin. his insensitivity was further conirmed by phosphorylation assay of S6K1, which is an immediate and direct downstream target of TOR in Rapamycin (200 and 250 µg/mL) treated WT rice seedlings. his Rapamycin insensitivity in rice might be due to improper Rapamycin- FKBP12 binding or structural changes in Os FKPB12. he overexpression of TOR protein or kinase domain alone in Arabidopsis and rapeseed resulted in increased WUE1,51,52. In our study, the high expression
lines, TR2.24 and TR15.10 exhibited ∆13C values as low as 17.02‰ and 17.41‰ under water deicit conditions
compared with WT grown under adequate (21.95‰) and limited water conditions (23.914‰). he low expres-sion lines, TR.5.1 had highest ∆13C value, 24.26‰ which is at par with WT. hese observations conirm the
critical role of TOR protein in enhancing WUE, which is also directly linked to its expression levels. AtTOR high expression lines also showed a high quantum yield of Photosystem II up to 94% under water deicit conditions compared to WT, which is around 68% while WT grown with adequate water supply showed 75–80% quantum yield of photosystem II. Drought stress induces considerable damage to the photosynthetic pigments, thus reduc-ing the photosynthetic eiciency and chlorophyll content of plants37. he chlorophyll content in AtTOR
trans-genic lines along with WT was decreased up to 50% ater three weeks of growth under water deicit conditions. However, the high and medium lines continued to maintain suiciently elevated levels of both Chl-a, and Chl-b indicating the minimal damage to chlorophyll and hence, chloroplasts. hese observations showed that high