HAL Id: hal-00318070
https://hal.archives-ouvertes.fr/hal-00318070
Submitted on 21 Dec 2005
HAL is a multi-disciplinary open access
archive for the deposit and dissemination of
sci-entific research documents, whether they are
pub-lished or not. The documents may come from
teaching and research institutions in France or
abroad, or from public or private research centers.
L’archive ouverte pluridisciplinaire HAL, est
destinée au dépôt et à la diffusion de documents
scientifiques de niveau recherche, publiés ou non,
émanant des établissements d’enseignement et de
recherche français ou étrangers, des laboratoires
publics ou privés.
substorm cycles: I. Observations of pulses in the
magnetopause reconnection rate
M. Lockwood, J. Moen, A. P. van Eyken, J. A. Davies, K. Oksavik, I. W.
Mccrea
To cite this version:
M. Lockwood, J. Moen, A. P. van Eyken, J. A. Davies, K. Oksavik, et al.. Motion of the dayside polar
cap boundary during substorm cycles: I. Observations of pulses in the magnetopause reconnection
rate. Annales Geophysicae, European Geosciences Union, 2005, 23 (11), pp.3495-3511. �hal-00318070�
SRef-ID: 1432-0576/ag/2005-23-3495 © European Geosciences Union 2005
Annales
Geophysicae
Motion of the dayside polar cap boundary during substorm cycles:
I. Observations of pulses in the magnetopause reconnection rate
M. Lockwood1,*, J. Moen2,**, A. P. van Eyken3, J. A. Davies1, K. Oksavik2,***, and I. W. McCrea1
1Rutherford Appleton Laboratory, Chilton, Didcot, Oxon OX11 0QX, UK
2Department of Physics, University of Oslo, P.O. Box 1048 Blindern, N-0316 Oslo, Norway
3EISCAT Headquarters, Kiruna, Sweden
*also at: Department of Physics and Astronomy, Southampton University, Southampton, Hampshire, UK
**also at: Arctic Geophysics, University Centre on Svalbard, N-9170 Longyearbyen, Norway
***also at: Johns Hopkins University, Applied Physics Laboratory, Laurel, MD, USA
Received: 11 July 2003 – Revised: 12 October 2005 – Accepted: 20 October 2005 – Published: 21 December 2005
Abstract. Using data from the EISCAT (European
Incoher-ent Scatter) VHF radar and DMSP (Defense Meteorological Satellite Program) spacecraft passes, we study the motion of the dayside open-closed field line boundary during two sub-storm cycles. The satellite data show that the motions of ion and electron temperature boundaries in EISCAT data, as re-ported by Moen et al. (2004), are not localised around the radar; rather, they reflect motions of the open-closed field line boundary at all MLT throughout the dayside auroral ionosphere. The boundary is shown to erode equatorward when the IMF points southward, consistent with the effect of magnetopause reconnection. During the substorm expan-sion and recovery phases, the dayside boundary returns pole-ward, whether the IMF points northward or southward. How-ever, the poleward retreat was much faster during the sub-storm for which the IMF had returned to northward than for the substorm for which the IMF remained southward – even though the former substorm is much the weaker of the two. These poleward retreats are consistent with the destruction of open flux at the tail current sheet. Application of a new analysis of the peak ion energies at the equatorward edge of the cleft/cusp/mantle dispersion seen by the DMSP satellites identifies the dayside reconnection merging gap to extend in MLT from about 9.5 to 15.5 h for most of the interval. Anal-ysis of the boundary motion, and of the convection veloci-ties seen near the boundary by EISCAT, allows calculation of the reconnection rate (mapped down to the ionosphere) from the flow component normal to the boundary in its own rest frame. This reconnection rate is not, in general, signif-icantly different from zero before 06:45 UT (MLT<9.5 h) – indicating that the X line footprint expands over the EISCAT field-of-view to earlier MLT only occasionally and briefly. Between 06:45 UT and 12:45UT (9.5<MLT<15.5 h) recon-nection is continuously observed by EISCAT, confirming the
Correspondence to: M. Lockwood
(large) MLT extent of the reconnection footprint deduced from the DMSP passes. As well as direct control by the IMF on longer timescales, the derived reconnection rate variation shows considerable pulsing on timescales of 2–20 min during periods of steady southward IMF.
Keywords. Ionosphere (Polar ionosphere) –
Magneto-spheric physics (Magnetopause, cusp and boundary layers; Storms and substorms)
1 Introduction
In a previous paper, Moen et al. (2004) studied various sig-natures of the dayside auroral oval, as seen by the EIS-CAT (European Incoherent Scatter) VHF incoherent scat-ter radar on 23 November 1999, with a view to evaluat-ing the best identifier of the open-closed field line bound-ary (hereafter referred to as the OCB). In this paper, we make use of their results to study the behaviour of the OCB during two successive substorm cycles on this day. In a separate study of the same interval, Davies et al. (2002) reported poleward-moving plasma concentration enhance-ments (“patches”) seen by EISCAT and by the CUTLASS HF radar at Hankasami. In the present paper, we analyse the boundary motions in terms of the reconnection rate vari-ations, at the dayside magnetopause and in the tail current sheet. In an accompanying paper (Lockwood et al., 2005, hereafter referred to as Paper II), we study the association of reconnection rate pulses with the formation of the polar cap patches.
1.1 Predicted open-closed boundary motions during the
substorm cycle
In the growth phase of a substorm, the total rate at which closed flux is opened by reconnection at the dayside
magnetopause 8Dexceeds the total rate at which open flux
is closed by reconnection in the nightside tail 8N. By
Fara-day’s induction law, 8D and 8N are the total reconnection
voltages associated with, respectively, the opening and clos-ing of flux tubes. As a result, the open flux Fpcincreases
ac-cording to the continuity equation (Siscoe and Huang, 1985; Moses et al., 1989; Lockwood et al., 1990; Lockwood and Cowley, 1992; Cowley and Lockwood, 1992)):
8D−8N =dFpc/dt = BidApc/dt . (1)
The ionospheric field Bi can be considered constant
be-cause the ionosphere is “incompressible” (in the sense that
Bi=5×10⁻⁵T to within of order 1%). In this paper we
de-fine the term “polar cap” to mean the region of open flux.
From Eq. (1), when 8D exceeds 8N the polar cap area,
Apc=Fpc/Bi, increases and these intervals are called
sub-storm growth phases. In the expansion phase and most of the
recovery phase of the subsequent substorm, 8D<8Nand by
Eq. (1), Fpcand Apc both decrease again.
How the dayside segment of the open-closed boundary (OCB) behaves during substorm cycles gives us information about how the shape of the polar cap varies as it expands and contracts. In the illustrative concepts introduced by Siscoe and Huang (1985), the polar cap was assumed to be circu-lar at all times, in which case the boundary motions would be the same throughout the dayside as well as on the night-side. The behaviour of the polar cap shape is a key factor de-termining the global, time-dependent convection response of the ionosphere to changes in the magnetopause reconnection rate. Freeman (2003) adopted the same assumption as Siscoe and Huang, whereas Lockwood and Morley (2004) included the perturbations to the shape of the polar cap proposed by Cowley and Lockwood (1992, 1997).
Expansion and contraction of the polar cap during sub-storm cycles has been reported in many observations (Aka-sofu et al., 1992; Frank and Craven, 1988; Moses et al., 1989; Lester at al., 1990; Milan et al., 2003). Several of these stud-ies employed global UV images and identified the OCB with the poleward edge of the auroral oval seen in UV: this can
substantially overestimate Apcbecause the true OCB can lie
considerably poleward of the poleward edge of the detectable aurora. This is particularly true on the nightside but also ap-plies, to a lesser extent, on the dayside (Elphinstone et al., 1992). Indeed, even with in-situ particle data, the OCB def-inition can be difficult (Lockwood, 1997a; 1998; Oksavik et al., 2000).
1.2 Observations interpreted as dayside open-closed
boundary motions during the substorm cycle
Burch (1973) observed the equatorward motion of the cusp precipitation for increasingly southward IMF and associated this motion with the Earthward erosion of the magnetopause caused by reconnection (Aubry, 1970). Statistically, the cusp
latitude has been shown to be a function of both the IMF Bz
component and the auroral electrojet AE index (Carbary and
Meng, 1988; Aparicio et al., 1991), showing an additional dependence on the processes in the geomagnetic tail.
The dayside 630-nm red-line aurora, associated with cusp/cleft magnetosheath electron precipitation, was also found to migrate equatorward after the IMF turned south-ward and return polesouth-ward when the IMF turned northsouth-ward and/or during a substorm expansion phase (Vorobjev et al.,
1975; Horwitz and Akasofu, 1977; Eather et al., 1979;
Rezhenov et al., 1979; Eather, 1985; Sandholt et al., 1983; 1998; Sandholt, 1988). McCrea et al. (2000) showed that the motions of the 630-nm aurora were matched by those of a band of enhanced electron temperature, as observed by the EISCAT VHF radar. Such boundary motions have also recently been reported in the Doppler-shifted Lyman-α emissions due to cusp proton precipitation (Lockwood et al., 2003). Freeman and Southwood (1988) observed enhanced flows consistent with the equatorward erosion of the dayside OCB during an interval when inward magnetopause erosion was observed. Lockwood et al. (1993b) reported a series of equatorward migrations of the dayside boundary that oc-curred in association with transient convection enhancements which they also interpreted as the effect of transient recon-nection pulses.
2 Observations
In this section, we consider observations made on 23 Novem-ber 1999, between 03:00 and 13:00 UT, by the Wind and ACE satellites in the interplanetary medium, by the EISCAT VHF radar, by the auroral electrojet magnetometers and by various DMSP (Defense Meteorological Satellite Program) spacecraft.
2.1 Interplanetary monitor data
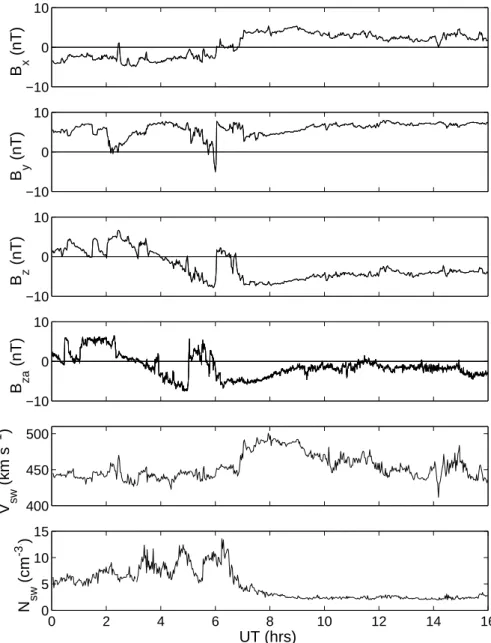
Figure 1 is an overview of the Interplanetary Magnetic Field (IMF) and solar wind data on 23 November 1999. We use data from the ACE and Wind spacecraft to predict the prop-agation delay between both satellites and the dayside mag-netopause, employing the procedure given in detail by Lock-wood et al. (2003). The variations in all three IMF com-ponents were very similar at the two craft despite the fact that ACE was near the Lagrange L1 point, whereas Wind was on the dawn flank of the magnetosphere; for example at
10:00 UT, Wind was at (X,Y,Z) of (–10.3, –59.9, 33.9) RE
in GSE coordinates. As discussed by Davies et al. (2002), the two spacecraft observed almost identical variations in all three IMF components, with a lag between ACE and Wind that is close to 60 min throughout the period. This implies that the changes in the IMF are all large-scale and oriented
at about 18◦with respect to the Y axis in the XY plane.
Us-ing this orientation, we derive a lag between Wind and the dayside magnetopause of –3 min (i.e. Wind sees the change 3 min after the dayside magnetopause). The top 3 panels of
Fig. 1 give the BX, BY and BZ components of the IMF in
−10 0 10 B x (nT) −10 0 10 B y (nT) −10 0 10 B z (nT) −10 0 10 B za (nT) 400 450 500 V sw (km s −1 ) 0 2 4 6 8 10 12 14 16 0 5 10 15 N sw (cm −1 ) UT (hrs) -3
Fig. 1. Summary of solar wind and Interplanetary Magnetic Field (IMF) observations on 23 November 1999. From top to bottom: the IMF components BX, BY and BZin the GSM coordinate system, observed by the WIND spacecraft; BZin the GSE frame observed by the ACE spacecraft; the solar wind speed, VSW, and concentration, NSW, observed by Wind.
almost identical to the corresponding components seen an hour earlier by ACE (data presented in Fig. 1 of Moen et al.,
2004). The fourth panel shows the BZcomponent of the IMF
in GSE coordinates, as seen by ACE, and the lower two
pan-els show the solar wind speed VSW and concentration NSW
seen by Wind.
Figure 1 shows that the IMF turned southward at about 04:00 UT at Wind (and almost simultaneously at Earth’s day-side magnetopause) and grew increasingly southward until about 06:00 UT when it turned abruptly northward before returning to consistently southward after 06:45 UT,
follow-ing a brief bi-polar oscillation. The IMF BY component
was positive throughout, except a brief negative excursion
while the IMF was northward, and the IMF BX component
changed from consistently negative to consistently positive around the interval of northward IMF. The solar wind speed VSWwas close to 440 km s−1for much of the period but rose
to 480 km s−1for a while after the period of northward IMF.
The solar wind concentration NSW oscillated over the range
5–10 cm−3 until near 07:00 UT when it fell to a constant
value near 2.5 cm−3.
2.2 Polar cap and auroral electrojet response
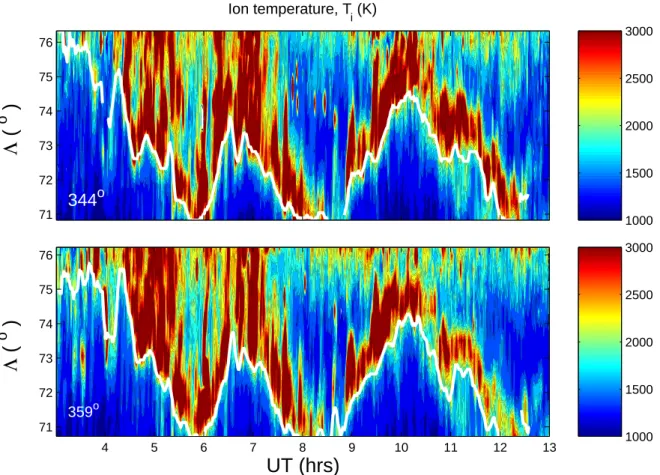
Figure 2 shows the ion temperature observed by the EIS-CAT VHF radar, operating in the CP-4-B experiment mode. In this mode, the radar observes simultaneously along two
beam directions: beam 1 is at an azimuth 344◦east of
1000 1500 2000 2500 3000
344
o Ion temperature, T i (K)Λ
(
o)
71 72 73 74 75 76 1000 1500 2000 2500 3000 359oUT (hrs)
Λ
(
o)
4 5 6 7 8 9 10 11 12 13 71 72 73 74 75 76Fig. 2. One-min resolution observations on 23 November 1999 by the EISCAT VHF radar operating in the CP-4-B spilt-beam mode. Ion temperature, Ti, is colour contoured as a function of UT and invariant latitude, 3, for (top) beam 1 (344◦east of geographic north and
perpendicular to the L-shells) and (bottom) for beam 2 (359◦east of geographic north). The white lines in each case show 5-point running means of the invariant latitude where Ti=2000 K on the equatorward edge of the high Tiband.
beam 2 is at an azimuth 359◦east of geographic north. Both
beams are at an elevation of 30◦. Data are recorded every
10 s, but all data used in the present paper have been post-integrated into 1-min periods to reduce observation errors. Radar range gates are 65 km in extent along the beam, cov-ering approximately 50 km in the field-perpendicular plane
(13≈0.5◦). The invariant latitude (3)–MLT coordinates
of the radar range gates depend on the beam direction, the range and the universal time (UT). At UT of t hours, the mag-netic local time (MLT) of all beam 1 gates is (t+2.75) h. For
beam 2, the MLT is (t+3) h at 3=70.8◦, rising to (t+4) h at
3=78.1◦.
In Fig. 2, the observed ion temperature, Ti, is colour
con-toured as a function of UT and invariant latitude, 3, for beam 1 (top) and for beam 2 (bottom). The white lines in
both panels show the invariant latitudes of the Ti=2000 K
contours on the equatorward edge of the high Ti band: in
both cases, a 5-point running mean has been applied to the 1-min resolution EISCAT boundary data employed in this paper. This smoothes out faster fluctuations in the bound-ary location and also the quantum jumps in the latitudes caused by the range gating of the radar data. Both beams saw a band of high ion temperatures, which moved back
and forth in latitude across the radar field-of-view (f-o-v). Similar bands have been seen moving poleward nearer dawn and dusk caused by polar cap contractions during substorm expansions (Lockwood et al., 1988; Fox et al., 1994), but such repetitive motions around noon have not been observed
before. The gap in the high-Ti band between 08:00 and
08:50 UT is attributed by Moen et al. (2004) to the effect of enhanced neutral winds driven by the persistent westward ion flow. This effect is discussed in greater detail in Paper II. The variations of other parameters observed by EISCAT have been presented by Moen et al. (2004).
Figure 3 analyses these boundary motions in the context of the observed variations in the IMF and the auroral
elec-trojet. The top panel shows the IMF BZ component (in the
GSM frame), as observed by Wind, lagged (by –3 min) to the predicted time of arrival at the dayside magnetopause. In all three panels of Fig. 3 (and in several of the subse-quent figures), intervals of northward IMF are shaded grey. The middle panel shows the response of the auroral electro-jet, quantified by the AL auroral electrojet index. Two sub-storms can be seen in the interval shown. During the first, AL fell to near –400 nT but this decrease ended at the same time as the abrupt northward turn of the IMF. During the second
23rd November, 1999 B z (nT) −5 0 5 AL (nT) −1000 −800 −600 −400 −200 0 DMSP azimuth 1 azimuth 2 Λ ( o ) UT (hrs) 3 4 5 6 7 8 9 10 11 12 13 70 72 74 76
Fig. 3. (Top) The BZ component of the IMF in the GSM coordinate system, observed by the WIND spacecraft, lagged by the predicted
propagation time from the satellite to the dayside magnetopause. (Middle) The auroral AL index. (Bottom) The latitude of the polar cap boundary determined from (in blue) beam 1 (azimuth 344◦E of N, along the geomagnetic meridian) and (in red) beam 2 (azimuth 359◦E of N, along the geographic meridian) of the EISCAT VHF radar operated in the CP-4-B mode (as shown in Fig. 2). The black points are the open closed boundary intersections seen by DMSP satellites at an MLT within 1.5 h of that of beam 1 of the EISCAT radar. The areas shaded grey are northward IMF and the vertical dot-dashed lines mark the expansion/recovery phases of the larger substorm.
substorm, AL fell to near –900 nT and the IMF remained negative at all times. The times of onset and full recovery for this second substorm are marked (in all three panels of Fig. 3 and in some subsequent figures) by vertical dot-dashed lines.
The bottom panel of Fig. 3 shows the invariant latitude of the equatorward edge of the persistent band of high ion tem-peratures, as shown by the white lines in Fig. 2. Moen et al. (2004) demonstrated that this boundary had a consistent, and relatively small, offset with respect to the inferred open-closed boundary (OCB). By comparing with particle data recorded during close conjunction passes by DMSP satel-lites, these authors found that the best estimates of the OCB latitude from the EISCAT data were made using the gradient of the electron temperature (Te)data (as used, for example,
by McCrea et al., 2000) and that these were slightly equator-ward of the equatorequator-ward edge of the band of very high ion
temperatures. However, this Teboundary was not always
de-tectable on this day, unlike that in Ti. It is noticeable that the
enhanced Tevalues in the band are often smaller than the Ti
values: at such times the electron gas was being heated by the ion gas through the conduction term in the thermal bal-ance equation and ion heating by enhbal-anced flows is dominat-ing over electron heatdominat-ing by sheath electron precipitation. In addition, in Paper II we discuss how there are also large fluc-tuations in Teassociated with the plasma concentration
vari-ations caused by the passage of polar cap patches. These two factors often rendered the boundary much harder to define in
Te than in Ti on this day. Moen et al. (2004) demonstrated
most of the high-Tiband was caused by fast westward flow of
newly-opened field lines under the magnetic curvature force,
and thus was associated with the observed positive IMF BY
(e.g. Cowley et al., 1991a): only near dawn was the
equator-ward part of the high-Ti band found to be on eastward
(sun-ward) flow. The gap between the inferred OCB latitude (from
the satellite data and the EISCAT Te measurements) is
re-duced to of order one radar range gate if a lower ion temper-ature threshold is used. We here adopted a value of 2000 K, which is the lowest which consistently identifies the high-Ti band and which is sufficiently elevated above the inferred
exospheric neutral temperature (approximately 1300 K). The solid points in the bottom panel of Fig. 3 show the OCB location found using DMSP satellite passes for which the boundary was intersected at an MLT that was within 1.5 h of beam 1 of the EISCAT radar. The identification of the OCB in the DMSP data is discussed in the following
sec-tion. The comparison confirms that the Ti=2000 K threshold
is close to the OCB location.
The behaviour of the boundary latitude, as seen by both radar beams, is consistent with polar cap expansion and con-traction during the substorm cycle. After the southward IMF turning near 04:00 UT, the boundary expanded equatorward, consistent with equatorward erosion by magnetopause recon-nection and the production of newly-opened flux. This ex-pansion continued when the first weak substorm commenced
b). B
Z> 0; B
Y> 0; AL << 0
c). B
Z< 0; B
Y> 0; AL << 0
a). B
Z< 0; B
Y> 0; AL ≈ 0
Fig. 4. Schematic of polar cap expansions and contractions. Lines with arrows are flow streamlines, thick solid lines are adiaroic (non-reconnecting) open closed field line boundary and dashed lines are footprints of the active dayside and nightside reconnection sites (in the magnetopause and cross-tail current sheet, respectively). Open arrows show the motion of the open-closed boundary. (a) Growth phase with IMF Bz<0, BY>0, and AL≈0. (b) Expansion-recovery
phase with northward IMF: BZ>0, BY>0, AL 0. (c) Expansion-recovery phase with southward IMF: BZ<0; BY>0; AL 0.
because the IMF became increasingly southward. When the IMF turned northward near 06:00 UT, the substorm activ-ity peaked with AL near –400 nT and the boundary returned
poleward. The brief bipolar oscillation in IMF Bz was
re-flected in a brief equatorward and then poleward bound-ary motion, before a consistent equatorward erosion was re-established under steady and strongly southward IMF. The equatorward erosion ended with the onset of the second, stronger substorm (AL falling to –900 nT) and the bound-ary subsequently relaxed poleward throughout the expansion and recovery phase, despite the continuing southward IMF orientation. The poleward motion in this second substorm is slower than in the first, despite the lower AL, presumably because the loss of open flux by tail reconnection was par-tially cancelled by ongoing open flux generation associated with the southward IMF. When AL returned to quiet values, the polar cap began to expand equatorward again. Figure 4 shows schematically the boundary motions and ionospheric convection predicted using the concepts of ionospheric flow excitation developed by Siscoe and Huang (1985), Lock-wood et al. (1990) and Cowley and LockLock-wood (1992, 1997). The flow patterns are for the northern hemisphere and IMF BY>0, those being the conditions which apply during the
in-terval discussed here, giving westward flow on newly-opened field lines in the northern hemisphere (Greenwald et al., 1990; Cowley et al., 1991a). Figure 4a applies to the growth phases, whereas Fig. 4b is for the first substorm when the IMF has turned northward, and Fig. 4c applies to the second substorm expansion during which the IMF remains south-ward. Note that in parts a and b of Fig. 4, the dawn convec-tion reversal boundary is shown as being slightly poleward of the OCB, as found during the northward-IMF dawn passes by DMSP satellites (for example, see Fig. 3 of Moen et al., 2004, Fig. 13 of the present paper, and Fig. 4b of Paper II) .
2.3 DMSP particle observations
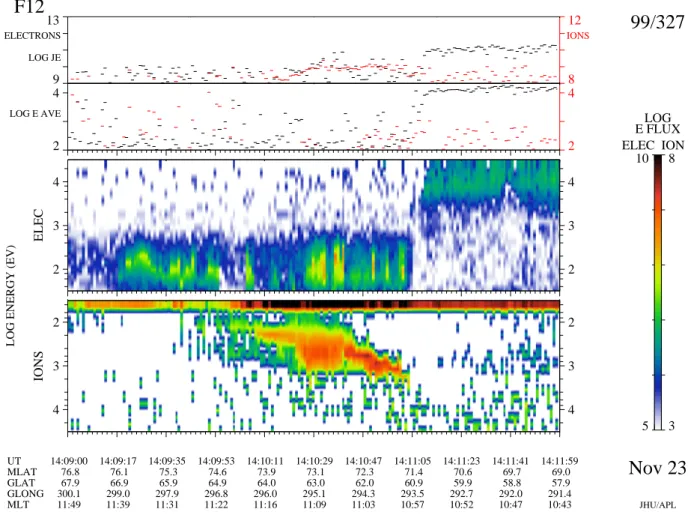
We here make use of the electron and ion precipitation ob-served by DMSP satellites to identify the OCB and also whether or not reconnection is ongoing at that OCB. Figure 5 is an example where all features agree on the OCB loca-tion during an equatorward pass of DMSP F12. These fea-tures, observed around 14:11:05 UT (and near 11:00 MLT), are: 1.) a low latitude edge to sheath-like (<1 keV) elec-tron precipitation, seen in the elecelec-tron spectrogram; 2.) a low latitude edge to sheath-like (<3 keV) ion precipitation, seen in the ion spectrogram; and 3.) a high-latitude edge to magnetospheric (>1 keV) electrons. In general, we find the third of these to be the least reliable of the indicators (see below). However, in this case, in addition to the persed appearance of the sheath ions in the cusp, the dis-appearance of the magnetospheric electrons was dispersed with the highest energy particles disappearing first (at the lowest latitude for these poleward-moving field lines and thus seen last by this equatorward-moving satellite). This electron dispersion reveals that reconnection was ongoing at the part of the OCB intersected. The ion dispersion in this
9 13 8 12 LOG JE ELECTRONS IONS 2 4 2 4 LOG E AVE 2 3 4 ELEC 2 3 4 2 3 4 IONS 2 3 4 UT 14:09:00 14:09:17 14:09:35 14:09:53 14:10:11 14:10:29 14:10:47 14:11:05 14:11:23 14:11:41 14:11:59 MLAT 76.8 76.1 75.3 74.6 73.9 73.1 72.3 71.4 70.6 69.7 69.0 GLAT 67.9 66.9 65.9 64.9 64.0 63.0 62.0 60.9 59.9 58.8 57.9 GLONG 300.1 299.0 297.9 296.8 296.0 295.1 294.3 293.5 292.7 292.0 291.4 MLT 11:49 11:39 11:31 11:22 11:16 11:09 11:03 10:57 10:52 10:47 10:43
F12
99/327
Nov 23
LOG ENERGY (EV)
JHU/APL 5 10 3 8 ELEC ION E FLUXLOG
Fig. 5. Particle observations during a pass by the DMSP-F12 satellite through the open-closed field line boundary on 23 November 1999. The top two panels give the integral energy flux and average energy of down-going electrons (in black) and ions (in red). The lower two panels show electron and ion spectrograms: the differential energy flux (in cm−2s−1sr−1)is contoured on a log scale as a function of observation time and energy. Note that the energy scale is inverted (i.e. energy increases down the page) for the bottom panel (for ions). For each UT, the geomagnetic latitude (MLAT), geographic latitude (GLAT), geographic longitude (GLONG) and magnetic local time (MLT) of the spacecraft are given. This example shows a pass through an active reconnection X-line footprint in the pre-noon sector near 11:00 MLT (see text for details).
case extends to higher energies (giving differential energy fluxes exceeding 107cm−2s−1sr−1at energies above a 1 keV threshold). The highest ion energies were observed on the most recently reconnected field lines (Lockwood, 1995) and will only be seen if the reconnection is ongoing at the MLT where the OCB is intersected. This is because the supply of the more energetic ions is quickly shut off as the field line evolves away from the reconnection site (Lockwood, 1997b). Observing (field-aligned) fluxes of sheath ions of energy exceeding E that are significantly greater than the noise level (we here adopt a threshold of 107cm−2s−1sr−1) tells us that reconnection took place within the previous
in-terval of δt=d(m/2E)1/2, where m is the ion mass and d is
the field-aligned distance from the magnetopause X-line to the ionosphere. For protons with E≥1 keV and a typical d
of 20 RE, δt ≤5 min and for a typical convection speed of
V=1 kms−1, this places the satellite within about 300 km of the reconnection site. One last feature to note is that the dispersion curve seen in the lowest energy sheath ions (the
low-energy time-of-flight ion “cut-off”) is not smooth but shows small fluctuations. Such features are often accompa-nied by poleward-moving ionospheric events, in which case they are caused by small, short-period reconnection rate vari-ations (Cowley et al., 1991b, Lockwood and Smith, 1992; Newell and Meng, 1991; Escoubet et al., 1992; Lockwood et al., 1993a, Lockwood and Davis, 1995; 1996; Pinnock et al., 1995; Farrugia et al., 1998; Morley and Lockwood, 2003; Oksavik et al., 2004). Cusp ion steps originating from purely spatial variations in reconnection rate are not accom-panied by poleward-moving events (Lockwood, 1996). Pa-per II discusses poleward-moving events seen by EISCAT in close conjunction to the cusp ion steps discussed here and we conclude that they therefore reveal temporal variations in reconnection rate.
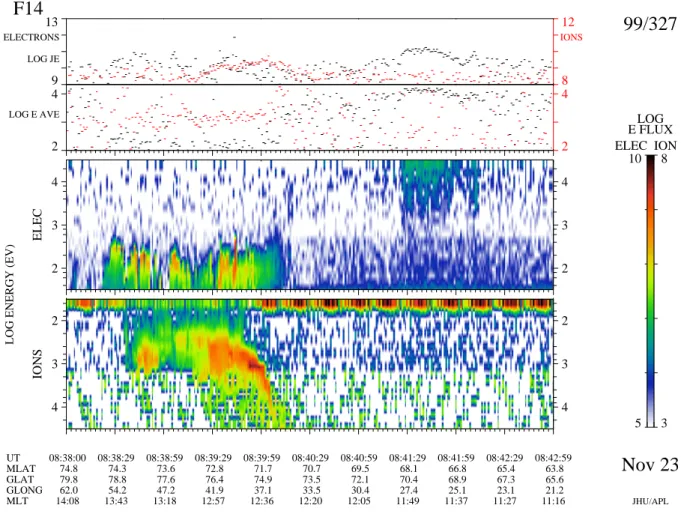
Figure 6 presents a second example of ongoing, pulsed re-connection (by the above criteria) taking place at the OCB observed by the DMSP F14 satellite at 08:40:15 UT and 12:30 MLT. In this case, the sheath particle precipitation
9 13 8 12 LOG JE ELECTRONS IONS 2 4 2 4 LOG E AVE 2 3 4 ELEC 2 3 4 2 3 4 IONS 2 3 4 UT 08:38:00 08:38:29 08:38:59 08:39:29 08:39:59 08:40:29 08:40:59 08:41:29 08:41:59 08:42:29 08:42:59 MLAT 74.8 74.3 73.6 72.8 71.7 70.7 69.5 68.1 66.8 65.4 63.8 GLAT 79.8 78.8 77.6 76.4 74.9 73.5 72.1 70.4 68.9 67.3 65.6 GLONG 62.0 54.2 47.2 41.9 37.1 33.5 30.4 27.4 25.1 23.1 21.2 MLT 14:08 13:43 13:18 12:57 12:36 12:20 12:05 11:49 11:37 11:27 11:16
F14
99/327
Nov 23
LOG ENERGY (EV)
JHU/APL 5 10 3 8 ELEC ION E FLUXLOG
Fig. 6. Same as Fig. 5, showing a noon pass of DMSP-F14 through the footprint of an active reconnection site near 12:30 MLT.
edges agree, but sufficient fluxes of magnetospheric electrons were absent in the outer closed field line region and thus only the slightest hint of a magnetospheric electron edge can been seen at the OCB inferred from the sheath particles. Because there were magnetospheric electrons at lower latitudes, an
edge is seen 3◦of invariant latitude equatorward: however,
close inspection reveals that the highest energies disappear last (as the field lines propagate poleward) and thus this is not an OCB signature but is caused by the past history of en-ergetic magnetospheric electron injection by substorms. We conclude that the high-latitude edge of magnetospheric elec-trons is not always a reliable OCB indicator. As in the previ-ous example, ion fluxes exceeding 107cm−2s−1sr−1extend to energies above a 1 keV threshold and there are small cusp ion steps in the low-energy cut-off dispersion, We again in-terpret these facts as showing, respectively, that reconnection was taking place locally at the observed OCB and that the local reconnection rate was pulsed, with short intervals of lower or zero reconnection rate.
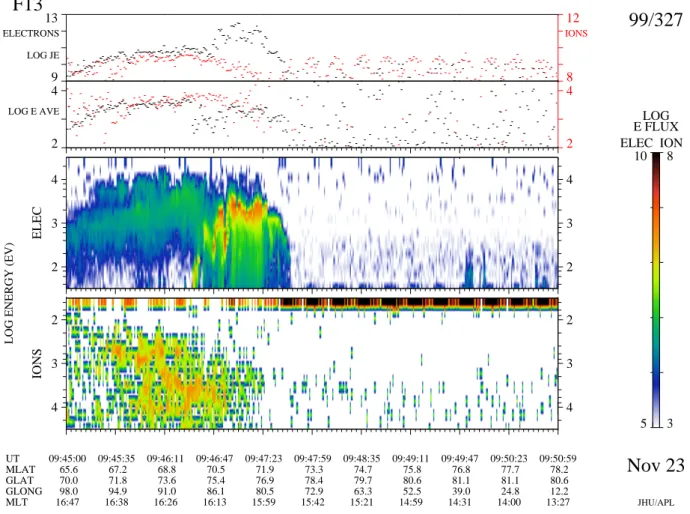
Figure 7 is an example of a pass from closed to open field lines by DMSP F13 where no sheath plasma is observed. The best estimate of the OCB intersection is at 09:47:35 (near 15:50 MLT). In this case, a strong inverted-V electron pre-cipitation feature was seen up to the poleward edge of the
magnetospheric electron precipitation, poleward of which the precipitation is typical of the polar cap. Such a boundary is here taken to be a signature of a non-reconnecting OCB as the satellite moves from closed field lines onto field lines that have been open for a sufficiently long interval for all cusp/mantle precipitation to have ceased. The broad band of inverted-V precipitation is consistent with region-1 upward currents just equatorward of the OCB.
The last example presented here (Fig. 8) is an OCB inter-section made by DMSP F13 at 09:55:54 UT (09:20 MLT). In this case, there is some suggestion of a high-latitude edge of magnetospheric electrons, but this boundary is not well
defined. Two brief bursts of sheath electrons were seen,
bounding a region of almost undispersed ion precipitation. We interpret this as a cusp pass where flow streamlines were close to perpendicular to the satellite path. This is consistent with the flow schematics sketched for this interval in Fig. 4 and by Moen et al. (2004). At the equatorward edge of the sheath ion precipitation, no significant fluxes were observed above 1 keV and thus, although the field lines observed were opened sufficiently recently for sheath ions to be present, the most recently-opened field lines were not observed and we infer that the OCB intersected was not reconnecting locally (from the discussion above, within about 300 km).
9 13 8 12 LOG JE ELECTRONS IONS 2 4 2 4 LOG E AVE 2 3 4 ELEC 2 3 4 2 3 4 IONS 2 3 4 UT 09:45:00 09:45:35 09:46:11 09:46:47 09:47:23 09:47:59 09:48:35 09:49:11 09:49:47 09:50:23 09:50:59 MLAT 65.6 67.2 68.8 70.5 71.9 73.3 74.7 75.8 76.8 77.7 78.2 GLAT 70.0 71.8 73.6 75.4 76.9 78.4 79.7 80.6 81.1 81.1 80.6 GLONG 98.0 94.9 91.0 86.1 80.5 72.9 63.3 52.5 39.0 24.8 12.2 MLT 16:47 16:38 16:26 16:13 15:59 15:42 15:21 14:59 14:31 14:00 13:27
F13
99/327
Nov 23
LOG ENERGY (EV)
JHU/APL 5 10 3 8 ELEC ION E FLUXLOG
Fig. 7. Same as Fig. 5, showing a dusk pass of DMSP-F13 through the footprint of an adiaroic (non-reconnecting) open-closed boundary near 16:00 MLT. Note that no sheath-like precipitation was observed.
All the dayside passes by DMSP satellites on 23 Novem-ber fell into one of the classes defined by the examples pre-sented in this section. Thus in each case, an OCB location was defined and, using the 1-keV threshold for any sheath ion fluxes as discussed above, we classified the boundary as either “reconnecting” or “adiaroic” (non-reconnecting). Fig-ure 9 shows the dayside OCB crossings between 00:00 and 16:00 UT on an invariant latitude – MLT plot. The red tri-angles and black squares are for, respectively, reconnecting and adiaroic OCB classifications. It can be seen that the re-connection was consistently seen between about 09:00 and 15:30 MLT: there is some indication of small merging gap extent variations, but this appears to have been a relatively stable reconnection region over the entire interval. The OCB crossings to the dusk side of the merging gap were consis-tently of the form shown in Fig. 7, whereas those to the dawn side were like that shown in Fig. 8. This is consistent with the sheath plasma cusp/mantle plume being angled toward
dawn by the strong positive IMF BY component (Cowley et
al., 1991a). The inverted-V events, seen in the electron data from the dusk sector (Fig. 7) are consistent with the region-1 upward currents, equatorward of the OCB.
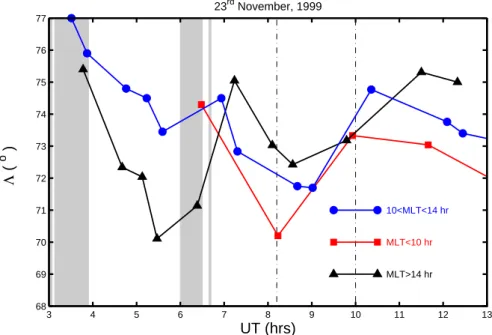
Figure 10 analyses the latitudinal variation of these
in-ferred OCB locations. The OCB intersections are
di-vided into three local time sectors, MLT≤10 h (red squares), 10<MLT≤14 h (blue circles), and MLT>14 h (black trian-gles). From Fig. 9, all observations in the middle category relate to reconnecting OCB segments. To some extent, the behaviour observed by EISCAT (Fig. 3, bottom panel) is seen in all three MLT sectors, with equatorward erosion when the IMF is southward, interrupted by the two substorm expan-sion/recovery phases when the boundary returns poleward. The motions are largest in amplitude in the dusk sector, and similar for the noon and dawn sectors. This clearly demon-strates that the equatorward and poleward motions seen by EISCAT do indeed reflect motions of the open closed bound-ary throughout the dayside.
2.4 EISCAT velocity data
The top panel of Figure 11 shows the orientation of the
Ti=2000 K contour, deduced from the points where it
inter-sects the two beams of the EISCAT CP-4-B experiment. The angle δ is presented, which is the angle that the contour (and the OCB that is thought to be close to and parallel to this
9 13 8 12 LOG JE ELECTRONS IONS 2 4 2 4 LOG E AVE 2 3 4 ELEC 2 3 4 2 3 4 IONS 2 3 4 UT 09:53:00 09:53:23 09:53:47 09:54:11 09:54:35 09:54:59 09:55:23 09:55:47 09:56:11 09:56:35 09:56:59 MLAT 78.0 77.6 77.1 76.5 75.8 75.0 74.2 73.2 72.3 71.2 70.2 GLAT 76.4 75.4 74.2 73.1 71.8 70.6 69.4 68.1 66.8 65.4 64.1 GLONG 341.6 337.9 334.6 331.8 329.3 327.1 325.2 323.4 321.9 320.3 319.0 MLT 11:24 11:02 10:41 10:23 10:06 09:50 09:37 09:24 09:13 09:02 08:53
F13
99/327
Nov 23
LOG ENERGY (EV)
JHU/APL 5 10 3 8 ELEC ION E FLUXLOG
Fig. 8. Same as Fig. 5, showing a dawn pass of DMSP-F13 through the footprint of an adiaroic (non-reconnecting) open-closed boundary near 09:00 MLT. Note that sheath-like precipitation was observed, but ion energies near the open-closed boundary did not exceed 1 keV.
contour) made with the magnetic L-shells (a positive δ being defined as the OCB being oriented north-east to south-west with respect to the L-shell). In general, the inferred OCB was
close to L-shell aligned, but perturbations between –20◦and
+30◦were observed. The angle δ is computed using the
5-point running means of boundary latitudes shown in Figs. 2 and 3. During periods of southward IMF δ was generally positive, at least up until about 10:00 UT. For this morning sector data this corresponds to the boundary being further poleward near noon, which is consistent with the expected orientation of the auroral oval. During 10:00–11:00 UT the boundary is very close to L-shell-aligned, and after 11:00 UT there was a growing tendency for negative δ, consistent with the expected orientation of the auroral oval for the afternoon sector. There are several major perturbations to this trend, including two large negative excursions in δ that occur in the morning sector when the IMF turns northward.
The lower two panels of Fig. 11 show the line-of-sight ve-locities (V1and V2, defined as positive away from the radar) observed along beams 1 and 2 for the range gate closest to,
yet poleward of, the Ti=2000 K contour. As for the boundary
latitudes and orientation, a 5-point running mean has been applied to the 1-minute resolution V1and V2data. These two
velocities are combined in order to generate components of the plasma flow using the beam-swinging technique, as mod-ified by Fox et al. (2001). Essentially, it is assumed that the flow is constant between the two beams along lines parallel to the OCB (as opposed to along L-shells which is the as-sumption that has often been made in the past). Four compo-nents of field-perpendicular convection are derived, VN, VW
and V⊥N and V||W: VNand VW are the northward and
west-ward components in geomagnetic coordinates (i.e., respec-tively perpendicular to and parallel to the L-shells); V⊥N is
the northward component perpendicular to the OCB bound-ary, i.e. in a direction that makes an angle (δ+π /2) with re-spect to the L-shells, and V||W is the westward flow parallel
to the OCB. Because beam 1 points normal to the L-shells V1=VN cos(ε)+V||sin(ε), where V|| is the field parallel
ve-locity and ε is the elevation angle between the beam and the plane normal to the field lines: the second term can be
ne-glected because both V|| and ε are small, and thus V1≈VN
cos(ε). There are, of course, errors introduced into the vector flow data by the beamswinging assumption (Freeman et al., 1991): however, in this paper we are mainly concerned with
the component of flow across the OCB, V⊥N, which is very
65 8 20 10 22 12 0 14 2 16 4 18 6
Fig. 9. MLT-invariant latitude (3) plot of the locations of all of the open-closed boundary crossings observed by the DMSP satellites between 03:00 and 13:00 UT on 23 November 1999. 12:00 MLT is at the top of the plot and concentric circles are for 3 of 65(5)85◦. The red triangles are for active reconnection footprints (identified by sheath electron and ion precipitations with ion energies near the boundary exceeding 1 keV). Black squares are for non-reconnecting (adiaroic) open-closed boundary crossings.
is very accurately measured because it is so closely related
to V1and thus beamswinging errors are not a major concern.
Note however, that the V⊥N variation shown in Fig. 12 is
nevertheless different to that in V1 (middle panel Fig. 11),
the difference being the effect of the variations in the OCB orientation δ.
An analysis of the errors in the radar line-of-sight veloc-ity determination was made by Williams et al. (1996). These authors exploited a previous version of the radar mode used here (CP-4-A), in which the same radar pulse modulation was transmitted on several adjacent frequencies simultane-ously: by taking the standard deviation of the l-o-s velocity measured at different frequencies, the measurement uncer-tainty was quantified. The error depends on the signal-to-noise ratio of the data, as expected, and for the values ob-served on the day studied here, the estimated uncertainties
are everywhere smaller than ±100 ms−1, which we here take
to be the error in VN, εV N. Usually, the angle δ is near zero
so VN≈V⊥N; however, the effect of non-zero δ depends on
the prevailing flow along the L-shells. Because of the
de-pendence on the observed VWand δ, the uncertainty for each
V⊥Nvalue has to be evaluated separately, using εV Nand an
uncertainty in δ which corresponds to one range gate across the separation of the two beams at the 3 in question. For the interval studied, 97% (the 2σ level) of the error values obtained, εV ⊥N, were smaller than 140 ms−1.
Because we are most interested in the poleward flow
across the boundary, which is largely determined by V1, we
here ascribe the velocity measurements to the MLT of beam 1 (i.e., at UT of t h, the MLT is t+2.75 h).
Figure 12 shows (in black) the V⊥N derived from the
5-point running means of V1, V2and δ. The mauve line shows
the boundary velocity VB in the same direction (i.e.
north-ward, normal to the boundary) derived for the Ti=2000 K
contour motion shown in Figs. 2 and 3c. It can be seen that for most of the time before 06:45 UT, there is considerable agreement between the two, despite great variability in both. The uncertainty in the boundary velocity corresponds to one range gate (50 km) over the 5-min smoothing timescale used,
giving εV B≈170 ms−1. After 06:45 UT, V⊥N was
consis-tently greater than VB. When V⊥N=VB, the plasma and
frozen-in field were moving with the boundary, but not across it: the boundary segment was “adiaroic” and no reconnec-tion was taking place at the MLT observed. When V⊥N>VB,
the plasma and field were flowing poleward into the bound-ary, the effect of magnetopause reconnection generating new open flux. Thus EISCAT did not see much reconnection un-til 06:45 UT, after which it consistently observed ongoing reconnection. This was the UT at which the radar field of view moved to about 09:30 MLT, which was near the end of the reconnection merging gap deduced from the ensemble of DMSP satellite passes in Fig. 9. Thus the EISCAT obser-vation were consistent with the DMSP data and a relatively stable reconnection X-line and merging gap between 09:00 and 15:30 MLT.
The magnetopause reconnection rate, E, is related to the ionospheric velocity difference V0={V⊥N–VB}by:
E = |V0×Bi|/LX=(V⊥N−VB)Bi/LX, (2)
where a length LXalong the reconnection X-line maps
mag-netically to unit length along the ionospheric merging gap. Figure 13 shows the variation in V0(in blue) and the variation
of the westward, along-OCB component V||W (in red). The
uncertainty in V0is ε V0={ε2
V ⊥N+ε
2
V B}
1/2and using the
esti-mates for εV ⊥N and εV Bquoted above, we obtain an
uncer-tainty εV0=220 ms−1. Note that before 06:45 UT, the fluctu-ation level in both V⊥Nand VBgreatly exceeds εV0(Fig. 12) but the difference V0(Fig. 13) rarely exceeds this uncertainty. Thus although there are rapid variations in the boundary lo-cation at this time, there are few significant differences be-tween the boundary and plasma flow and no flow across the boundary in its own rest frame (reconnection) is detected.
The values of V0were generally low before 06:45 UT,
al-though there were brief periods when they exceeded zero by more than the above uncertainty estimate (εV0=220 ms−1), which could be caused by brief expansions of the active merging gap over the MLT of EISCAT. However, there were
also negative values of V0. These could be caused by field
line closure by reconnection at the sunward edge of both tail lobes with a northward-pointing IMF, as discussed by Song and Russell (1992) and as simulated using a global MHD model by Richard et al. (1994). Such dayside closure of open flux has been inferred from the cusp aurora by Lockwood and Moen (1999) and from magnetopause electron flows by On-sager et al. (2001). Although sunward convection in both
MLT>14 hr 10<MLT<14 hr MLT<10 hr Λ ( o ) UT (hrs) 23rd November, 1999 3 4 5 6 7 8 9 10 11 12 13 68 69 70 71 72 73 74 75 76 77
Fig. 10. Invariant latitudes 3 of DMSP satellite crossings of the open-closed boundary in the 10<MLT≤14 h sector (blue circles), at MLT≤10 h (red squares); and MLT>14 h (black triangles). As in Fig. 3, the areas shaded grey are northward IMF and the vertical dot-dashed lines mark the expansion/recovery phases of the larger substorm.
polar caps, expected for this dayside closure of open flux, is sometimes observed (Reiff, 1982), a more normal behaviour is sunward flow in just one (the summer) polar cap (Crooker and Rich, 1993): this would cause “stirring” of the open flux
poleward of the OCB, but not negative V0(Lockwood, 1998;
Lockwood and Moen, 1999). We note, using the grey bands in Fig. 13, that there is no clear relationship of V0<0 with northward IMF. Therefore it seems more likely that these
events demonstrate the experimental uncertainties in the V0
estimates and only a very few data points are negative by more than the estimated uncertainty εV0(i.e., V0<220 ms−1). After the return to southward IMF at 06:45 UT, EISCAT was at an MLT large enough to see consistent reconnection signatures (V0>0). After 06:45 UT, V0usually exceeded the uncertainty εV0, although there were brief intervals when no reconnection could be detected. EISCAT saw this reconnec-tion over roughly the same MLT range as the DMSP satel-lites (9:00–15:30 MLT): this is consistent with the broad in-flow region into the polar cap (e.g. Jørgensen et al., 1984) as opposed to a narrow convection “throat” (e.g. Heelis et al., 1976). The reconnection rate appears pulsed with several
clear peaks in V0 on 10-min timescales, as well as smaller
variations on shorter timescales. Some of these peaks may be
caused by the uncertainties in V0discussed above but most
exceed 500 ms−1 and so cannot be explained by the
uncer-tainty εV0. The periodicity is consistent with the distributions of repeat periods of signatures attributed to reconnection pulses at the magnetopause and in the ionosphere (respec-tively, Lockwood and Wild, 1993; McWilliams et al., 2000).
Interestingly, the variations in V0 matched closely those in
V||W, showing that the reconnection rate pulses also caused
increases in the convection velocity along the boundary (and
these tend to persist after V0 has decayed again). Such a
behaviour has been seen over extensive regions of the
day-side by Moen et al. (1995, 1996). The bursts in V||W were
first reported by Lockwood et al. (1989a, b) and confirmed to be longitudinally extensive flow channels by Pinnock et al. (1993). Before 07:45 UT, the westward flow along the
poleward side of the OCB, V||W, is generally negative,
con-sistent with the eastward flow found in a narrow band pole-ward of the OCB by the DMSP satellites (see Moen et al. 2004, Fig. 3). Thus the sunward flow in the LLBL reported by Moen et al. (2004) is a persistent feature in these data, and was previously reported by Nishida et al. (1993) and Fu-jimoto et al. (1998). After 07:45 UT the flow along the pole-ward side of the boundary is westpole-ward, again consistent with the DMSP passes (Moen et al., 2004, Fig. 5).
3 Conclusions
We have inferred motions of the dayside open-closed field line boundary (OCB) from an unusually persistent band of
high ion temperatures (Ti)that was observed by the EISCAT
VHF radar on 23 November 1999. As an indicator of the OCB location that was both reliable and persistent on this day, we have employed the equatorward edge of the observed fast westward flow, which is on newly-opened field lines and caused by the curvature force arising from reconnection with an interplanetary magnetic field with a large positive BY
component. We use the Ti=2000 K contour as a proxy for the
OCB and good agreement is found with the OCB locations deduced using particle observations from close conjunctions of DMSP satellites.
23rd November, 1999 δ ( o ) −20 0 20 40 V 1 (km s −1 ) 0 0.5 1 V 2 (km s −1 ) UT (hrs) 3 4 5 6 7 8 9 10 11 12 13 0 0.5 1
Fig. 11. (Top) Variations of the angle between the polar cap boundary and L-shells (δ – positive values denoting a north-east to south-west orientation of the boundary). (Middle and Bottom) the line-of-sight velocities observed along beam 1 and beam 2 (V1and V2, respectively)
for the range gates immediately poleward of the open-closed boundary signature. Data are 5-point running means of 1-min data. As in Fig. 3, areas shaded grey are northward IMF and the vertical dot-dashed lines mark the expansion/recovery phases of the larger substorm.
V ⊥N V B V ( km s −1 ) 23rd November, 1999 UT (hrs) 3 4 5 6 7 8 9 10 11 12 13 −0.5 0 0.5 1
Fig. 12. (Black) Variations of the boundary normal convection velocity V⊥N derived by combining V1and V2 for the range gates im-mediately poleward of the open-closed boundary signature. (Mauve) the velocity of the boundary motion VB. Both velocities are in the
field-perpendicular direction and both are positive poleward. Data are 5-point running means of 1-min data. As in Fig. 3, areas shaded grey are northward IMF and the vertical dot-dashed lines mark the expansion/recovery phases of the larger substorm.
23rd November, 1999 V′ V | |W/2
UT (hrs)
3 4 5 6 7 8 9 10 11 12 13 −1.5 −1 −0.5 0 0.5 1 1.5Fig. 13. (Blue) Variations of the boundary-normal convection velocity in the boundary rest frame V0=V⊥N–VB(positive poleward into the polar cap). (Red) The westward convection velocity V||W derived by combining V1and V2for the range gates immediately poleward of the
open-closed boundary signature. Data are 5-point running means of 1-minute data. As in Fig. 3, areas shaded grey are northward IMF and the vertical dot-dashed lines mark the expansion/recovery phases of the larger substorm.
We have used the energy dispersion characteristics of cusp ions to distinguish between active merging gap segments of the open-closed boundary and non-reconnecting (“adi-aroic”) segments. Specifically the presence/absence of lower cut-off cusp ions of energy exceeding 1keV and differen-tial energy flux exceeding a clearly detectable threshold of 107cm−2s−1sr−1was used to identify the existence/lack of ongoing local reconnection. For protons propagating over a typical field-aligned distance from the X-line to the iono-sphere of 20 RE, such ions are only seen on field lines that
were reconnected within the past 5 minutes (so for a typical convection speed of 1 kms−1, the satellite is within 300 km of an active merging gap). The similarity of when and where the radar and the satellites detected ongoing reconnection vali-dates this technique.
The detection of the reconnection rate using the radar is described. Although the open-closed boundary is normally quite close to being L-shell aligned, significantly larger ori-entation angles are found and these can introduce significant errors if the east-west flow along the boundary is large. The
flow across the inferred OCB in its own rest frame, V0, has
been computed at the MLT observed by EISCAT and gives a measure of the magnetopause reconnection rate. The radar saw ongoing reconnection over the MLT range 09:30–15:30. The data reveal a relatively stable reconnection merging gap, giving a broad inflow into the polar cap across the entire day-side.
The analysis shows that the reconnection merging gap cov-ered a large part of the dayside on this day (9<MLT<15). This means that the entire dayside auroral oval expands equa-torward in response to the enhanced magnetopause recon-nection and also relaxed back poleward in the substorm ex-pansion/recovery phases. These inferred large-scale motions of the OCB were seen in most detail by EISCAT, but there were sufficient DMSP passes for us to show that similar mo-tions took place at other MLTs throughout the dayside. Thus the satellite data show that the boundary motions detected by EISCAT covered most of the dayside and were not restricted to a small range of MLTs around the radar. The motions have been shown to be consistent with unbalanced reconnection rates, with the dayside OCB eroding equatorward when the IMF points southward during substorm growth phases and relaxing back poleward during the subsequent expansion and recovery phases. This poleward retreat during the expansion phase was faster if the IMF is northward than when the mag-netopause reconnection voltage remained high because the IMF continued to point southward.
Acknowledgements. The authors are grateful to the staff of the
EIS-CAT Scientific Association for their support and the provision of the EISCAT radars. EISCAT is a collaboration of research Councils of the UK, France, Germany, Norway, Sweden, Finland, Japan and China. We also thank WDC, Kyoto for provision of the AL index, Phillips Laboratory and Johns Hopkins University for provision of the DMSP particle spectrograms and the teams of the magnetome-ters and solar wind instruments on board the ACE and Wind space-craft for the provision of the interplanetary data. The UK authors
of this paper are supported by PPARC, the Norwegian scientists by the Norwegian Research Council and AFOSR task 2311AS.
Topical Editor T. Pulkkinen thanks P. E. Sandholt and another referee for their help in evaluating this paper.
References
Akasofu, S.-I., Meng, C.-I., and Makita, K.: Changes of the size of the open field line region during substorms, Planet. Space Sci., 40, 1513–1524, 1992.
Aparicio, B., Thelin, B., and Lundin, R.: The polar cusp from a particle point of view: a statistical study based on Viking data, J. Geophys. Res., 96, 14 023–14 031, 1991.
Aubry, M. P., Russell, C. T., and Kivelson, M. G.: Inward motion of the magnetopause before a substorm, J. Geophys. Res., 75, 7018–7031, 1970.
Burch, J. L.: Rate of erosion of dayside magnetic flux based on a quantitative study of the dependence of polar cusp latitude on the interplanetary magnetic field, Radio Sci., 8, 955–961, 1973. Carbary, J. F. and Meng, C.-I.: Correlation of cusp width with
AE(12) and Bz, Planet. Space Sci., 36, 157–161, 1988.
Cowley, S. W. H. and Lockwood, M.: Excitation and decay of so-lar wind-driven flows in the magnetosphere-ionosphere system, Ann. Geophys., 10, 103–115, 1992.
Cowley, S. W. H. and Lockwood, M.: Incoherent scatter radar ob-servations related to magnetospheric dynamics, Adv. Space Res., 20 (4/5), 873-882, 1997.
Cowley, S. W. H., Morelli, J. P., and Lockwood, M.: Dependence of convective flows and particle precipitation in the high-latitude dayside ionosphere on the X and Y components of the interplan-etary magnetic field, J. Geophys. Res., 96, 5557–5564, 1991a. Cowley, S. W. H., Freeman, M. P., Lockwood, M., and Smith, M.
F.: The ionospheric signature of flux transfer events, in: CLUS-TER – dayside polar cusp, edited by: Barron, C. I., ESA SP-330, 105–112, European Space Agency Publications, Noordwijk, The Netherlands, 1991b.
Crooker, N. U. and Rich, F. J.: Lobe-cell convection as a summer phenomenon, J. Geophys. Res., 98, 13 403–13 407, 1993 Davies, J. A., Yeoman, T. K., Rae, I. J., Milan, S. E., Lester, M.,
Lockwood, M., and McWilliams, K. A.: Ground-based obser-vations of the auroral zone and polar cap ionospheric responses to dayside transient reconnection, Ann. Geophys., 20, 781–794, 2002,
SRef-ID: 1432-0576/ag/2002-20-781.
Eather, R. H.: Polar cusp dynamics, J. Geophys. Res., 90, 1569– 1576, 1985.
Eather, R. H., Mende, S. B., and Weber, E. J.: Dayside aurora and relevance to substorm current systems and dayside merging, J. Geophys. Res., 84, 3339–3359, 1979.
Elphinstone, R. D., Murphree, J. S., Hearn, D. J., Cogger, L. L., Newell, P. T., and Vo, H.: Viking observations of the UV dayside aurora and their relation to DMSP particle boundary definitions, Ann. Geophys., 10, 815–826, 1992.
Escoubet, C. P., Smith, M. F., Fung, S. F., Anderson, P. C., Hoff-man, R. A., Basinska, E. M., and Bosqued, J. M.: Staircase ion signature in the polar cusp: a case study, Geophys. Res. Lett., 19, 1735–1738, 1992.
Farrugia, C. J., Sandholt, P. E., Denig, W. F., and Torbert, R. B.: Observation of a correspondence between poleward-moving au-roral forms and stepped cusp ion precipitation, J. Geophys. Res., 103, 9309–9315, 1998.
Fox, N. J., Lockwood, M., Cowley, S. W. H., Freeman, M. P., Friis-Christensen, E., Milling, D. K., Pinnock, M., and Reeves, G. D.: EISCAT observations of unusual flows in the morning sector associated with weak substorm activity, Ann. Geophys., 12, 541– 553, 1994,
SRef-ID: 1432-0576/ag/1994-12-541.
Fox, N. J., Cowley, S. W. H., Davies, J. A., Greenwald, R. A., Lester, M., Lockwood, M., and L¨uhr, H.: Ionospheric ion and electron heating at the poleward boundary of a poleward-expanding substorm-disturbed region, J. Geophys. Res., 106, 12 845–12 862, 2001.
Frank, L. A. and Craven, J. D.: Imaging results from Dynamics Explorer 1, Rev. Geophys., 26, 249–283, 1988.
Freeman, M. P.: A unified model of the response of ionospheric convection to changes in the interplanetary magnetic field, J. Geophys. Res., 108(A1), 102, doi:10.1029/2002JA009385, 2003.
Freeman, M. P. and Southwood, D. J.: The effects of magne-tospheric erosion on mid- and high-latitude ionospheric flows, Planet. Space Sci., 36, 509–522, 1988.
Freeman, M. P., Ruohoniemi, J. M., and Greenwald, R. A.: The de-termination of time-stationary two-dimensional convection pat-terns with single-station radar, J. Geophys. Res., 96, 15 735– 15 749, 1991.
Fujimoto, M., Mukai, T., Kwano, H., Nakamura, M., Nishida, A., Saito, Y., Yamamota, T., and Kokubun, S.: Structure of the low latitude boundary layer: A case study with Geotail data, J. Geo-phys. Res., 103, 2297–2308, 1998.
Greenwald, R. A., Baker, K. B., Ruohoniemi, J. M., Dudeney, J. R., Pinnock, M., Mattin, N., Leonard, J. M., and Lepping, R. P.: Simultaneous conjugate observations of dynamic variations in high-latitude dayside convection due to changes in IMF By, J. Geophys. Res., 95, 8057–8072, 1990.
Heelis, R. A., Hanson, W. B., and Burch, J. L.: Ion convection reversals in the dayside cleft, J. Geophys Res., 81, 3803–3809, 1976.
Horwitz, J. L. and Akasofu, S.-I.: The response of the dayside aurora to sharp northward and southward transitions of the in-terplanetary magnetic field and to magnetospheric substorms, J. Geophys. Res., 82, 2723–2734, 1977.
Jørgensen, T. S., Friis-Christensen, E., Wickwar, V. B., Kelly, J. D., Clauer, C. R., and Banks, P. M.: On the reversal from “sunward” to ”antisunward” plasma convection in the dayside high latitude ionosphere, Geophys. Res. Lett., 1, 887–890, 1984.
Lester, M., Freeman, M. P., Southwood, D. J., Waldock, J. A., and Singer, H. J.: A study of the relationship between interplane-tary parameters and large displacements of nightside polar-cap boundary, J. Geophys. Res., 95, 21 133–21 145, 1990.
Lockwood, M.: The location and characteristics of the reconnec-tion X-line deduced from low-altitude satellite and ground-based observations: 1. Theory, J. Geophys. Res., 100, 21 791–21 802, 1995.
Lockwood, M.: The case for transient magnetopause reconnection, EOS, Trans. Am. Geophys. Union, 77(26), 246–250, 1996. Lockwood, M.: The relationship of dayside auroral precipitations
to the open-closed separatrix and the pattern of convective flow, J. Geophys. Res., 102, 17 475–17 487, 1997a.
Lockwood, M.: Energy and pitch angle dispersions of LLBL/cusp ions seen at middle altitudes: predictions by the open magneto-sphere model, Ann. Geophys., 15 , 1501–1514, 1997b,
Lockwood., M.: Identifying the open-closed field-line boundary, in: Polar-cap boundary Phenomena, edited by: Moen, J. Egeland, A., and Lockwood, M., NATO Advanced Study Institute Series, Kluwer Academic Press, Dordrecht, Vol. 509, 415–432, 1998. Lockwood, M. and Cowley, S. W. H.: Ionospheric Convection and
the substorm cycle, in: Substorms 1, Proceedings of the First In-ternational Conference on Substorms, ICS-1, edited by: Mattock, C., ESA-SP-335, European Space Agency Publications, Nord-vijk, The Netherlands, 99–109, 1992.
Lockwood, M. and Davis, C. J.: The occurrence probability, width and number of steps of cusp precipitation for fully-pulsed re-connection at the dayside magnetopause, J. Geophys. Res. 100, 7627–7640, 1995.
Lockwood, M. and Davis, C. J.: On the longitudinal extent of magnetopause reconnection bursts, Ann. Geophys., 14, 865–878, 1996,
SRef-ID: 1432-0576/ag/1996-14-865.
Lockwood, M. and Moen, J.: Reconfiguration and closure of lobe flux by reconnection during northward IMF: evidence for signa-tures in cusp/cleft auroral emissions, Ann. Geophys., 17, 996– 1011, 1999,
SRef-ID: 1432-0576/ag/1999-17-996.
Lockwood, M. and Morley, S. K.: A numerical model of the iono-spheric signatures of time-varying magnetic reconnection: I. Ionospheric convection, Ann. Geophys., 22, 73-91, 2004 SRef-ID: 1432-0576/ag/2004-22-73.
Lockwood, M. and Smith, M. F.: The variation of reconnection rate at the dayside magnetopause and cusp ion precipitation, J. Geo-phys. Res., 97, 14 841–14 847, 1992.
Lockwood, M. and Wild, M. N.: On the quasi-periodic nature of magnetopause flux transfer events, J. Geophys. Res., 98, 5935– 5940, 1993.
Lockwood, M., Cowley, S. W. H., Todd, H., Willis, D. M., and Clauer, C. R.: Ion flows and heating at a contracting polar-cap boundary, Planet. Space Sci., 36, 1229–1253, 1988.
Lockwood, M., Sandholt, P. E., and Cowley, S. W. H.: Dayside au-roral activity and momentum transfer from the solar wind, Geo-phys. Res. Lett., 16, 33–36, 1989a.
Lockwood, M., Sandholt, P. E., Cowley, S. W. H., and Oguti, T.: Interplanetary magnetic field control of dayside auroral activity and the transfer of momentum across the dayside magnetopause, Planet. Space Sci., 37, 1347–1365, 1989b.
Lockwood, M., Cowley, S. W. H., and Freeman, M. P.: The ex-citation of plasma convection in the high-latitude ionosphere, J. Geophys. Res., 95, 7961–7972, 1990.
Lockwood, M., Denig, W. F., Farmer, A. D., Davda, V. N., Cow-ley, S. W. H., and L¨uhr, H.: Ionospheric signatures of pulsed magnetic reconnection at the Earth’s magnetopause, Nature, 361 (6411), 424–428, 1993a.
Lockwood, M., Moen, J., Cowley, S. W. H., Farmer, A. D., Løvhaug, U.-P., L¨uhr, H. and Davda, V. N.: Variability of day-side convection and motions of the cusp/cleft aurora, Geophys. Res. Lett., 20, 1011–1014, 1993b.
Lockwood, M., Lanchester, B. S., Frey, H. , Throp, K., Morley, S. K., Milan, S. E., and Lester, M.: IMF Control of Cusp Pro-ton Emission Intensity and Dayside Convection: implications for component and anti-parallel reconnection., Ann. Geophys., 21, 955–982, 2003,
SRef-ID: 1432-0576/ag/2003-21-955.
Lockwood, M., Davies, J. A., Moen, J., van Eyken, A. P., Oksavik, K., and McCrea, I. W.: Motion of the dayside polar cap bound-ary during substorm cycles: II. polar patch generation by pulses
in the magnetopause reconnection rate, Ann. Geophys., 23, – , 2005.
McCrea, I. W., Lockwood, M., Moen, J., Pitout, F., Eglitis, P., Ayl-ward, A. D., Cerisier, J.-C., Thorolfssen, A., and Milan, S. E.: ESR and EISCAT observations of the response of the cusp and cleft to IMF orientation changes, Ann. Geophys., 18, 1009–1026, 2000,
SRef-ID: 1432-0576/ag/2000-18-1009.
McWilliams, K. A., Yeoman, T. K., and Provan, G.: A statistical survey of dayside pulsed ionospheric flows as seen by the CUT-LASS Finland HF radar, Ann. Geophys., 18, 445–453, 2000, SRef-ID: 1432-0576/ag/2000-18-445.
Milan, S. E., Lester, M. E., Cowley, S. W. H., Oksavik, K., Brit-tnacher, M., Greenwald, R. A., Sofko, G., and Villain, J.-P.: Vari-ation in polar cap area during two substorm cycles, Ann. Geo-phys., 21, 1121–1140, 2003,
SRef-ID: 1432-0576/ag/2003-21-1121.
Moen, J., Sandholt, P. E., Lockwood, M., Denig, W. F., Løvhaug, U.-P., Lybekk, B., Egeland, A., Opsvik, D., and Friis-Christensen, E.: Events of enhanced convection and related day-side auroral activity, J. Geophys. Res. 100, 23 917–23 934, 1995. Moen, J., Lockwood, M., Sandholt, P. E., Løvhaug, U.-P. , Denig, W. F., van Eyken, A. P., and Egeland, A.: Variability of dayside high-latitude convection associated with a sequence of auroral transients, J. Atmos. Terr. Phys., 58, 85–96, 1996.
Moen, J., Lockwood, M., Oksavik, K., Carlson, H. C., Denig, W. F., van Eyken, A. P., and McCrea, I. W.: The dynamics and relation-ships of precipitation, temperature and convection boundaries in the dayside auroral ionosphere, Ann. Geophys., 22, 1973–1987, 2004,
SRef-ID: 1432-0576/ag/2004-22-1973.
Morley, S. K. and Lockwood, M.: The effect of reconnection rate pulse height on cusp ion steps, Ann. Geophys., 21, 947–953, 2003,
SRef-ID: 1432-0576/ag/2003-21-947.
Moses, J. J., Siscoe, G. L., Heelis, R. A., and Winningham, J. D.: Polar cap deflation during magnetospheric substorms, J. Geo-phys. Res., 94, 3785–3789, 1989.
Newell, P. T. and Meng, C.-I.: Ion acceleration at the equatorward edge of the cusp: low altitude observations of patchy merging, Geophys. Res. Lett, 18, 1829–1832, 1991.
Nishida, A., Mukai, T., Hayakawa, H., Matsuoka, A., Tsuruda, K., Kaya, N., and Fukunishi, H.: Unexpected features of the ion pcipitation in the so-called cleft/low-latitude boundary layer re-gion: Association with sunward convection and occurrence on open field lines, J. Geophys. Res., 98, 11 161–11 176, 1993. Oksavik, K., Søraas, F., Moen, J., and Burke, W. J.: Optical and
particle signatures of magnetospheric boundary layers near mag-netic noon: Satellite and ground-based observations, J. Geophys. Res., 105, 27 555–27 568, 2000.
Oksavik, K., Søraas, F., Moen, J., Pfaff, R., Davies, J. A., and Lester, M.: Simultaneous optical, CUTLASS HF radar, and FAST spacecraft observations: Signatures of boundary layer pro-cesses in the cusp, Ann. Geophys., 22, 511–525, 2004,
SRef-ID: 1432-0576/ag/2004-22-511.
Onsager, T. G., Scudder, J. D., Lockwood, M., and Russell, C. T.: Reconnection at the High-Latitude Magnetopause During North-ward IMF Conditions, J. Geophys. Res., 106, 25 467–25 488, 2001.
Pinnock, M., Rodger, A. S., Dudeney, J. R., Baker, K. B., Newell, P. T., Greenwald, R. A., and Greenspan, M. E.: Observations of an enhanced convection channel in the cusp ionosphere, J. Geophys.
Res., 98, 3767–3776, 1993.
Pinnock, M., Rodger, A. S., Dudeney, J. R., Rich, F., and Baker, K. B.: High spatial and temporal resolution observations of the ionospheric cusp, Ann. Geophys., 13, 919–925, 1995,
SRef-ID: 1432-0576/ag/1995-13-919.
Reiff, P. H.: Sunward convection in both polar caps, J. Geophys. Res., 87, 5976–5980, 1982.
Rezhenov, B. V., Vorobjev, V. G., and Feldstein, Y.-I.: The inter-planetary magnetic field Bz component influence on the geomag-netic field and on auroral dynamics, Planet. Space Sci., 27, 699– 716, 1979.
Richard, R. L., Walker, R. J., and Ashour-Abdalla, M.: The popu-lation of the magnetosphere by solar wind ions when the inter-planetary magnetic field is northward, Geophys. Res. Lett. 21, 2455–2458, 1994.
Sandholt, P. E.: IMF control of the polar cusp and cleft auroras, Adv. Space Res., 8, (9)21–(9)34, 1988.
Sandholt, P. E., Egeland, A., Deehr, C. S., Sivjee, G. C., and Romick, G. J.: Effects of interplanetary magnetic field and mag-netic substorm variations on the dayside aurora, Planet. Space Sci., 31, 1345–1362, 1983.
Sandholt, P. E., Farrugia, C. J., Moen, J., and Cowley, S. W. H.: Dayside auroral configurations: Responses to southward and northward rotations of the interplanetary magnetic field, J. Geo-phys. Res., 103(A9), 20 279-20 296, 1998.
Siscoe, G. L. and Huang, T. S.: Polar cap inflation and deflation, Geophys. Res. Lett., 90, 543–547, 1985.
Song, P. and Russell, C. T.: Model of the formation of the low-latitude boundary layer for strongly northward interplanetary magnetic field, J. Geophys. Res., 97, 1411–1420, 1992. Vorobjev, V. G., Gustafsson, G., Starkov, G. V., Feldstein, Y. I.,
and Shevnina, N. F: Dynamics of day and night aurorae during substorms, Planet Space Sci., 23, 269–278, 1975.
Williams, P. J. S., Etemadi, W., McCrea, I. W., and Todd, H.: Errors due to random noise in velocity measurement using incoherent-scatter radar, Ann. Geophys., 14, 1480–1486, 1996,