DOI 10.1007/s00269-013-0638-9 ORIGINAL PAPER
Kinetics of the chrysotile and brucite dehydroxylation reaction:
a combined non‑isothermal/isothermal thermogravimetric
analysis and high‑temperature X‑ray powder diffraction study
Roy Trittschack · Bernard Grobéty · Pierre BrodardReceived: 18 July 2013 / Accepted: 24 October 2013 / Published online: 5 November 2013 © Springer-Verlag Berlin Heidelberg 2013
a much higher apparent Ea characterised by an initial stage of around 290 kJ/mol. Afterwards, the apparent Ea comes
down to around 250 kJ/mol at α ~ 65 % before rising up to around 400 kJ/mol. The delivered kinetic data have been investigated by the z(α) master plot and generalised time master plot methods in order to discriminate the reaction mechanism. Resulting data verify the multi-step reaction scenarios (reactions governed by more than one rate-deter-mining step) already visible in Ea versus α plots.
Keywords Serpentine dehydroxylation · Generalised
master plot · Chrysotile · Brucite · Thermogravimetry · In situ high-temperature X-ray powder diffraction
Introduction
Kinetic analyses of solid-state reactions have been studied in material and earth sciences since more than 100 years. Kinetics are important in the fields of magmatic (crystal and/or bubble growth in magmas) and metamorphic petrol-ogy (mineral transformations), and they are an important (limiting) factor for many dating tools used in earth sci-ences (e.g. geospeedometry based on diffusion, Ar–Ar dat-ing of micas) (Zhang 2008). In material sciences, kinetics are not only of scientific interest, but also of economic importance. In material synthesis, the rate of processes often influences the texture and therefore also the prop-erties of materials (e.g. Cheong et al. 2009; Salehi et al. 2011).
The theoretical background on the principles of solid-state reaction kinetics evolved considerably during this time period. Experimental techniques and models to extract kinetic parameters for similar reactions differ widely between individual branches of science (e.g. chemistry vs
Abstract The dehydroxylation reactions of chrysotile
Mg3Si2O5(OH)4 and brucite Mg(OH)2 were studied under
inert nitrogen atmosphere using isothermal and non-isother-mal approaches. The brucite decomposition was addition-ally studied under CO2 in order to check the influence of a competing dehydroxylation/carbonation/decarbonisation reaction on the reaction kinetics. Isothermal experiments were conducted using in situ high-temperature X-ray pow-der diffraction, whereas non-isothermal experiments were performed by thermogravimetric analyses. All data were treated by model-free, isoconversional approaches (‘time to a given fraction’ and Friedman method) to avoid the influ-ence of kinetic misinterpretation caused by model-fitting techniques. All examined reactions are characterised by a dynamic, non-constant reaction-progress-resolved (‘α’-resolved) course of the apparent activation energy Ea and indicate, therefore, multi-step reaction scenarios in case of the three studied reactions. The dehydroxylation kinet-ics of chrysotile can be subdivided into three different stages characterised by a steadily increasing Ea (α ≤ 15 %, 240–300 kJ/mol), before coming down and forming a pla-teau (15 % ≤ α ≤ 60 %, 300–260 kJ/mol). The reaction ends with an increasing Ea (α ≥ 60 %, 260–290 kJ/mol). The dehydroxylation of brucite under nitrogen shows a less dynamic, but generally decreasing trend in Ea versus α (160–110 kJ/mol). In contrast to that, the decomposi-tion of brucite under CO2 delivers a dynamic course with R. Trittschack (*) · B. Grobéty
Department of Geosciences, University of Fribourg, Chemin du Musée 6, 1700 Fribourg, Switzerland
e-mail: [email protected] P. Brodard
College of Engineering and Architecture of Fribourg, Perolles 80, PF 32, 1705 Fribourg, Switzerland
geosciences). Even different research groups within the same field are using quite different experimental and math-ematical approaches to extract kinetic information from a reaction. Results are, therefore, often not directly compa-rable with each other. During the last three decades, some people active in the field of thermal analysis and kinet-ics started to question the validity of the theoretical mod-els used to describe rates of solid-state reactions (Brown 1987; Maciejewski 1992; Vyazovkin and Wight 1997; Vyazovkin 2000; Galwey 2004). In addition, Galwey and Brown (2002) initiated a new discussion on the validity of the Arrhenius equation in the field of solid-state kinetics. In the chemistry community, a joint effort was undertaken to clarify some doubtful practices and to propose general pro-cedures for performing experiments and data evaluation. A series of guideline/review papers are available in literature to provide a comprehensive base for ‘users’ of solid-state kinetics (e.g. Vyazovkin and Wight 1997; Brown et al. 2000; Burnham 2000; Maciejewski 2000; Roduit 2000; Vyazovkin 2000, 2008; Galwey 2004; Vyazovkin et al. 2011). However, none of these articles were published in geosciences literature. This absence may explain the low number of geoscientific papers dealing with modern solid-state kinetic concepts such as isoconversional kinetics, variable activation energies, multi-step reaction mecha-nisms. In fact, most of the papers written since the millen-nium are still using the Avrami–Erofe’ev reaction model and isothermal model-fitting functions (Hancock and Sharp 1972; Bamford and Tipper 1980) to describe the experi-mental data. The Avrami–Erofe’ev model describes reac-tions whose rates are determined by nucleation and growth steps as well as diffusion steps (e.g. Bamford and Tipper 1980). Models for one-, two- and three-dimensional nucle-ation and growth as well as diffusion models are included therein. The (force) fitted data are then used to determine the dimensionality of the single ‘rate-determining step’ (e.g. Bray and Redfern 2000; Cattaneo et al. 2003; Perril-lat et al. 2005; Ferrage et al. 2007; Carbone et al. 2008; Ballirano and Melis 2009; Chollet et al. 2009; Inoue et al. 2009; Tokiwai and Nakashima 2010; Gualtieri et al. 2012).
The two master plot approaches presented herein com-bine the model-free methods with model-based ones to decipher possible rate-limiting steps. Prior to the use of master plots, it is necessary to determine reaction-progress-resolved data of the apparent activation energy (Ea). This is commonly done by the help of model-free methods such as the used integral (e.g. Ozawa 1965; Flynn and Wall 1966; Vyazovkin 1996, 1997, 2001) and differential isoconver-sional (Friedman 1964) approaches which allow to deter-mine the kinetic parameters (Ea, A) independent of a
dis-crete assumption on either an integral g(α) or differential
f(α) model function. In case of an almost constant appar-ent Eaα, it is possible to use the z(α) master plot method
to determine the rate-limiting mechanism, provided that the same step controls the rate over the entire reaction pro-gress. If the latter ‘prerequisite’ is not fulfilled, the gener-alised time master plot is more suitable as it allows us to determine a reaction-progress-resolved change in the rate-limiting step. In both master plot approaches, the experi-mentally determined data are compared to a set of curves corresponding to theoretical models (Table 1). Then, the best fit between the experimental and theoretical curves is taken as the most appropriate reaction model.
The paper presents and discusses kinetic data of the dehydroxylation and subsequent phase transformation of chrysotile Mg3Si2O5(OH)4 to forsterite Mg2SiO4 and bru-cite Mg(OH)2 to periclase MgO. Apart from the
dehydrox-ylation in inert nitrogen atmosphere, brucite was addition-ally studied under a constant flux of CO2 to examine the influence of secondary formed carbonates on the dehydrox-ylation reaction. Ongoing reactions were investigated by non-isothermal thermogravimetry (TGA) and treated with model-free techniques. Resulting kinetics will be compared with those of isothermal high-temperature X-ray powder diffraction (HT-XRPD). Both reactions have been stud-ied comprehensively in the past (e.g. Martin 1977; Datta et al. 1987; Datta 1991; MacKenzie and Meinhold 1994; Butt et al. 1996; Halikia et al. 1998; McKelvy et al. 2001; Bearat et al. 2002; Cattaneo et al. 2003; Yue et al. 2005; McKelvy et al. 2006; Nahdi et al. 2009; Viti 2010; Gualtieri et al. 2012; Trittschack and Grobéty 2013) and offer, there-fore, good possibilities to compare assessed data. Mecha-nistic interpretations are performed by comparing model-free and reaction-progress-resolved values of the apparent activation energy (Eaα) with the ones plotted into the two independent master plot graphs. The results are compared with literature data.
Experimental methods
Sample materials
The investigated chrysotile sample, a vein crosscutting an antigorite serpentinite, is from the mineralogical col-lection of the Department of Geosciences at the Uni-versity of Fribourg/Switzerland (internal reference chry 33/12). The material for chemical and phase analysis as well as kinetic investigations was extracted mechanically from the vein. Transmission-electron-microscopy-based energy-dispersive spectroscopy (TEM-EDS) analysis gave an almost pure Mg end-member composition with 48.0 wt% SiO2, 51.2 wt% MgO and 0.1 wt% FeOtot.
X-ray powder diffractograms point towards the domi-nance of the polytype clinochrysotile as the resulting pattern is close to those of the ICDD references 25-0645
and 10-0381 (Fig. 1). The outer diameter of the chry-sotile fibres was determined from high-resolution TEM images and gave values ranging between 23 and 85 nm, more than 75 % between 30 and 60 nm. A detailed
description of the dehydroxylation reaction is provided by Trittschack and Grobéty (2013).
The analysed brucite is a synthetic Mg(OH)2 sample obtained from Sigma-Aldrich (M5421-, SigmaUltra, min-imum 95 %). X-ray fluorescence analysis (XRF) yields a composition of 0.07 wt% SiO2, 0.01 wt% Al2O3, 69.63 wt%
MgO, 0.15 wt% CaO, 0.02 wt% BaO and 0.10 wt% Cl, corresponding to 30.02 wt% H2O, which is close to the the-oretical value of 30.89 wt% H2O for Mg(OH)2.
X-ray fluorescence
X-ray fluorescence was carried out with a Philips PW2400 X-ray fluorescence wavelength-dispersive spectrometer (XRF-WDS) using a voltage of 60 kV and a current of 30 mA. The analysis was carried out on a pressed Mg(OH)2 powder disc with a diameter of 32 mm. Calculations were done with the UniQuant5 software package by Thermo Fisher Scientific.
X-ray powder diffraction
X-ray powder diffraction for qualitative phase analy-sis was performed with a Philips PW1800 diffractometer
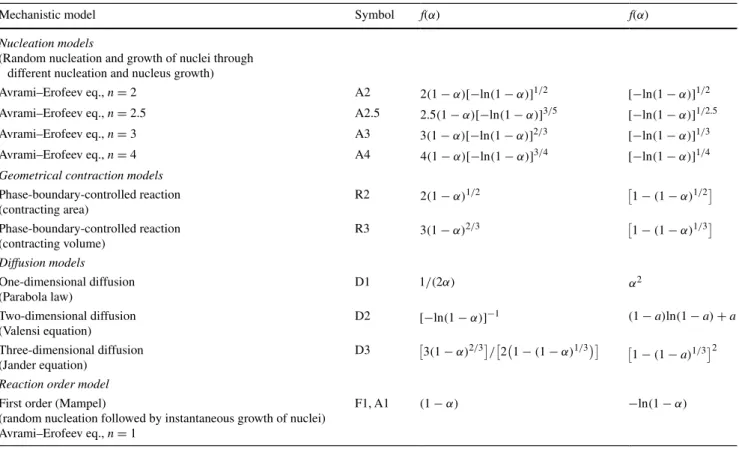
Table 1 Differential f(α) and integral f(α) functions of some widely used kinetic models in solid-state kinetics
Vyazovkin et al. (2011) Sánchez-Jiménez et al. (2013)
Mechanistic model Symbol f(α) f(α)
Nucleation models
(Random nucleation and growth of nuclei through different nucleation and nucleus growth)
Avrami–Erofeev eq., n = 2 A2 2(1 − α)[−ln(1 − α)]1/2 [−ln(1 − α)]1/2
Avrami–Erofeev eq., n = 2.5 A2.5 2.5(1 − α)[−ln(1 − α)]3/5 [−ln(1 − α)]1/2.5
Avrami–Erofeev eq., n = 3 A3 3(1 − α)[−ln(1 − α)]2/3 [−ln(1 − α)]1/3
Avrami–Erofeev eq., n = 4 A4 4(1 − α)[−ln(1 − α)]3/4 [−ln(1 − α)]1/4
Geometrical contraction models Phase-boundary-controlled reaction (contracting area) R2 2(1 − α)1/2 1 − (1 − α)1/2 Phase-boundary-controlled reaction (contracting volume) R3 3(1 − α)2/3 1 − (1 − α)1/3 Diffusion models One-dimensional diffusion (Parabola law) D1 1/(2α) α2 Two-dimensional diffusion (Valensi equation) D2 [−ln(1 − α)]−1 (1 − a)ln(1 − a) + a Three-dimensional diffusion (Jander equation) D3 3(1 − α)2/3 / 2 1 − (1 − α)1/3 1 − (1 − a)1/3 2 Reaction order model
First order (Mampel)
(random nucleation followed by instantaneous growth of nuclei) Avrami–Erofeev eq., n = 1
F1, A1 (1 − α) −ln(1 − α)
Fig. 1 X-ray powder diffraction pattern of the studied chrysotile
(Bragg–Brentano geometry, Cu Kα radiation generated at 40 kV and 40 mA, variable divergence slit and a receiv-ing slit size of 1 mm). The diffractograms were measured in the 5–100°2θ range using a step size of 0.02°2θ with a scanning rate of 5 s/step for brucite and a step size of 0.01°2θ with a scanning rate of 2.5 s/step for chrysotile, respectively.
In situ high-temperature X-ray powder diffraction (HT-XRPD)
In situ high-temperature X-ray powder diffraction (HT-XRPD) experiments were conducted using a Philips PW1830 X-ray powder diffractometer with Bragg– Brentano geometry (Cu Kα radiation, 40 kV and 40 mA) equipped with a water-cooled high-temperature vacuum camera (Paar Physica HTK 10) and controlled by a tem-perature control unit (TCM 2000 by Paar Physica). All powdered samples were deposited on a 0.7-mm-thick 1737F low alkali glass holder. After a drying period, sin-gle samples were placed onto a platinum strip which is connected to a 10 %RhPt thermocouple in the centre of the HTK 10. A regular temperature calibration was real-ised by using the melting points of NaNO3 (TM = 306 °C), Ba(NO3)2 (TM = 592 °C), KCl (TM = 790 °C) and NaCl
(TM = 801 °C). All data were collected using a fixed
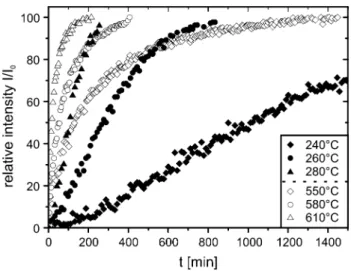
diver-gence slit of 1° and a receiving slit of 0.2 mm. Standard measurements for gathering kinetic data were taken with a step size of 0.02°2θ and a scanning rate of 5 s/step. The long scanning rate is related to the sensitivity of the scin-tillation detector. Single isothermal temperature runs were run with a step size of 10 °C. The dehydroxylation of chry-sotile was followed by the decrease in integral intensity of the (002) XRD peak, whereas the decomposition of brucite was followed by scanning the decrease in integral intensity of the (001) XRD reflex. An exemplarily dataset is shown in Fig. 2.
Thermogravimetric analyses
Thermogravimetric analyses were conducted with a Met-tler-Toledo TGA/SDTA 851e device at the College of Engi-neering and Architecture Fribourg, Switzerland. In general, all analyses were carried out under a constant flux of nitro-gen (100 ml/min N2) to reduce possible oxidation effects due to FeOtot and other oxidisable impurities of the sample
material. An additional experiment with brucite was car-ried out under a constant flux of CO2 (100 ml/min) to study dehydroxylation under simultaneous carbonisation. The weight loss of the powdered sample material was measured for seven different linear heating rates (1, 2, 4, 8, 12, 16 and 32 K/min). The variation in the sample mass was kept as small as possible and reached a maximum of 0.5 mg
within a single thermoanalytical dataset consisting of data of seven different heating rates.
Kinetic approach
Our kinetic investigations are based on time (isothermal and non-isothermal data)- and temperature (non-isothermal data)-resolved datasets of the reaction progress α. For in situ high-temperature X-ray experiments, α is proportional to the reduction in the integral XRD peak intensity of the reactant, e.g. chrysotile and brucite with time:
where It is the integral peak intensity of a respective peak at time t and I0 the initial peak intensity. In our case, I0
cor-responds to the strongest, i.e. first peak intensity measured after the heating up of the sample. Kinetic data of chry-sotile were acquired by measuring the (002) XRD peak, whereas for brucite, the (001) peak was monitored. In TG data, the reaction progress α is defined as follows:
or
where m0, mt, mT and mf are initial mass, the mass at time t, the mass at temperature T and the final mass of the sample, respectively. (1) α =1 − It I0 (2) α = m0−mt m0−mf (3) α = m0−mT m0−mf
Fig. 2 Exemplarily reaction progress α versus time t of the
decom-position of chrysotile (open symbols) and brucite (filled symbols), respectively, measured by HT-XRPD under isothermal conditions using a N2 flux of 200 ml/min
Avrami–Erofe’ev method
The general rate equation is given by
The function f(α), called the reaction model, describes the dependency of the rate on reaction progress. Functions for many rate-limiting reaction steps have been derived (e.g. Bam-ford and Tipper 1980; Vyazovkin et al. 2011). An often used model is the classical Avrami–Erofe’ev equation (Bamford and Tipper 1980), for which the integrated form is given by where k(T) corresponds to the rate constant and n to a respec-tive rate-determining step. The Avrami–Erofe’ev approach describes the rate of reactions in which nucleation and growth steps (or diffusion) are rate-limiting. The parameter n changes with the morphology (dimension) of the nucleating phase or with the dimension in which diffusion occurs (one-, two- or three-dimensional diffusion). Equation 5 can be lin-earised after taking the logarithm two times, which gives which then can be used to extract n and k from a ln(−ln(1-α)) versus lnt plot. Using the Arrhenius relationship:
allows the calculation of the apparent activation energy Ea
and the preexponential factor A from the slope of a cor-responding Arrhenius plot. In many studies, the Avrami– Erofe’ev model is taken a priori, i.e. without independent control if the latter is really describing the rate-limiting step. The coefficient n is than extracted from the best fit, and the corresponding mechanism is presented as the rate-limiting step (Hancock and Sharp 1972).
Time to a given fraction method (TGF method)
The TGF method is an isothermal isoconversional tech-nique enabling the calculation of reaction progress-resolved apparent activation energies Eaα without using a specific reaction model f(α) (Burke 1965; Putnis 1992). For this, Eq. 4 has to be rewritten as follows:
Thus, the time tα(i), i.e. the time t necessary to reach a
cer-tain reaction progress αi, can be calculated by integrating 8: (4) dα dt =k(T )f (α) (5) α =1 − e−(kt)n (6) ln(− ln (1 − α)) = nlnk + nlnt (7) k =Ae−EaRT (8) dt = k−1f−1(α)dα (9) tαi=k −1 α=αi α=0 f−1(α)dα
Under the assumption that the reaction model f(α) will not change during the course of the reaction and is also independent of temperature, the integral in Eq. 9 is constant.
Values for Eaα can then be calculated from the Arrhenius plot ln(tα) versus 1/T [K−1].
Friedman method
With non-isothermal experiments, the error introduced by having to heat up the sample inherent to isothermal experi-ments is avoided. The following relationship holds for non-isothermal experiments:
The general non-isothermal rate equation with β = dT/ dt reads:
Friedman (1964) proposed a method to extract model-free values of Eaα from the logarithmic form of 11
An experimental series of different heating rates β can then be used to plot the linear relationship between ln(dα/ dt)iα and 1/Tiα at the same value of α reached at i different heating rates β to calculate model-free values of Eaα. ASTM e 698
Following this international standard routine (N.N. 1979), the maximum reaction rate of single-step reactions (non-isothermal conditions) is reached at the same degree of con-version independent of the heating rate β. Accordingly, it is possible to calculate the overall apparent activation energy from the slope of the logarithm of the heating rate versus the reciprocal absolute temperature of the maximum. Master plots
Non-isothermal and isothermal data obtained in the present experiments were analysed with the help of two independ-ent master plot approaches, the z(α) master plots (Vya-zovkin et al. 2011) and the generalised time master plots (Sánchez-Jiménez et al. 2013), in order to make inferences on possible reaction mechanisms and rate-limiting steps. Master plots are calculated and normalised reference curves for all possible reaction models, which do not depend on the numerical values of the kinetic parameters (Gotor et al. (10) dα dT = dα dt · dt dT (11) dα dT = A βe −EaRT f (α) (12) ln βdα dT =ln dα dt α,i = −Ea RT +ln Af (α)
2000). Comparison between these master plots and the nor-malised experimental data allows selecting the most appro-priate reaction model. The functions used to obtain these master plots should be independent of temperature (iso-thermal conditions) or heating rates (non-iso(iso-thermal condi-tions). The use of z(α) master plots has limitations when applied to reactions with a highly dynamic evolution of the apparent activation energy with reaction progress (Vya-zovkin et al. 2011). The master plot approach using the generalised time allows to cross-check the influence of a variable apparent Eaα (Ozawa 1986; Sánchez-Jiménez et al. 2013). An isoconversional data treatment to determine Eaα is a prerequisite for both master plot approaches.
The function for the z(α) master plots has been derived using the generalised time defined by Ozawa (1986). Inte-grating the general rate equations gives
Ozawa called the integral on the right-hand side general-ised time θ. The first derivative of generalgeneral-ised time is given by
The following master plot functions using the general-ised time are proposed (e.g. Vyazovkin et al. 2011):
The master curve of a model f(α) is given by the values of the right-hand product as function of α. In the follow-ing, only the z(α) master plot approach will be used. The position of the maxima z(α) is characteristic for the reac-tion model:
αmax is the reaction progress for which the maximum is observed. The curve derived from the experimental data is obtained by introducing the corresponding differential and integral general rate equations for f(α) and g(α), respec-tively. The resulting equation for non-isothermal conditions is
where π(x) is an approximation of the temperature integral and β the heating rate. Equation (18) has to be normalised to the reaction rate at α = 50 % and can be simplified by (13) g(α) = α ∫ 0 dα f (α) =A t ∫ 0 exp −E RT dt = Aθ (14) dθ dt =exp −E RT (15) y(α) = dα/dt dθ/dt = dα dθ = A −E RT f (α) −E RT =Af (α) (16) z(α) = dα dθθ = θ Af (α) = g(α)f (α) (17) z′(αmax) = g(αmax)f′(αmax) = −1
(18) z(α) = g(α)f (α) = dα dt α Tα2 π(x) βTα
removing the term in brackets as it has a negligible effect of the shape of the z(α) function (Al-Mulla et al. 2011; Vyazovkin et al. 2011). The normalised, simplified func-tion is given by
To draw the (normalised) experimental curve, the tem-perature and the rate as a function of reaction progress have to be extracted from the DTG curves.
The second master plot approach is also based on the generalised time θ (Ozawa 1986; Gotor et al. 2000; Sánchez-Jiménez et al. 2010), and the generalised reaction rate is given by
Normalising to a reaction progress of 50 % gives fol-lowing relationship between the generalised reaction rate and the experimental data for the non-isothermal case (Sánchez-Jiménez et al. 2013):
which simplifies to
for isothermal conditions. Experimental data are then sim-ply compared to a set of theoretical curves (Table 1).
Results and discussion
The dehydroxylation reaction as seen from thermogravimetry
A comparison between the first derivative graphs (DTG) of chrysotile (Fig. 3a) and those of brucite (Fig. 3b) illustrates different degrees in the complexity of the investigated reac-tions under an inert N2 atmosphere. The DTG plots of bru-cite are dominated by just one peak, whereas the curves for chrysotile have multiple shoulders on the flanks of the primary maximum, i.e. the dehydroxylation rate has sev-eral secondary maxima. A summary of the onsets, peak maxima and offsets of the TG analyses of both minerals is given in Table 2. The temperatures of all peak maxima (19) z(α) ∼= dα dt α dα dt 0.5 Tα T0.5 2 (20) dα dθ = dα dt exp −Ea RT (21) dα dθ dα dθ 0.5 = dα dt dα dt 0.5 exp EaαRT exp Eaα RT0.5 (22) dα dθ dα dθ 0.5 = dα dt dα dt 0.5
listed in Table 2 are a function of the heating rate, i.e. an increase in the heating rate shifts the respective maxima towards higher temperatures. A broadening tendency of the DTG features is evident in both samples. The DTG curve of chrysotile corresponding to a heating rate of 32 K min−1 is additionally characterised by an evident shoulder at the low-temperature side. The total release of H2O calculated
from the TG data yields 13.1 wt% in case of chrysotile and 29.6 wt% in case of brucite, respectively. In both cases, the estimated mass release deviates slightly from the theoreti-cal value (chrysotile 13.0 wt%, brucite 30.9 wt%), which is most probably due to the presence of impurities or defects.
All DTG maxima of chrysotile and brucite are similar to previously published data (e.g. Nahdi et al. 2009; Viti 2010). However, the shapes of the DTG curves for chry-sotile vary considerably between authors (e.g. Naumann and Dresher 1966; Viti 2010; Zaremba et al. 2010), which makes it difficult to compare the different datasets. In gen-eral, such variability in thermoanalytical data of phyllo-silicates is common and caused by physical and chemical properties specific to each sample, e.g. particle size distri-bution, presence of different polytypes and/or polymorphs within the sample, chemical heterogeneities (Bish and
Duffy 1990). In case of chrysotile, the particular crystal structure contributes to the variation in the dehydroxylation behaviour. The dehydroxylation temperature in nanotube-like chrysotile is radius dependent and will be higher in the innermost layers compared to the less curved outer parts of the chrysotile fibres.
The multiple natures of peak maxima in DTG curves of chrysotile are typical for a reaction scenario with (metasta-ble) reaction intermediates as inferred by Viti (2010) and experimentally demonstrated by MacKenzie and Mein-hold (1994), Gualtieri et al. (2012) and Trittschack and Grobéty (2013). The broad temperature range in which chrysotile dehydroxylates is related to the radius-depend-ent dehydroxylation temperature and the appearance of an H2O-containing talc-like intermediate phase, which breaks
down at even higher temperatures (Trittschack and Grobéty 2013). The much simpler DTG graphs of brucite seem to be indicative for a direct dehydroxylation and subsequent formation of periclase MgO without intervening (metasta-ble) phases as demonstrated by XRPD studies (Bearat et al. 2002; Nahdi et al. 2009). An obvious change in the shape of the chrysotile DTG curves with heating rate is an indi-cation for a change in the kinetic equation (Šesták 1984),
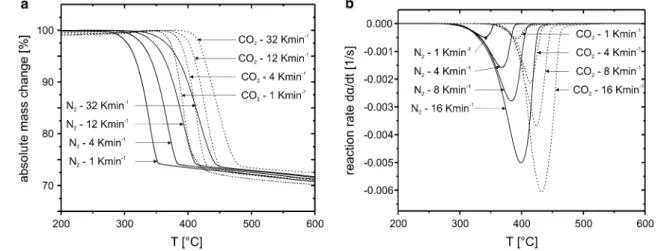
Fig. 3 Reaction rates of the dehydroxylation reactions of chrysotile a and brucite b under a constant flux of N2 (100 ml/min) determined from TG data
Table 2 Corresponding
maxima in DTG curves for chrysotile and brucite dehydroxylation experiments carried out under 100 ml/ min N2
Chrysotile Brucite
Onset (°C) Maxima (°C) Offset (°C) Onset (°C) Maximum (°C) Offset (°C)
1 K/min 445.2 522.5, 585.6, ~625 662.3 249.3 340.2 407.4 2 K/min 455.4 527.5, 599.9, ~632 682.4 253.0 353.1 420.9 4 K/min 464.5 538.8, 615.6, ~651 687.7 257.0 367.9 435.7 8 K/min 473.2 546.3, 631.3, ~667 706.7 260.5 383.4 448.8 12 K/min 481.3 556.1, 641.4, ~677 707.5 262.1 393.0 455.2 16 K/min 488.4 563.2, 649.0, ~680 710.4 263.3 399.0 459.1 32 K/min 532.9 577.5, 673.5, ~708 746.1 274.8 418.8 506.8
i.e. the rate-limiting step does depend not only on reac-tion progress but also on the heating rate. This point has to be considered in kinetic analysis as all isoconversional methods are based on the isoconversional principle, which states that the reaction rate at a constant reaction progress depends only on temperature (Vyazovkin and Wight 1997) and not on the heating rate.
The TG curves for the brucite Mg(OH)2 breakdown reaction under CO2 atmosphere show an interval of mass
gain before the main decomposition event (Fig. 4a). The gain itself is related to the formation of magnesite MgCO3 as shown by Bearat et al. (2002) and/or a series of crystal-water-bearing Mg carbonates (Hänchen et al. 2008). The main weight loss is due to a combination of dehydroxyla-tion of remaining brucite and decarbonisadehydroxyla-tion of magne-site (Fig. 4a, b). This combined breakdown event is shifted towards higher temperatures relative to the pure dehydrox-ylation reaction under N2. The total difference between N2 and CO2 runs decreases at higher heating rates (Fig. 4b). Despite the mass gain as a result of the formation of car-bonate-bearing species and two different breakdown reac-tions, there are no multiple decomposition peaks observ-able in the DTG curves. The total mass loss under CO2 relative to the maximum weight reached after the initial mass gain is 34–35 wt%, which is up to 7 wt% more than observed under a constant flux of N2. This corresponds to a formation of about 15 wt% carbonate under the chosen experimental conditions. The lack of multiple peaks might be related to a competitive reaction sequence, i.e. the for-mation of carbonate is directly linked with the breakdown of brucite.
The course of the apparent activation energies
The isoconversional treatment (Friedman method) of the non-isothermal DTG data gave a strongly
reaction-progress-dependent evolution of the apparent acti-vation energy in case of chrysotile (Fig. 5a). The evolu-tion is characterised by a first Ea maximum for α ≈ 0.15, followed by a decreasing trend up to α ≈ 0.5 and a final increase. The corresponding graph for brucite shows a weaker and generally decreasing evolution of the apparent activation energy with α (Fig. 6a). Several runs under iden-tical experimental conditions with the same sample mate-rial show a much poorer reproducibility of the Ea evolution
among the different runs than for brucite decomposition. However, the general trends remain the same in both cases.
A variable apparent Eaα of chrysotile can also be shown when using the ASTM E 698 method. The Eaα values that
correspond to the dehydroxylation rate maxima listed in Table 2 yield around 343 kJ/mol for the first, 272 kJ/mol for the main and 303 kJ/mol for the high-temperature maxima. The rate maxima match with a reaction progress of around 20, 50 and 90 %. All values calculated by this method are similar to those achieved by the Friedman treat-ment. HT-XRPD data of chrysotile treated by the TGF method (Fig. 5b) are compatible with data obtained by the Friedman approach applied to the TG data (Fig. 5a). But TGF-derived reaction-progress-resolved Ea does not cor-respond to the activation energy determining the rate at α, but to the gliding average Ea up to that respective α. Thus,
TGF-derived values cannot be compared directly with TG-derived data treated with the Friedman method. In addition, TGF data obtained for large α (α > 70 %) are also less reli-able. The evolution of the average Ea, however, is similar as
of the actual α-resolved Ea, but the changes are dampened. The evolution of the average Ea extracted by the TGF method from the brucite HT-XRPD runs (Fig. 6b) shows an opposite trend to the data obtained from the isoconver-sional treatment of the TG data. Nevertheless, the abso-lute values of the gliding average Ea, i.e. 120–140 kJ/mol (20 % ≤ α ≤ 80 %), are quite similar to those derived
from the Friedman treatment of the TG data in the equiva-lent α range. The differences between both datasets might be related to the isothermal technique, where the sample undergoes a heating-up stage prior to the real measurement. All reactions occurring during the heating-up stage are vir-tually lost and, therefore, not included within data derived from a subsequent mathematical treatment, e.g. the TGF method.
The reproducibility between individual HT-XRPD runs is worse than for TG-derived data. This is most likely caused by the geometry of the sample holder, i.e. a glass platelet positioned on a platinum stripe with the thermo-couple below. The contact between the glass platelet and the platinum stripe is not totally flat. Thus, the exact posi-tion of the sample may vary between individual experimen-tal runs. This may explain the higher variability/poor repro-ducibility of data obtained from HT-XRPD.
Compared to experiments conducted under inert N2
atmosphere, the influence of CO2 on the apparent activa-tion energies of the breakdown of brucite in TG and HT-XRPD data is quite distinct as all values are almost doubled in case of TG data and increased by around a quarter in XRPD data, respectively (Fig. 6a, b).
At least three different reactions take place in the pres-ence of CO2:
Brucite is always metastable in a pure CO2 atmosphere, i.e. as soon as the temperature and therefore the activa-tion energy are high enough, brucite will transform either
(a) Mg(OH)2+ CO2= MgCO3+ H2O (b) Mg(OH)2= MgO + H2O (c) MgCO3= MgO + CO2
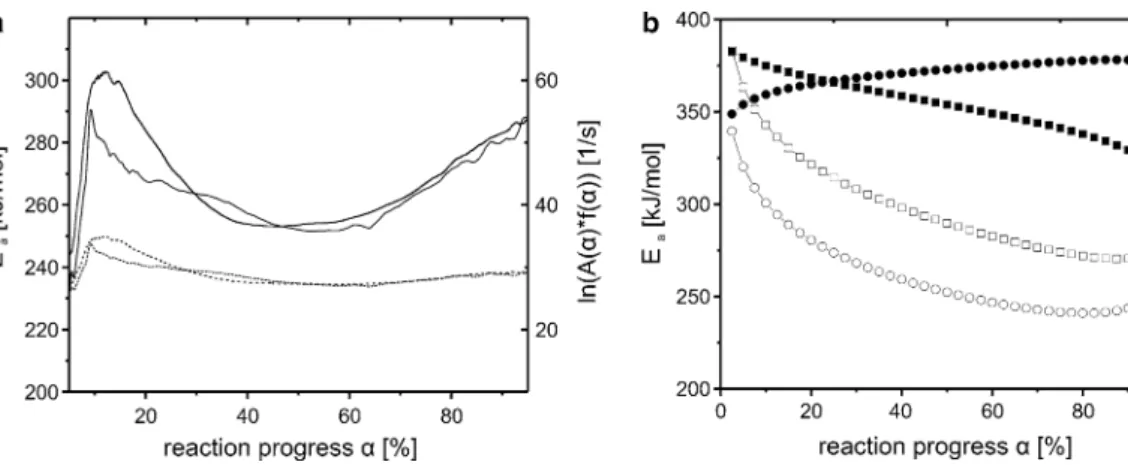
Fig. 5 Apparent Eaα of the chrysotile dehydroxylation as calculated from the isoconversional Friedman analysis of TG data (a) and the TGF method in case of HT-XRPD (b) of two individual runs; solid
lines = Eaα for two separate runs; dashed lines = corresponding ln(A(α)*f(α)) values; filled symbols = R2; open symbols = E
aα
Fig. 6 Course of the apparent Ea on the extent of conversion α determined from TG data of the brucite dehydroxylation under CO2 and N2 (a) and the course of the apparent Ea on the extent of con-version α determined from HT-XRPD data of brucite
dehydroxyla-tion under CO2 (triangles) and N2 (squares) (b); filled symbols = R2; open symbols = Eaα; solid lines = Eaα; dashed lines = corresponding ln(A(α)*f(α))
through reaction (a) or through a combination of reactions (b) and (c). This is confirmed by the initial weight gain, i.e. a weight gain below the onset of the brucite dehydroxy-lation under inert N2 atmosphere. A reaction involving hydrated carbonate species is also possible and would com-plicate the reaction sequence (Hänchen et al. 2008). For the chosen heating rates, it is impossible to achieve a comple-tion of the carbonacomple-tion reaccomple-tion (Bearat et al. 2002). Thus, the onset of the main weight loss is due to the presence of metastable brucite and magnesite. As values derived from XRPD measurement are taken from specific reflections of brucite only, all activation energies extracted from the TGF analyses can be attributed to the decomposition reactions (a) and (b) of brucite only. The activation energy calcu-lated for the onset of the brucite peak decrease (CO2, low α) is considerably higher than the initial activation energy of reaction (b) under N2 (Fig. 6b). To explain these differ-ences, two possibilities are favoured:
i. The higher values of Ea are due to a weighted average of reactions (a) and (b)
ii. There is a change in the rate-limiting step of reaction (b), i.e. the presence of a carbonate layer on the surface of brucite crystallites as inferred by Butt et al. (1996) causes a change in the reaction mechanism.
Experimental, model-free values for Ea of reaction (b) under N2 atmosphere reported in literature vary between 45 and 188 kJ/mol (Halikia et al. 1998; Nahdi et al. 2009).
Ab initio calculation gave a value of 180 kJ/mol for reac-tion (2) and values of around 226 kJ/mol for the carbona-tion reaccarbona-tion (Churakov et al. 2004). Because the weight change observed by TG in the same temperature interval as in HT-XRPD experiments is negative, the contribution of reaction (b) to the overall decomposition reaction must be more important than reaction (a) as the carbonation is increasing the weight of the sample. Even when taking the reported Ea value for reaction (a), the contribution of
reaction (a) would have to be almost 100 % to explain the observed Ea. But, this would cause a weight gain instead of a loss as observable in our data. Thus, a change in the rate-limiting step in reaction (b) due to the presence of a carbonate layer is more likely and might be causal for the increase to much higher Ea under CO2 atmosphere when compared to the N2 runs. The steep increase in Ea deter-mined from the TG data beyond α > 0.8 is probably related to the breakdown of magnesite, which in a pure CO2 atmosphere with pCO2 = 1 bar is stable to approximately 500 °C (Bearat et al. 2002). Therefore, the initial weight loss seems to have no contribution to reaction (a). The final
Ea values of the brucite decomposition experiments under
CO2 are considerably higher than reported values for the magnesite decomposition in literature (156 kJ/mol N2 flux,
Liu et al. 2012) and the values of reaction (b) under nitro-gen. Unfortunately, there are no kinetic data on the mag-nesite decomposition under a CO2 atmosphere in literature. As magnesite starts to decarbonise only at approximately 500 °C under a CO2 atmosphere (Stone 1954), which cor-responds to a reaction progress beyond 50 % in our TG data, the decarbonisation reaction must have a much higher contribution towards the end of the studied decomposition reaction. Thus, we suppose that the final increase is caused by a coupled reaction composed of the breakdown of mag-nesite and remnants of brucite.
Towards a mechanistic interpretation
Brucite
As mentioned earlier, the DTG data of brucite shown in Fig. 3b suggest a reaction sequence governed by a sin-gle rate-determining step as there are no indications for shoulders or a heating-rate-dependent change in the shape of DTG curves. The continuously decreasing value of the apparent Ea with α (TG dataset) is, however, not
compat-ible with such a simple scenario. The change in Ea seems to indicate a change in the rate-limiting step (reaction model(s)) or a change in the contribution of rate-limiting reaction steps (Vyazovkin 2000). If parallel reaction steps are rate-limiting, each contributes to the apparent activation energy (Vyazovkin 2000):
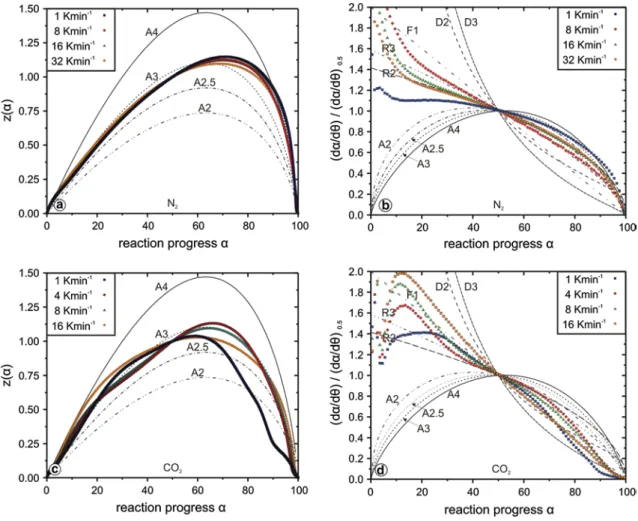
Given that non-isothermal TG data are more reliable than isothermal HT-XRPD data with respect to the course of the apparent activation energy and the dehydroxylation rate, it is useful to check whether the resulting data can be described by one of the master plot techniques outlined in the experimental section. Figure 7a, b shows a comparison of experimental data with theoretical curves calculated for a number of commonly used reaction models presented in Table 1. It is evident from Fig. 7a that the dehydroxyla-tion reacdehydroxyla-tion mechanism of brucite under nitrogen atmos-phere is only slightly affected by the heating rate. This is in contradiction with earlier findings of Yue et al. (2005) who claim a heating-rate-dependent change in the reaction mechanism. They suggest an A1.5 or A2 mechanism for the entire reaction progress with a trend to the A1.5 model when increasing the heating rate.
In general, data presented here support an An mech-anism with a good agreement with the A3 model up to α ≤ 60 %, but changing to an A4 model in the range 90 % ≤ α ≤ 100 %. However, the maxima zmax(α) of
indi-vidual experimental curves in Fig. 7a are not close enough (23) Eaα= −R d ln�dαdt� dT−1 α = E1k1f1(α) + · · · + Eikifi(α) k1f1(α) + · · · + kifi(α)
to the theoretical values of αp = 0.632 and 63.2 %, respec-tively, indicative of an An mechanism (Vyazovkin et al. 2011). This is not surprising when considering the varia-tion in Ea. The method presented by Sánchez-Jiménez et al. (2013) uses directly the generalised time and does not depend on a constant apparent Eaα. It is therefore
much better suited than the z(α) master plot approach to analyse complex reaction mechanism. Correspond-ing curves of experimental data in Fig. 7b point towards a phase-boundary-controlled mechanism (R2, R3) between 15 % ≤ α ≤ 60 % before following the paths of A2–A3 models without a possibility to distinguish clearly between the respective mechanisms. The obvious mismatch at 0 % ≤ α ≤ − 10 % might be related to artefacts in the cal-culation of Eaα.
The best-fitting mechanistic models for the second part of the dehydroxylation reaction (α ≥ 60 %) agree well with controlled-rate thermal analysis (CRTA) data of the brucite decomposition of Nahdi et al. (2009) who suggest an A2 and/or A3 model for the entire reaction. The R-type model suggested by the master plots for the
first part of the reaction is supported by kinetic, micro-scopic and diffraction studies by Gordon and Kingery (1966, 1967) who proposed a nucleation- and growth-governed mechanism accompanied by extensive cracking of the primary phase (R3 mechanism). A R3 model was also proposed by Hancock and Sharp (1972) in the range 15 % ≤ α ≤ 50 %. However, their mechanistic interpre-tation might be influenced by the isothermal approach. van Aken and Langenhorst (2001)verified former findings of Hancock and Sharp (1972) and Gordon and Kingery (1966, 1967) concerning a R3 mechanism by transmission electron microscopy. They demonstrated a complex multi-step reaction mechanism including at least two stages of an interface-controlled process, one at the reaction onset and one towards the end. Both R3-dominated stages are interrupted by a diffusion-controlled stage, which cannot be seen in our data. There are no further hints regarding a specific diffusion model within the article of van Aken and Langenhorst (2001).
The use of CO2 as reactive gas instead of an inert N2 atmosphere complicates the decomposition reaction by
Fig. 7 Comparison between theoretical z(α) and generalised time master plots, respectively, and experimental non-isothermal TG data of the
the simultaneously occurring carbonisation reaction. The decarbonisation of magnesite will overlap with the dehy-droxylation towards the end of the reaction progress. Resulting master plots of this reaction are presented in Fig. 7c, d.
Figure 7c clearly illustrates a heating-rate-dependent reaction mechanism scenario compared to the dehydroxy-lation under a constant flux of N2 (Fig. 7a). The experi-mental curves are lacking the smooth shape expected for a reaction controlled by a single step. The generalised time master plots (Fig. 7d) clearly show that also under CO2 atmosphere, the rate-limiting reactions are dependent on the heating rate. An unambiguous identification of the rate-limiting mechanisms is not possible. At a low reac-tion progress, there is no fit with any master curve, but for 30 % < α < 80 %, the rate-limiting steps are R-type for the two intermediate heating rates and between F-type and D-type for the highest heating rate. At α = 80–90 %, the curves change their curvature with a trend towards a diffu-sion model (D3). At this reaction progress, a fast increase in Eaα is observed (Fig. 6a). All published data for decar-bonisation of magnesite are for experiments using nitrogen or another inert gas atmosphere. The reported mechanisms range from three-dimensional (D3) diffusion (Liu et al. 2012), first-order reaction (F1) (Demir et al. 2003) and con-tracting sphere model (R3) (Hurst 1991). The activation energies for the decomposition under nitrogen are lower than the values observed here (160–300 kJ/mol).
The large influence of the heating rate on the reac-tion mechanism is compatible with former studies of Butt et al. (1996) and Bearat et al. (2002). They observed that the amount of carbonates formed during the decomposi-tion reacdecomposi-tion of brucite (CO2 atmosphere) is a function of both temperature and CO2 pressure. However, the influence
of the latter was not a field of interest in this study. Slow heating rates are more favourable for the formation of car-bonates than fast heating rates as the dwell time in a cer-tain temperature range is an inverse function of the heating rate itself. Thus, the rate-determining mechanisms must be a function of the heating rate, too. This hypothesis can be verified by the non-isothermal dataset of this study, which can best be shown in Fig. 7c, d. A reaction governed by a contracting sphere model (R3) and three-dimensional diffu-sion is also compatible with findings of Butt et al. (1996). They use the R3 model for the main dehydroxylation inter-val (350–400 °C) only. At the highest temperature reached, i.e. an advanced reaction progress far beyond 50 %, they justify a reaction complicated by diffusion with the forma-tion of a nanocrystalline carbonate barrier around brucite crystallites which inhibit the outward diffusion of H2O and
the inward diffusion of CO2. This process might be com-patible with the latest stage seen in our data (Fig. 7d at α ≥ 80 %).
Chrysotile
Multiple maxima in the reaction rate (Fig. 3a) and the variation in Ea with α (Fig. 5a) are obvious signs, for a multi-step dehydroxylation reaction of chrysotile, i.e. the rate-limiting step(s) changes with α. The nature of pos-sible rate-limiting steps has been identified by in situ HT-XRPD, Raman and FTIR spectroscopy as well as ex situ TEM analyses (Gualtieri et al. 2012; Trittschack and Grobéty 2013). The nanotube structure of chrysotile dehy-droxylates from the outer, less curved sheets inwards. The first reaction products are a strongly disordered chrysotile-like phase plus a talc-chrysotile-like phase (Trittschack and Grobéty 2013).
The storage of OH groups within a talc-like intermedi-ate phase might be causal for the multiple dehydroxylation peaks observable in TGA. The metastable talc-like phase starts to dehydroxylate towards the end of the overall dehy-droxylation reaction (Trittschack and Grobéty 2013).
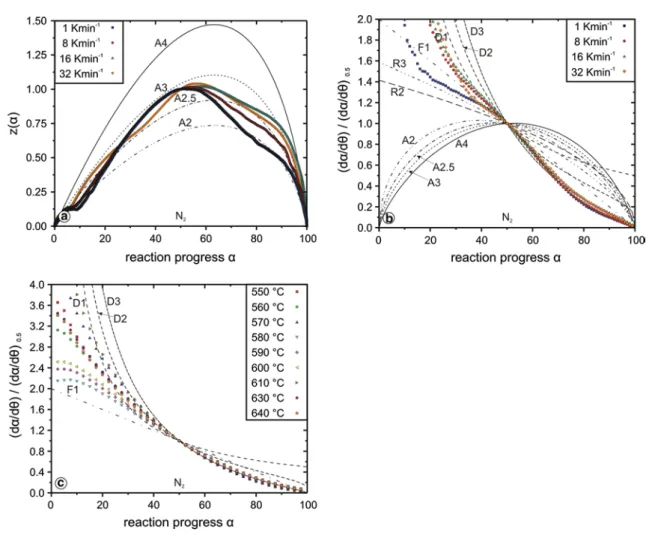
Figure 8a, b demonstrates a heating-rate-dependent change in the reaction mechanism of the dehydroxylation, especially between the reaction measured at the lowest heating rate and all other curves. This dependency primar-ily results from a variable amount of OH stored in the talc-like intermediate phase, which is a function of temperature and heating rate, respectively. Such behaviour is similar to that observed during the brucite decomposition under CO2. Thus, the slower the heating rate, the higher the amount of OH preserved during the primary dehydroxylation step of chrysotile, which afterwards has to be released by the breakdown of the talc-like intermediate itself. This inter-pretation is sustained by compatible reaction sequences of lizardite and antigorite (Gualtieri et al. 2012).
The curve corresponding to a heating rate of 1 K/min is close to the R3 master curve (α ≤ 50 %) and indicates, therefore, a reaction whose rate is controlled by an interface reaction. For all other heating rates (Fig. 8b), the experi-mental curves at α ≤ 50 % are close for the master curve, indicating a reaction controlled by one-dimensional diffu-sion. At a more advanced reaction progress (α ≥ 50 %), non-isothermal (Fig. 8b) and isothermal data (Fig. 8c) point towards two- and three-dimensional diffusion models (D2 followed by D3), respectively. Thus, the evacuation of the (gaseous) H2O products by diffusion seems to control the reaction rate. Such findings are consistent with former scenarios presented by Cattaneo et al. (2003) and Alizade-hhesari et al. (2012). However, both investigations present some pitfalls, which should be kept in mind when com-pared with our data. Alizadehhesari et al. (2012) studied a serpentine mixture without identifying the mineral compo-sition in detail. As the crystal structure of serpentine min-erals is quite different between the different polymorphs, e.g. flat lying lizardite, cylindrical chrysotile and wavy
antigorite, kinetic data obtained from serpentine mixture will represent averages of the polymorphs present. Results of Cattaneo et al. (2003) are based on the Avrami–Erofe’ev approach applied to isothermal data only. Thus, similar to our own HT-XRPD experiments, the kinetic parameters, especially those derived from high-temperature runs, are extracted from a few data points only. The data are also extracted from a narrow temperature range, which disre-gards all processes occurring during the heating-up cycle of the experiment. These outlined disadvantages might also be the reason for the scatter of the data at α ≤ ~30 % in Fig. 8c, which do not fit any of the most commonly used kinetic models. Master plots using isothermal data often depict less (complex) reaction mechanisms than those of non-isothermal experiments. A potential nucleation and growth mechanism (An model) related to the appearance of disordered chrysotile or the talc-like intermediate phase might be invisible as long as such a rate-controlling mecha-nism acts during the initial dehydroxylation and therefore the heating up of an isothermal run. Some indications for an An mechanism acting at an early stage (α ≤ ~10 %)
of the dehydroxylation are visible in the z(α) master plot (Fig. 8a).
Three trends in the Eaα plot (Fig. 5a), i.e. decreasing Ea (15 % ≤ α ≤ 30 %), almost constant Ea (30 ≤ α ≤ 60/70 %)
and increasing Ea (60/70 ≤ α ≤ 100 %), coincide roughly with a matching of a D1, D2 and D3 mechanism in Fig. 8b. As (in the present case) TG data mainly reflect the behav-iour of H2O and OH, respectively, one can derive a progres-sively more complex dehydroxylation reaction whose rate is determined by diffusion. Different parallel recombina-tion reacrecombina-tions of adjacent hydroxyl groups to form a water molecule have been proposed as first rate-determining steps in case of lizardite (Trittschack and Grobéty 2012). Such a mechanism is affecting the octahedral sheet only (McKelvy et al. 2006; Trittschack and Grobéty 2012). The local envi-ronment is, except the curvature of the layer, very similar in lizardite and chrysotile. Therefore, similarities in the reac-tion mechanisms are not surprising. Hydroxyl combinareac-tion to form an H2O molecule is also favoured as the first step of dehydroxylation of kaolinite (White et al. 2010; Sper-inck et al. 2011), pyrophyllite (Molina-Montes et al. 2008)
Fig. 8 Comparison between theoretical z(α) and generalised time master plots, respectively, and experimental non-isothermal TG (a, b) data as
and muscovite (Guggenheim et al. 1987; Mazzucato et al. 1999).
The dehydroxylation mechanisms of phyllosilicates are generally described as follows (e.g. Redfern 1987; Bellotto et al. 1995; Mazzucato et al. 1999; Cattaneo et al. 2003; Gualtieri and Ferrari 2006; Gridi-Bennadji and Blanchart 2007; Tokiwai and Nakashima 2010): (1) reaction of two adjacent hydroxyl groups to form one H2O molecule or the formation of OH− and/or H+ species (D1, one-dimensional diffusion) plus an O− vacancy, which becomes structurally bounded; (2) diffusion of the resulting species to the inter-layer, if necessary (D1 or D2, one- or two-dimensional dif-fusion); (3) diffusion along the interlayer or along (001) to the edges of a crystallite (D2, two-dimensional diffusion). The nature of the diffusing species is still disputed. Already Rouxhet (1970) stressed the possibility for a proton hop-ping mechanism instead of H2O bulk diffusion during the dehydroxylation of mica. The spectroscopic attempt of Zhang et al. (2010) to identify H2O as transport medium
during dehydroxylation of a series of phyllosilicates failed. They suggest, therefore, a transport of hydroxyl and/or protons to the sample surface where water molecules are finally formed. Nevertheless, first product species, what-ever they are, have to leave the reaction site to keep on run-ning the dehydroxylation progress.
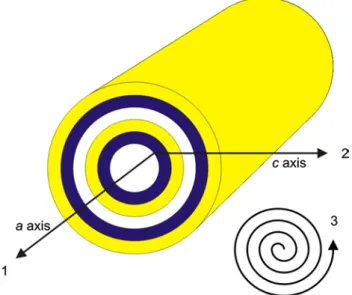
Possible/theoretical diffusion paths in the peculiar struc-ture of chrysotile are illustrated in Fig. 9. In general, there are two possible directions along the interlayer, i.e. along the crystallographic a and b axes or a combination of both. A third possibility, usually labelled as radial diffusion, is
across the TO layers towards the inner tube channel or towards the outer wall of the nanotube/edge of the chry-sotile crystal. A radial diffusion towards the tube channel requires a subsequent diffusion along the tube channel towards the end of a chrysotile nanotube. But, these theo-retical diffusion paths do not take into account the forma-tion of a metastable talc-like intermediate and forsterite.
There are few examples in the literature showing the influence of product species on the dehydroxylation kinet-ics of phyllosilicates. Ortega et al. (2010) mentioned that the formation of metakaolinite during the dehydroxylation of kaolinite closes the interlamellar space initially used for the outward diffusion of H2O molecules. They subsequently conclude that the change in diffusion paths after the closure is responsible for the change in the rate-determining step and the increase in Ea. However, they do not discuss details of such a change in the rate-determining step.
Caused by the appearance of an H2O-containing
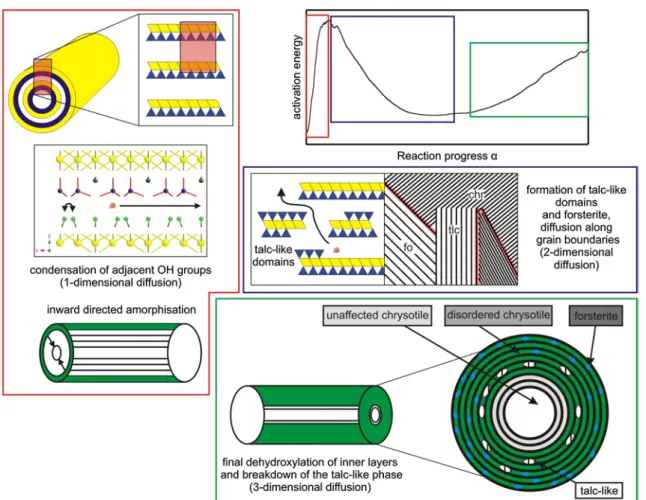
inter-mediate phase, we propose an alternative dehydroxylation scenario, which is also explainable by the herein docu-mented findings. A scheme summarising the model is illus-trated in Fig. 10. At first, the dehydroxylation starts with a condensation of adjacent hydroxyl groups to form an H2O molecule or the liberation of OH− and/or H+ to dif-fuse along the interlayer (one-dimensional diffusion). This process starts along the outer sheets as proposed by the chrysotile structure (Evans 2004). An inward-migrating dehydroxylation front causes a predominantly amorphous outer layer (disordered chrysotile), which inhibits a bulk diffusion/radial diffusion. This process is accompanied by a fast increase in Ea (until Ea = max at α = 10–20 %). Later on, the formation of a talc-like phase and forsterite takes place within the inward-moving amorphous layer (Trittschack and Grobéty 2013). The formation of first product phases enables one-dimensional diffusion along interlayer remnants of chrysotile and two-dimensional dif-fusion along newly formed grain boundaries. The increase in the relative amount of nucleation sites of forsterite and the talc-like phase increases the amount of grain bounda-ries. This process accelerates the diffusion and causes therefore a decreasing tendency in Ea. The final increase in
Ea (α ≥ 60 %) and the simultaneous change from a
two-dimensional mechanism to a three-two-dimensional diffusion (Fig. 8b, c) might be caused by the final dehydroxylation of the inner sheets and the breakdown of the talc-like inter-mediate itself. The proposed multi-step dehydroxylation mechanisms do not exclude the theoretical diffusion path-ways in primary chrysotile, but focus on interface-/grain-boundary-related diffusion pathways between the primary host structure and newly formed phases (talc-like interme-diate and forsterite).
High-temperature dehydroxylation experiments of liz-ardite examined by infrared spectroscopy have shown that
Fig. 9 Theoretical diffusion pathways for the crystal structure of
normal chrysotile/clinochrysotile; 1 along the interlayer and the tube channel, respectively; 2 radial diffusion parallel to the crystal-lographic c axis, i.e. vertical to the TO layers; 3 ‘circular’ diffusion along the interlayer (b axis or a mixture between a and b axis)
some of the liberated OH groups are trapped in nominally anhydrous forsterite (Trittschack unpublished work). Simi-lar observations were made during dehydroxylation experi-ments of kaolinite where more than 10 % persist within the structure (MacKenzie et al. 1985; Watanabe et al. 1987). Those OH remnants are difficult to remove within the tem-perature range of the primary dehydroxylation reaction and may also contribute to a significant increase in Ea.
Concluding remarks
Reaction kinetics of the thermally induced decomposition/ dehydroxylation of chrysotile and brucite were investigated by non-isothermal TG and isothermal HT-XRPD analyses. The kinetic data obtained from the two analytical tech-niques are compatible with each other, i.e. the evolution of
Eaα, with α, and the rate-limiting steps derived from
mas-ter plots are similar, for both chrysotile and brucite, respec-tively. Chrysotile dehydroxylation experiments gave vari-able Eaα values in the range of around 250–300 kJ/mol (TG
data) and 250–380 kJ/mol (HT-XRPD). This evolution is compatible with a change in the rate-limiting step with α. Brucite decomposition under nitrogen shows a decreasing trend for Eaα with α in TG data, while HT-XRPD data point to a slightly increasing trend with activation energies in the range of 110–160 kJ/mol. A larger variation in Ea versus α
is seen in data obtained from brucite dehydroxylation exper-iments under CO2 atmosphere. There, activation energies are significantly increased with values of around 270 kJ/mol at an early stage of the reaction (α = 10 %), which slowly decrease to around 250 kJ/mol (α = 50 %) before rising up again to values larger than 350 kJ/mol (α = 90 %). Con-trary to that, HT-XRD-derived kinetic data illustrate a lin-early decreasing trend of Ea versus α with Ea = 220 kJ/mol
(α = 10 %) to 180 kJ/mol (α = 90 %). Differences between TG and HT-XRPD data are interpreted as resulting from different processes studied, i.e. brucite dehydroxylation in HT-XRPD data versus brucite–Mg–carbonate bulk decom-position in TG data.
The attempt to compare acquired kinetic data with theo-retical reaction models in z(α) master plots failed in case
Fig. 10 Schematic sketch summarising the proposed multi-step
reaction mechanism scenario of the chrysotile dehydroxylation. The colour-coded windows correspond to three different stages of the Ea
versus reaction progress graph. Although they are acting simultane-ously, the proposed mechanisms are interpreted as the rate-determin-ing mechanism for the respective stage of the reaction
of multi-step reaction sequences as observed during chry-sotile dehydroxylation and brucite decomposition under CO2. The z(α) master plot approach of the brucite dehy-droxylation under N2 yields a good fit with A-type master curves, although the reaction is not controlled by one and the same step across the entire reaction progress range. This is a strong caveat against using z(α) master plots in cases of variable Ea versus α, even in case of brucite whose reaction-progress-resolved Ea is less dynamic than that of chrysotile. The method may yield good fits, which are, however, pure coincidence. In contrast to that, master plots using the generalised time are better suited to unravel mul-tiple reaction mechanisms in case of the dehydroxylation of chrysotile and brucite under nitrogen atmosphere. Mecha-nistic information taken from these plots is also compatible with former literature studies. However, corresponding data of the brucite decomposition under CO2 are less consistent and difficult to interpret.
References
Alizadehhesari K, Golding SD, Bhatia SK (2012) Kinetics of the dehydroxylation of serpentine. Energ Fuel 26:783–790
Al-Mulla A, Mathew J, Al-Omairi L, Bhattacharya S (2011) Thermal decomposition kinetics of tricomponent polyester/polycarbonate systems. Polym Eng Sci 51:2335–2344
Ballirano P, Melis E (2009) Thermal behaviour and kinetics of dehydroxylation of gypsum in air from in situ real-time labora-tory parallel-beam X-ray powder diffraction. Phys Chem Miner 36:391–402
Bamford CH, Tipper CFH (1980) Comprehensive chemical kinetics. Reactions in the solid state, vol 22. Elsevier, Amsterdam
Bearat H, McKelvy MJ, Chizmeshya AVG, Sharma R, Carpenter RW (2002) Magnesium hydroxide dehydroxylation/carbonation reac-tion process: implicareac-tions for carbon dioxide mineral sequestra-tion. J Am Ceram Soc 85:742–748
Bellotto M, Gualtieri A, Artioli G, Clark SM (1995) Study of the kaolinite-mullite reaction sequence. Part I: kaolinite dehydroxy-lation. Phys Chem Miner 22:207–214
Bish DL, Duffy CJ (1990) Thermogravimetric analysis of minerals. In: Mumpton FA (ed), Cms workshop lectures, vol 3. Thermal analysis in clay sciences. The Clay Minerals Society, Boulder Bray HJ, Redfern SAT (2000) Influence of counterion species on the
dehydroxylation of Ca2+-, Mg2+-, Na+- and K+-exchanged
Wyo-ming montmorillonite. Mineral Mag 64:337–346
Brown ME (1987) Quantitative thermoanalytical studies of the kinet-ics and mechanisms of the thermal decomposition of inorganic solids. Thermochim Acta 110:153–158
Brown ME, Maciejewski M, Vyazovkin S et al (2000) Computational aspects of kinetic analysis part A: the ICTAC kinetics project— data, methods and results. Thermochim Acta 355:125–143 Burke J (1965) The kinetics of phase transformation in metals.
Perga-mon Press Inc., Oxford, p 226
Burnham AK (2000) Computational aspects of kinetic analysis part A: the ICTAC kinetics project—multi-thermal-history model-fit-ting methods and their relation to isoconversional methods. Ther-mochim Acta 355:165–170
Butt DP, Lackner KS, Wendt CH, Conzone SD, Kung H, Lu YC, Brem-ser JK (1996) Kinetics of thermal dehydroxylation and carbonation of magnesium hydroxide. J Am Ceram Soc 79:1892–1898
Carbone M, Ballirano P, Caminit R (2008) Kinetics of gypsum dehy-dration at reduced pressure: an energy dispersive X-ray diffrac-tion study. Eur J Mineral 20:621–627
Cattaneo A, Gualtieri AF, Artioli G (2003) Kinetic study of the dehy-droxylation of chrysotile asbestos with temperature by in situ XRPD. Phys Chem Miner 30:177–183
Cheong S, Watt J, Ingham B, Toney MF, Tilley RD (2009) In situ and ex situ studies of platinum nanocrystals: growth and evolution in solution. J Am Ceram Soc 131:14590–14595
Chollet M, Daniel I, Koga KT, Petitgirard S, Morard G (2009) Dehy-dration kinetics of talc and 10Å phase: consequence for subduc-tion. Earth Planet Sc Lett 284:57–64
Churakov SV, Iannuzzi M, Parrinello M (2004) Ab initio study of dehydroxylation-carbonation reaction on brucite surface. J Phys Chem B 108:11567–11574
Datta AK (1991) Dehydration of chrysotile asbestos: an infrared absorption study. J Mater Sci Lett 10:870–871
Datta AK, Mathur BK, Samantaray BK, Bhattacherjee S (1987) Dehydration and phase transformation in chrysotile asbestos-a radial distribution study. Bull Mater Sci 9:103–110
Demir F, Dönmez B, Okur H, Sevim F (2003) Calcination kinetic of magnesite from thermogravimetric data. Chem Eng Res Des 81:618–622
Evans BW (2004) The serpentinite multisystem revisited: chrysotile is metastable. Int Geol Rev 46:479–506
Ferrage E, Kirk CA, Cressey G, Cuadros J (2007) Dehydration of Ca-montmorillonite at the crystal scale. Part 2. Mechanisms and kinetics. Am Mineral 92:1007–1017
Flynn JH, Wall LA (1966) A quick direct method for determination of activation energy from thermogravimetric data. J Polym Sci Polym Lett 4:323–328
Friedman HL (1964) Kinetics of thermal degradation of char-forming plastics from thermogravimetry. Application to phenolic plastic. J Polym Sci Polym Sym 6:183–195
Galwey AK (2004) Is the science of thermal analysis kinetics based on solid foundations? A literature appraisal. Thermochim Acta 413:139–183
Galwey AK, Brown ME (2002) Application of the Arrhenius equation to solid state kinetics: can this be justified? Thermochim Acta 386:91–98
Gordon RS, Kingery WD (1966) Thermal decomposition of brucite: I, electron and optical microscope studies. J Am Ceram Soc 49:654–660
Gordon RS, Kingery WD (1967) Thermal decomposition of bru-cite: II, kinetics of decomposition in vacuum. J Am Ceram Soc 50:8–14
Gotor FJ, Criado JM, Malek J, Koga N (2000) Kinetic analysis of solid-state reactions: the universality of master plots for analyz-ing isothermal and nonisothermal experiments. J Phys Chem A 104:10777–10782
Gridi-Bennadji F, Blanchart P (2007) Dehydroxylation kinetic and exfoliation of large muscovite flakes. J Therm Anal Calorim 90:747–753
Gualtieri AF, Ferrari S (2006) Kinetics of illite dehydroxylation. Phys Chem Miner 33:490–501
Gualtieri AF, Giacobbe C, Viti C (2012) The dehydroxylation of ser-pentine group minerals. Am Mineral 97:666–680
Guggenheim S, Chang YH, Koster van Gross AF (1987) Musco-vite dehydroxylation: high-temperature studies. Am Mineral 72:537–550
Halikia I, Neou-Syngouna P, Kolitsa D (1998) Isothermal kinetic analysis of the thermal decomposition of magnesium hydroxide using thermogravimetric data. Thermochim Acta 320:75–88 Hänchen M, Prigiobbe V, Baciocchi R, Mazzotti M (2008)
Precipita-tion in the Mg-carbonate system-effects of temperature and CO2 pressure. Chem Eng Sci 63:1012–1028