HAL Id: hal-01930927
https://hal.archives-ouvertes.fr/hal-01930927
Submitted on 13 May 2020HAL is a multi-disciplinary open access archive for the deposit and dissemination of sci-entific research documents, whether they are pub-lished or not. The documents may come from teaching and research institutions in France or abroad, or from public or private research centers.
L’archive ouverte pluridisciplinaire HAL, est destinée au dépôt et à la diffusion de documents scientifiques de niveau recherche, publiés ou non, émanant des établissements d’enseignement et de recherche français ou étrangers, des laboratoires publics ou privés.
High PAH degradation and activity of degrading
bacteria during alfalfa growth where a contrasted active
community developed in comparison to unplanted soil
Amélia Bourceret, Corinne Leyval, Pierre Faure, Catherine Lorgeoux, Aurélie
Cebron
To cite this version:
Amélia Bourceret, Corinne Leyval, Pierre Faure, Catherine Lorgeoux, Aurélie Cebron. High PAH degradation and activity of degrading bacteria during alfalfa growth where a contrasted active com-munity developed in comparison to unplanted soil. Environmental Science and Pollution Research, Springer Verlag, 2018, 25 (29), pp.29556 - 29571. �10.1007/s11356-018-2744-1�. �hal-01930927�
High PAH degradation and activity of degrading bacteria during alfalfa growth where a 1
contrasted active community developed in comparison to unplanted soil 2
Amélia Bourceret1,2, §, Corinne Leyval1,2, Pierre Faure1,2, Catherine Lorgeoux3, Aurélie
3
Cébron1,2 †
4
1Université de Lorraine, LIEC UMR7360, Faculté des Sciences et Technologies, Bd des Aiguillettes, BP 70239,
5
54506 Vandoeuvre-lès-Nancy, France. 6
2CNRS, LIEC UMR7360, Faculté des Sciences et Technologies, Bd des Aiguillettes, BP 70239, 54506
7
Vandoeuvre-lès-Nancy, France. 8
3Université de Lorraine, CNRS, CREGU,GeoRessourcesLab.,UMR 7359,Faculté des Sciences et Technologies,
9
Bd des Aiguillettes, BP 70239, 54506 Vandoeuvre-lès-Nancy, France. 10
§Current affiliation: Department Plant Microbe Interactions, Max Planck Institute for Plant Breeding Research,
11
50829 Köln, Germany. 12
13
† Corresponding author: aurelie.cebron@univ-lorraine.fr; phone: (+33) 383684296
14
Key words: historically contaminated soil, alfalfa, rhizosphere, RNA, bacterial diversity, 15
PAH-degraders, functional community 16
Abstract
17
PAH biodegradation in plant rhizosphere has been investigated in many studies, but the
18
timescale of degradation and degrading bacteria activity was rarely considered. We explored
19
the impact of plants on the temporal variability of PAH degradation, microbial abundance,
20
activity and bacterial community structure in a rhizotron experiment. A historically
21
contaminated soil was spiked with PAHs, planted or not with alfalfa, over 22 days with
22
sampling once a week. In both conditions, most of the spiked PAHs were dissipated during
23
the first week, conducting to polar polycyclic aromatic compound production and to
24
decreased richness and diversity of bacterial communities. We showed a rapid impact of the
25
rhizosphere on PAH degradation via the increased activity of PAH-degrading bacteria. After
26
12 days, PAH degradation was significantly higher in the planted (100% degradation) than in
27
unplanted (70%) soil. Gram-negative (Proteobacteria) PAH-dioxygenase genes and
28
transcripts were higher in planted than unplanted soil and were correlated to the spiked PAH
29
degradation. Conversely, Gram-positive (Actinobacteria) PAH-dioxygenase gene
30
transcription was constant over time in both conditions. At 12 days, plant growth favoured the
activity of many Gamma-Proteobacteria (Pseudomonadaceae, Stenotrophomonas and
32
Acinetobacter) while in unplanted soil Alpha-Proteobacteria (Sphingomonadaceae,
33
Sphingobium and Magnetospirillum) and Actinobacteria (Iamia, Geodermatophilaceae, and
34
Solirubrobacterales) were more active.
35 36
Introduction
37
Polycyclic Aromatic Hydrocarbons (PAHs) are organic pollutants resulting from coal-related
38
activities (coking plants, gas plants) and derived activities (iron- and steel-production plants).
39
These toxic compounds are persistent in the environment. Their high hydrophobicity, which
40
leads to adsorption to the soil matrix, reduces their bioavailability to microorganisms (Bogan 41
and Sullivan 2003). This aging process decreases PAH bioavailability in soils over time, and
42
slows down the rate of PAH biodegradation (Allard et al. 2000). Microbial diversity also
43
evolves over time, suggesting an adaptation to contamination (Bourceret et al. 2016). Thus, it
44
is essential to better understand the temporal variations in microbial activity, to monitor it,
45
and to relate it to the dynamics of PAHs in soils. To address this, many studies have used soils
46
spiked with model PAH compounds (Allard et al. 2000; Thomas and Cébron 2016), but this
47
makes them more bioavailable and therefore more degradable than aged PAHs in historically
48
contaminated soils. Therefore it is appeared to us more realistic to study the biodegradation of
49
a complex mixture of PAHs so as to investigate the activity of autochthonous microbial
50
populations from aged contaminated soils and involved in biodegradation (Cébron et al. 51
2013).
52
Rhizodegradation is a cost-effective and environment-friendly process using microorganisms
53
associated to roots to dissipate soil organic pollutants, such as PAHs (Haritash and Kaushik 54
2009). Plants release root exudates composed of sugars, amino and organic acids, among
55
other compounds (Walker et al. 2003; Gao et al. 2015). They provide carbon growth sources
56
for microorganisms, and biosurfactant compounds that increase PAH bioavailability and
57
dissipation (Joner et al. 2002; Zhou et al. 2011). In PAH-contaminated soils, root exudates
58
can increase microbial abundance (Kirk et al. 2005) and activity (Cébron et al. 2011). Several
59
studies showed that plants enhanced PAH dissipation by modifying microbial diversity
60
(Kawasaki et al. 2012) and activity (Yergeau et al. 2014; Peng et al. 2015), and selecting PAH
61
degraders (Storey et al. 2014; Siciliano et al. 2003) in the rhizosphere. Consequently, most
62
studies indicated that the combination of all these processes increased PAH degradation in the
63
presence of plants (Liste and Alexander 2000; Tejeda-Agredano et al. 2013) and more
precisely in the rhizosphere. However, other experiments also evidenced no effect (Gartler et 65
al. 2014), or slower PAH degradation in planted soil as compared to unplanted soil (Thomas 66
and Cébron 2016). These contrasting results could be explained by spatio-temporal variations
67
that occur within the rhizosphere and activate various processes during plant development.
68
This hypothesis justifies further research on the time course of PAH-degradation processes
69
and on the activity of the functional microbial community in soil-plant systems.
70
The temporal dynamics of rhizospheric processes could explain the variable efficiency of
71
PAH degradation observed with plants. In uncontaminated soil, it has been extensively shown
72
that the composition and quantity of root exudates can vary depending on the plant
73
developmental stage and on root location (Hinsinger et al. 2005; Walker et al. 2003), and can
74
thus modify the microbial community (Yang and Crowley 2000; Hannula et al. 2010; 75
Baudoin et al. 2002), functional diversity (Haichar et al. 2008), and microbial activity
76
(Baudoin et al. 2002). On the other hand, these rhizosphere processes have received little
77
attention in contaminated environments where pollution is an additional factor impacting
78
microorganism activity. It is therefore essential to assess the impact of both PAH pollution
79
and root development on overall microbial activity and on the PAH-biodegrading function to
80
know which factors are the most determining ones in a rhizoremediation context.
81
Among plant species tested for PAH rhizodegradation, the efficiency of legumes – e.g. alfalfa
82
- is relevant, because they have extensive root systems that allow soil colonization and
83
nutrient uptake (Muratova et al. 2003; D’Orazio et al. 2013). Alfalfa is a plant commonly
84
used in situ during land-farming treatment of organic pollutants (Trapp and Karlson 2001). It
85
is also commonly used in microcosm studies to evaluate rhizodegradation efficiency, and
86
more precisely study the processes involved (Bourceret et al. 2015). A legume such as alfalfa
87
is thus a good and realistic model plant to evaluate the time course of PAH rhizodegradation
88
in aged contaminated soil.
89
This study aimed to evaluate 1) the dynamics of PAH dissipation in alfalfa rhizosphere as
90
compared to unplanted soil, and 2) the variability of microbial community activity and
PAH-91
degrading bacterial abundance and activity over three weeks of plant growth. We developed a
92
specific 2-compartment rhizotron device to rapidly establish an active root system and put it
93
in contact with PAH spiked soil so as to avoid the time gap between root growth from seeds
94
germination and the degradation of bioavailable pollutants. Rhizotrons were filled with an
95
aged PAH-contaminated soil, initially spiked with a complex mixture of PAHs (i.e. a soil
organic extract). Rhizotrons were sampled once a week to monitor concentrations of PAHs
97
and potential metabolites (polar polycyclic aromatic compounds, pPAC). Dissolved organic
98
carbon (DOC), pH, and humidity were measured to characterize the rhizosphere and soil
99
conditions. Working on extracted DNA and RNA fractions, we also assessed total bacterial
100
and fungal abundance, PAH-degrading bacterial abundance and transcriptional activity levels.
101
Finally, we assessed active bacterial community structures by pyrosequencing of 16S rRNA
102
transcripts.
103
Materials and Methods 104
Experimental device 105
We used an aged PAH contaminated soil, from a former coking plant (Neuves-Maisons (NM),
106
Lorraine, France) to perform rhizotron experiments. Soil characteristics and spiking procedure
107
were described previously by Bourceret et al. (2015). Briefly, the NM soil (1033 ± 148 mg
108
per kg of dw soil of Σ13 PAHs (fluorene, phenanthrene, anthracene, fluoranthene, pyrene,
109
benzo(a)anthracene, chrysene, benzo(b)fluoranthene, benzo(k)fluoranthene, benzo(a)pyrene,
110
dibenzo(a,h)anthracene, benzo(g,h,i)perylene, indeno(1,2,3-cd)pyrene) was air-dried, sieved
111
at 2 mm and spiked with a complex organic pollutant extract (Table S1), rich in PAHs and
112
obtained from the same soil using chloroform extraction (Cébron et al. 2013). After solvent
113
evaporation, the spiked soil was mixed with NM soil not exposed to chloroform, in a
one-114
tenth ratio. Experimental device was divided in two parts (Fig. 1): the top part
(mini-115
rhizotron) was a poly-methyl methacrylate box (7 cm high x 29.8 cm long x 2.3 cm wide)
116
without bottom, that fits into the second part: a rhizotron (30 cm high x 30 cm long x 2.5 cm
117
wide) with a removable front face allowing spatially localized depth sampling as described by
118
Bourceret et al. (2015). First, 8 mini-rhizotrons were filled with NM soil, closed at the bottom
119
by bolting cloth (5 µm mesh), and adjusted to 80% of the soil water holding capacity (WHC)
120
(corresponding to 203 ml deionized water per kg of dw soil). Alfalfa (Medicago sativa var.
121
Europe) was planted on 4 of these devices by seeding 2.4 g of seeds (c.a. 26 seeds per cm2) 122
and the other 4 devices were left unplanted. After germination, the 8 devices were placed in a
123
plant growth chamber under controlled conditions (22°C/18°C day/night, 80% relative
124
humidity, c.a. 250 µmol photons m-2 s-1, 16 hours photoperiod) and were maintained at 80%
125
of the WHC by weighing the devices every two days. The previous growth of plant in NM
126
soil allowed to avoid the delay between time needed for root development and the PAH
127
degradation, that was already shown to be fast in spiked soil with a previous study (Bourceret 128
et al. 2015). After 15 days, when roots reached the bottom of the mini-rhizotron devices, eight
rhizotrons were filled with spiked NM soil (1418 ± 193 mg of Σ13 PAHs per kg of dw soil),
130
bolting cloths of the mini-rhizotrons were removed and devices were fitted in their
131
corresponding rhizotron to allow root penetration and growth in spiked soil. This time
132
corresponded to T0. Initial spiked NM soil was sampled: six aliquots from each of the eight
133
rhizotrons corresponding to 48 T0 samples were stored at -80°C for further analyses. Then the
134
4 planted and 4 unplanted devices were incubated in plant growth chamber in conditions
135
described above. After 6 (T1), 12 (T2), 16 (T3) and 22 (T4) days of plant growth, two
136
rhizotrons (one planted and one unplanted) were harvested and opened to allow core sampling
137
using a stainless steel cylinder equipped with a PTFE piston (1.6 cm diameter, 2.5 cm long,
138
thus enabling to collect soil cores of around 5 cm3). At 3 cm from the interface of the two 139
compartments, 6 samples with 3 cm between the core centers were collected per device (Fig.
140
1). Soil samples were prepared as previously described by Bourceret et al. (2015). Briefly,
141
after 3 rinsing by sterile water, roots were spread on a black paper and photographed to
142
estimate the size of each root fragment using ImageJ software (http://rsbweb.nih.gov/ij/).
143
Roots were then air-dried at 60°C and weighed to quantify dry root biomass. Rhizosphere
144
soil, collected from root rinsing water by centrifugation at 4400 rpm for 10 minutes, and bulk
145
soil were weighed to calculate the ratio between the two fractions and were mixed together to
146
obtain a unique soil sample stored at -80°C before analyses: soil characteristics (pH, DOC,
147
organic acids, and sugar concentrations), PAH and pPAC concentrations, and DNA/RNA
148
extractions. Soil humidity was measured by collecting 3 other samples on the side of the
149
rhizotrons and by weighing the soil before and after drying at 60°C for 48 hours.
150
Soil characteristics 151
Soil solutions were prepared with 1 g of soil in distilled water (1:5 w/v ratio), and pH was
152
measured using a pH-meter electrode (BioBlock scientific, pHM210 Radiometer analytical).
153
After centrifugation (10 min, 4000 rpm, 20°C) supernatant was filtered (0.45 µm) and diluted
154
20 times to quantify dissolved organic carbon (DOC) with a total organic carbon analyzer
155
(TOC-V CSH, Shimadzu). Sugars (inositol, trehalose, sucrose, glucose, fructose) and organic
156
acids (formate, butyrate, oxalate) were quantified from non-diluted extract with an
ion-157
exchange chromatograph ICS 5000 (CarboPac SA10 column, 40°C) and ICS 3000 (AS
11-158
HC column, 35°C), respectively.
159
Extraction and quantification of total PAHs, pPACs and bioavailable PAHs 160
An aqueous solution of hydroxypropyl-β-cyclodextrin (20 ml, 50 mM) (Acros organics, New
161
Jersey, USA) was used to extract available PAH fraction from 1 g of fresh soil from 5 NM
soil samples before spiking, 6 T0 samples, and 48 rhizotron samples (6 samples from both
163
planted and bare rhizotrons at each sampling time) in Oak Ridge Centrifuge tubes (FEP,
164
Nalgene, USA) (Reid et al. 2000). After stirring (100 rpm) for 16 hours at 24 °C and 2
165
centrifugation steps (10000 rpm, 20 min), dichloromethane was added (24 ml) to the aqueous
166
supernatant (c.a. 30 ml) to extract available PAHs. An Accelerated Solvent Extractor
167
(ASE350 Dionex ®) was used to extract total PAHs and pPACs with dichloromethane
168
(130°C, 100 bars) from 0.25 g of soil (stored at -80°C) from 12 NM soil samples before
169
spiking, 48 T0 samples, and 48 rhizotron samples previously lyophilized and crushed (<500
170
µm). Dichloromethane extracts were split in two fractions to quantify PAHs using
HPLC/UV-171
Fluo (High Pressure Liquid Chromatography) and pPACs using GC-MS (gas chromatography
172
coupled to mass spectrometry). Firstly, the two dichloromethane extracts containing available
173
and total PAHs were evaporated under nitrogen flow and diluted in 5 ml and 20 ml of
174
acetonitrile, respectively. HPLC (Dionex Ultimate 3000) system, with a 100-mm long and
175
4.6-mm internal diameter separation column (SupelcoAscendis Express C10), 2.6-mm
176
granulometry allowed quantifying PAHs from 10 µl of extract. From total and available
177
extracts, 13 PAHs (16 US-EPA PAHs excluding the three more volatile molecules:
178
naphtalene, acenaphtylene and acenaphtene) were quantified by using a UV (254 nm) and a
179
fluorescence detector, respectively. Secondly, from dichloromethane extracts pPACs were
180
quantified on a GC-6890 (Agilent Technologies) equipped with a DB5- MS column (60 ×
181
0.25 mm id × 0.25µm film thickness) coupled to a MS-5973 Inert (Agilent Technologies)
182
operating SIM mode (Single Ion Monitoring). The oven temperature program was as follows:
183
2 minutes at 70 °C, then from 70 °C to 130 °C at 15 °C min-1, then from 130 °C to 315 °C at 4
184
°C min-1 and then a 25 min hold at 315 °C. The carrier gas was helium at 1.4 ml min-1 185
constant flow. Fifteen pPACs including 11 oxygenated pPACs (O-PACs) and 4 nitrogenated
186
pPACs (heterocyclic PACs containing nitrogen N-PACs) were quantified by an internal
187
calibration using deuterated internal standards (the list of the 15 quantified polar PAC is given
188
in Hanser et al. (2015). During a sequence, calibration controls were injected every 12
189
samples to check the overall calibration.
190
DNA/RNA extraction 191
Nucleic acids were extracted from 0.5 g of soil using a FastDNA SPIN Kit for soil (MP
192
Biomedicals, France). DNA and RNA were co-extracted from the same aliquots of samples
193
stored at -80°C. DNA was resuspended in 100 µl of DES (Dnase-free water) and quantified at
194
480 nm (Xenius, SAFAS) by using Quant-iTPicoGreenasDNA Assay kit (Invitrogen), and
then extracts were diluted to 2 ng/µl before amplification. RNA was collected from the
196
filtrates at the DNA binding to the column step. After sodium acetate (0.1Vol, 3M, pH 5.2)
197
and isopropanol precipitation for one night at 4°C and centrifugation, RNA was resuspended
198
in 45 µl of Rnase-free water. Two steps of DNase (Thermo scientific) treatment (addition of
199
10 µl of DNase buffer (10X), 1 µl of DNase (1u/µl) and incubated 1 hour at 37°C) and
200
purification using RNeasyMinElute Cleanup kit (Qiagen) allowed obtaining 30 µl of pure
201
extract (presence of DNA contamination was PCR checked). After quantification at 480 nm
202
(Xenius, SAFAS) by Quant-iTRiboGreen RNA Assay kit (Invitrogen), extracts were
203
converted in cDNA using SuperScript III First-Strand kit (Invitrogen). Reverse transcription
204
reaction (20 µl) was performed using 1 µl of random hexamer (50 ng/µl), 1 µl of hybridization
205
buffer and 22.27 ng of RNA (5 min at 65°C and 1 min on ice), then 10 µl of reaction buffer
206
(2X) and 2 µl of enzyme mix were added and incubated 10 min at 25°C, 50 min at 50°C and 5
207
min at 85°C.
208
Real-time PCR quantification 209
The primer sets Fung5F/FF390R (Lueders et al. 2004; Thion et al. 2013), 968F/1401R (Felske 210
et al. 1998; Cébron et al. 2008) and PAH-RHDαGN F/R, PAH-RHDα GP F/R (Cébron et al. 211
2008), targeting the fungal 18SrRNA genes, the bacterial 16S rRNA genes, and the PAH-ring
212
hydroxylating dioxygenase genes from Gram-negative and Gram-positive bacteria,
213
respectively, were used to quantify by real-time PCR the abundance of active and total fungal,
214
bacterial and PAH-degrading bacterial populations. Amplification reactions were performed
215
on 20 µl of reaction mix containing 10 µl of iQ SYBR green SuperMix (Bio-Rad), 0.8 µl of
216
each primer (10 µM), 0.4 µl of 3% BSA (bovine serum albumin) solution, 0.2 µl of DMSO
217
(dimethyl sulfoxide), 0.08 µl of T4 bacteriophage gene 32 product (MP Biomedicals, France)
218
and 1 µl of diluted gDNA or pure cDNA. Amplification and quantification were achieved
219
using a CFX96 Real-Time PCR detection system (Bio-Rad) according to standard plasmid
220
dilution series and program described by Cébron et al. (2008) and Thion et al. (2012). After
221
soil humidity correction, data were expressed in number of gene copies per gram of dry
222
weight soil, in percentage of transcripts relative to gene copies, and in percentages of 18S
223
rRNAor PAH-dioxygenase relative to 16S rRNA gene or transcript copies.
224
Pyrosequencing and sequence analysis 225
The primer set 515F ((5'-GTG CCA GCM GCC GCG GTA A-3') / 907R (5'-CCG TCA ATT
226
CMT TTR AGT TT-3')) (Turner et al. 1999) was used to amplify the V4-V5 region of
227
bacterial 16S rDNA from gDNA and cDNA. Samples were identified with a MID (Multiplex
IDentifier, Roche). PCR reactions were achieved as described in Bourceret et al. (2016).
229
Beckman Coulter Genomics (Danvers, MA, USA) sequenced libraries using a 454/Roche
GS-230
FLX Titanium system. Data were deposited in the NCBI Sequence Read Archive (SRA)
231
under the BioProject ID: PRJNA324193. Denoised 16S rDNA sequenced were analysed in
232
QIIME 1.8.0 pipeline (Caporaso et al. 2010) as previously described by Bourceret et al. 233
(2017). Briefly, after filtering and reverse complement non-sense sequences, data from gDNA
234
and cDNA were gathered and clustered in Operational Taxonomic Units (OTUs) at 97% of
235
similarity and their representative sequences were affiliated at different taxonomic levels
236
(from phyla to genus) using RDP classifier (Wang et al. 2007) and the Greengenes 13_5
237
database (McDonald et al. 2012). Then subsampling was performed to the lowest number of
238
sequences counted in one of the samples (4,739 sequences per sample) and alpha-diversity
239
indexes (richness and diversity estimates) were calculated using QIIME 1.8.0 pipeline.
240
Statistical analyses 241
Statistical analyses were performed using XLStat 2013 software (Addinsoft). One-way
242
analysis of variance (ANOVA, with p<0.05) followed by a Newman-Keuls multiple
243
comparison test was performed to measure the time effect in each condition (planted and
244
unplanted) between 0 and 22 days. Two-way analysis of variance (ANOVA, with p<0.05)
245
followed by a Newman-Keuls multiple comparison tests were performed to measure the time
246
and plant effect between T1 and T4. Box plots were drawn using PAH data to compare their
247
distribution and variability. Significant differences in relative abundance of dominant OTUs
248
(≥1% in at least one sample) over time, were identified in cDNA samples with STAMP
249
version 2.0.8 (Parks and Beiko 2010) by a Tukey Kramer ANOVA, with a Benjamini
250
Hochberg correction of p value (q<0.05 and Effect size (ES) >0.26). Significant differences in
251
the ratio cDNA/gDNA OTU abundance, according to the presence of plant was studied by
252
Student-t test with a Benjamini Hochberg correction of p value with the differential
253
expression function in XLStatOmics package. Canonical correspondence analysis (CCA)
254
followed by a Monte Carlo permutation test (1000 permutations) was performed by using
255
XLStat-ADA 2015 software (Addinsoft) to study, considering both conditions (alfalfa and
256
unplanted soil) and 4 sampling times (0, 6, 12, 16 and 22 days), relationship between the
257
relative abundance of the 41 most abundant OTUs (≥1% in at least one sample) and
258
environmental variables (root biomass and length, pH, percentage of Gram-negative and
259
Gram-positive PAH dioxygenase transcripts and genes, sugars, organic acids, and PAH
260
content).
Results
262
Rhizosphere parameters 263
Humidity stayed constant (around 80% of the WRC) over time in both planted and unplanted
264
soil rhizotrons but was globally significantly higher in unplanted soil (78.36 ± 20.91 and
265
70.85 ± 9.98 %, in unplanted and alfalfa planted soil, respectively). In alfalfa rhizotron, root
266
biomass was significantly (p<0.05) higher after 22 days of plant development than after 6
267
days, whereas root length significantly increased over time and was significantly different
268
between 6 and 12 days and then between 16 and 22 days (Fig. 2A). Related to the plant
269
growth, several parameters, highlighting the effect of root exudation on soil properties,
270
increased over time. Globally sugar concentration and DOC increased significantly over time
271
in the planted compared to unplanted soil. Indeed sugar concentration was significantly higher
272
after 12 days in planted than in unplanted soil where no sugar was detected (Fig. 2B) and
273
DOC stayed constant over time in both rhizotrons until the 16th day, and then increased
274
significantly in planted soil on the 22nd day (Fig. 2C). At this time point, organic acids were
275
detected in alfalfa planted rhizotron (0.21 ± 0.13 mg.kg-1) but none in unplanted soil.
276
Surprisingly soil pH increased significantly over time in both conditions and was stable after
277
12 days. However it increased more rapidly in the planted than in the unplanted soil rhizotron
278
with a significant difference at 6 days (Fig. 2D).
279
PAHs and pPACs contents 280
The total aged PAH concentration (Σ13 PAHs) of the NM soil (1033 ± 148 mg.kg-1dw soil) 281
was significantly increased (p<0.05), i.e 27 %, after soil spiking with the organic pollutant
282
extract and reached 1418 ± 193 mg.kg.dw soil-1 at the beginning (T0) of the experiment (Fig. 283
3). The bioavailable PAH fraction was also increased by 41 % and reached 63.7 ± 18.0 mg.kg -284
1dw soil, while it represented 37.3 ± 15.6 mg.kg-1dw soil before spiking (data not shown). 285
Spiking increased the concentration in total and bioavailable fractions of most of the 13 PAH
286
compounds (Fig. S1). The total PAH concentration decreased significantly between 0 and 6
287
days and stayed constant until the 22nd day in both planted and unplanted rhizotrons (Fig. 3).
288
From the 6th days, the total PAH concentration dropped down to 1200 ± 210 and 1024 ± 190 289
mg.kg.dw soil-1 in unplanted and planted soil, respectively, corresponding to a decrease in 19
290
and 24% relative to the initial concentration, and to 70 and 100% of the spiked PAH fraction,
291
respectively. The concentration in total PAHs was significantly lower in alfalfa than in
292
unplanted soil when considering all times together (from 6 to 22 days, two-way ANOVA) and
293
was mostly explained by a significant difference after 12 days (Student t-test) of incubation
(Fig. 3). The concentrations of several compounds decreased significantly from the 6th day
295
(fluorene, phenanthrene, fluoranthene, pyrene, benzo(k)fluoranthene, benzo(a)pyrene and
296
benzo(g,h,i)perylene only in planted condition)whereas the concentration of other PAHs
297
remained constant over the time course (anthracene, benzo(a)anthracene, chrysene,
298
benzo(b)fluoranthene, dibenzo(a,h)anthracene, indeno(1,2,3-cd)pyrene)) or even increased
299
significantly (benzo(g,h,i)perylene) from the 22nd day, in presence of plant (Fig. S2).
300
Bioavailable PAH fraction decreased also significantly between T0 and the 6th day in both
301
conditions, reaching 0.05 ± 0.01 and 0.08 ± 0.03 mg.kg-1dw soil, corresponding to ca.100 %
302
decreases, for both planted and unplanted soil rhizotron. After one week, the bioavailable
303
PAH fraction was significantly lower than in the soil before spiking. Ten oxygenated and one
304
nitrogenous pPAC compounds were detected in initial soil (T0) and in both conditions after 6
305
days (Table 1). After 6 days the concentration of 4 oxygenated pPAC
(methylanthracene-306
9,10-dione, benzoanthracenedione, napthacene-5,12-dione) was significantly higher than at
307
T0, without significant differences between planted and unplanted soils. Benzo(cd)pyrenone
308
was only significantly higher at 6 days than at T0 in the planted rhizotron. The concentration
309
of the other pPAC stayed constant over the first week for both planted and unplanted soils.
310 311
Microbial communities 312
Abundance of active and total microbial communities
313
Bacterial abundance was higher than fungal, and bacteria were also more active over time in
314
both planted and unplanted soil (mean value of 7.84 x 10⁸ ± 6.64 x 10⁸ 16S rRNA gene copies
315
and 1.12 x 10¹⁰ ± 1.25 x 10¹⁰ transcript copies g dw soil-1) while fungi were 100 times less
316
represented (mean value of 9.94 x 10⁶ ± 7.04 x 10618S rRNA gene copies and 2.05 x 10⁸ ± 317
1.48 x 10⁸ transcript copies g dw soil-1) (Fig. 4A, B). Abundance of 16S rRNA genes tended
318
to increase over time in alfalfa and stayed constant in unplanted rhizotron whereas number of
319
16S rRNA transcripts increased significantly between T0 and the 6thday for both rhizotrons
320
and then stayed constant. Abundance of 16S rRNA genes and transcripts was significantly
321
higher in planted than unplanted rhizotron and plant effect was mainly detected at 12 (T2) and
322
22 days (T4). Abundance of 18S rRNA genes and transcripts tended to be constant in both
323
unplanted and planted rhizotrons and no plant effect was observed.
324
Abundance of Gram-negative PAH-dioxygenase genes and transcripts increased significantly
325
between T0 and the 6th day in both rhizotron types, and were higher in planted than in
326
unplanted soils, with a significant plant effect after 12 days (Fig. 4A and B). Abundance of
327
Gram-positive PAH-dioxygenase genes slightly increased over time whereas transcripts
largely increased between T0 and 6 days in both soil and further increased in planted soil till
329
12 days, resulting in a higher content in planted than in unplanted rhizotron, significant at
330
each sampling time. The level of PAH-dioxygenase gene transcription was expressed by the
331
ratio of the number of transcripts relative to corresponding gene copies (Fig. 4C). The level of
332
PAH-dioxygenase gene transcription was significantly higher in alfalfa than in unplanted soil
333
specifically after 12 days, and then decreased (for Gram-negative bacteria) and stayed
334
constant (for Gram-positive bacteria) over time without significant differences with unplanted
335
soil (Fig. 4C).
336 337
Richness, evenness and diversity of the active community
338
Globally, bacterial richness (Chao1) and diversity (Inverse of Simpson’s) indices were
339
significantly higher in unplanted than in alfalfa planted rhizotron (Table 2). This difference
340
was significant after 16 days for richness and 12 days for diversity index (Table 2). No
341
significant impact of plant was detected on the bacterial community evenness. For both
342
studied conditions, bacterial richness, diversity and evenness indices decreased significantly
343
during the 6 first days and after this time point increased significantly over time.
344
To explore the potential bacterial population involved into the rapid PAH degradation
345
appearing at the beginning of the incubation period, we looked for bacterial community
346
structure modification over time (Fig. 5). Among the active community, 12 phyla were
347
identified and their proportion changed over time. In both rhizotrons, Proteobacteria was the
348
more active phylum all over the incubation to the detriment of Chloroflexi, Actinobacteria
349
and Nitrospirae that represented a lower proportion of the active community along the time
350
course compared to the T0. Activity of Beta- and Gamma-Proteobacteria increased between 0
351
and 6 days and stayed constant or decreased until the end of incubation while the proportion
352
of active Alpha-subdivision members further increased. An opposite trend was observed for
353
the activity of Planctomycetes, Acidobacteria and Delta-Proteobacteria that was first
354
repressed between 0 and 12 days and then favored at the end of the incubation (Fig. 5). The
355
relative abundance of some active phyla evolved also differently over time according to the
356
presence of alfalfa. In alfalfa planted rhizotron, Bacteroidetes and TM6 were more and less
357
active over time, respectively, while the activity of Unclassified Proteobacteria was
358
transiently high and then low over the 22 days. In planted soil, 3 OTUs affiliated to
Beta-359
Proteobacteria (Thiobacillus, and Un.Oxalobacteraceae), 1 OTU affiliated to
Alpha-360
Proteobacteria (Mycoplana) and 1 OTU affiliated to Firmicutes (Bacillus selenatarsenatis)
361
were significantly more abundant among the active community after 6 days of incubation than
at all other times, contrary to the unplanted rhizotron where no OTU was favored after 6 days
363
(Fig. S3). After 12 days of incubation, three other OTUs belonging to Alpha- (Sphingobium), 364
Beta- (Janthinobacterium) and Gamma- (PYR10d3) Proteobacteria were favored in planted
365
soil. In unplanted rhizotron, 5 OTUs affiliated to Alpha- (Mycoplana, Phenylobacterium) and
366
Beta- (Thiobacillus, unclassified. Comamonadaceae) Proteobacteria were significantly more
367
abundant among the active community after 12 days of incubation.
368
Significant positive or negative impact of plants on shaping active bacterial community was
369
observed on 7 and 18 OTUs after 6 and 12 days of incubation, respectively (Fig. 6). After 6
370
days, the activity ratio between 16S rRNA and rDNA for 3 OTUs belonging to Gamma-
371
(Pseudomonadaceae), Beta-(Achromobacter) Proteobacteria and Firmicutes (Paenibacillus)
372
was significantly higher in alfalfa planted than in unplanted soil. Four other OTUs, affiliated
373
to Alpha- (Un. Sphingomonadaceae), Beta- (Un. Burkolderiales) Protebacteria and
374
Actinobacteria (Un. Micrococcaceae) were more actives in unplanted soil. After 12 days,
375
plant growth favored significantly the activity of 11 OTUs belonging to Alpha- (Devosia),
376
Beta- (Methylophilaceae), Gamma- (Pseudomonadaceae, Stenotrophomonas, Acinetobacter)
377
Proteobacteria, Bacteroidetes (Dyadobacter) and Actinobacteria (Un. Micrococcaceae). In
378
unplanted soil the activity of 6 OTUs affiliated to Alpha-Proteobacteria (Un.
379
Sphingomonadaceae, Sphingobium, Magnetospirillum) and Actinobacteria (Un.
380
Solirubrobacterales, Un. Geodermatophilaceae) was significantly higher than in alfalfa
381
planted soil. After 16 and 22 days of incubation, 56% and 76% of the OTUs whose activity is
382
significantly impacted by the presence of plant, were more active in alfalfa planted rhizotron
383 (Fig. S4). 384 385 Multivariate analysis 386
The two first axes of the canonical correspondence analysis (CCA) explained 62.5 % of
387
bacterial diversity variability among samples (Fig. 7A and B). The F1 axis (explaining 41.8%
388
of the variability) separates samples from the T0 (located on the right) to all other sampling
389
times. The F2 axis (explaining 20.8% of the variability) separates samples according to the
390
presence of plant and time, with 6to 22 day samples from the bottom to the top. Alfalfa
391
planted samples were separated from unplanted soil samples according to sugar and DOC
392
contents, root development (biomass and length), abundance of Gram-negative
PAH-393
dioxygenase genes and transcripts, and abundance of Gram-positive PAH-dioxygenase
394
transcripts (Fig. 7A). These parameters are correlated to the higher activity of 11 bacterial
395
OTUs, most belonging to Proteobacteria except one Bacteriodetes (Dyalobacter), in the
alfalfa planted rhizotron (Fig. 7B). These OTUs gathered bacteria affiliated to
397
Pseudomonadales (Acinetobacter and Pseudomonas), Sphingomonadales (Sphingobium),
398
Burkolderiales (Janthinobacterium and Achromobacter) and Rhizobiales (Un.
399
Methylobacteriaceae) orders. Unplanted soil samples were mostly discriminated according to
400
the higher PAH content (∑13 PAHs and 2-3, 4 and 5-6 cycles). According to the Pearson
401
correlation matrix (Table S2), pH and the root biomass and length were positively and
402
significantly correlated to the percentage of Gram-positive PAH-dioxygenase transcripts
403
contrary to the abundance of 18S transcripts, showing a negative correlation. Moreover
404
concentrations of 2-3, 4- rings and ∑13PAHs were significantly and negatively correlated to
405
the percentage of Gram-negative PAH-dioxygenase transcripts, shown as the most active
406
degrading community at the beginning of the monitoring.
407 408
Discussion
409
Rapid PAH dissipation in a spiked aged-contaminated soil 410
After 6 days of incubation 100 and 70% of the spiked PAH fraction was dissipated in the
411
planted and unplanted rhizotrons, respectively. A similar rapid dissipation, of bioavailable
412
PAHs after a few days was previously observed in simplified sand or soil microcosms spiked
413
with phenanthrene (Louvel et al. 2011; Cébron et al. 2011), but never observed with such a
414
complex PAH contaminant mixture. We evidenced the degradation of almost all spiked PAHs
415
including fluorene, phenanthrene, fluoranthene, pyrene, benzo(k)fluoranthene and
416
benzo(a)pyrene (which have from 2 to 5 aromatic cycles) in both conditions. In the same soil
417
(NM) incubated in bioslurry, 30 to 55% of the aged PAH compounds (fluorene, phenanthrene,
418
fluoranthene, pyrene, benzo(a)anthracene and chrysene) were degraded after 1.5 months of
419
incubation (Biache et al. 2017), indicating the presence of a very effective microbial
420
community for the degradation of a wide range of PAH compounds. Degradation of PAHs by
421
microbial consortia and co-metabolism are often described as playing crucial roles the in
422
degradation of PAH mixtures in the environment (Ghosal et al. 2016) because the presence of
423
low-molecular-weight PAHs could have a synergistic effect on the degradation of more
424
recalcitrant compounds (Van Herwijnen R et al. 2003; Roy et al. 2013). During the first 6
425
days of the experiment, spiked PAHs were probably the main available carbon sources in both
426
the planted and unplanted rhizotrons, as no increase in DOC or sugar content was observed in
427
either condition. As the microbial community of the aged-contaminated NM coking plant soil
428
was well adapted to PAH pollutants (Cébron et al. 2009; Bourceret et al. 2016), the bacterial
community was rapidly activated, and the spiked PAH fraction was in turn rapidly
430
biodegraded. The main parameter that limited the biodegradation of aged PAHs in this soil
431
was their low bioavailability (Cébron et al. 2013) andspiking transiently led to more easily
432
biodegradable PAHs. In our experiment, before being irreversibly adsorbed to soil mineral or
433
organic materials, such as clay, black carbon or coal-tar substances (Ghosal et al. 2016) ,
434
PAHs were rapidly degraded, proving that their availability is crucial for biodegradation.
435
Besides PAH degradation, oxygenated polar compounds (pPAC) were produced during the
436
first week of the experiment. This kind of bioavailable compounds, previously described in
437
water from industrial wasteland (Rollin et al. 2005; Lundstedt et al. 2006) and in coal tar
438
(Northcott and Jones 2001; Benhabib et al. 2010), could result from biotic PAH degradation.
439
Lundstedt et al. (2007) indeed described the production of oxygenated compounds during
440
microbial biodegradation, with apparent concentrations resulting from the balance between
441
pPAC degradation and pPAC production during PAH biodegradation (Biache et al. 2017).
442
The production of oxygenated pPAC possibly more available and more toxic than parent
443
molecules could contribute to shape the bacterial community structure.
444
Together with PAH biodegradation, we observed that bacterial community abundance and
445
activity rapidly increased during the first 6 days of incubation. Moreover the community
446
composition was drastically modified in both planted and unplanted conditions. Most of
447
bacterial OTUs with increasing activity were affiliated to Beta- and Gamma-Proteobacteria,
448
at the expense of Actinobacteria whose proportions fell sharply. PAH amendment may have
449
caused a shift of bacterial communities from oligotroph, K-strategist, Gram-positive bacteria
450
(such as Actinobacteria) to copiotroph, r-strategist, Gram-negative bacteria (such as
451
Proteobacteria) (Bevivino and Dalmastri 2017). These Proteobacteria are potentially
Gram-452
negative PAH-degraders. We did find a predominance of bacteria known to be involved in
453
PAH degradation, such as OTUs affiliated to the Achromobacter, Janthinobacterium,
454
Pyr10d3, Sphingobium, and Thiobacillus genera and Sphingomonadaceae, Microccocaceae,
455
and Comamonadaceae families (Fernández-Luqueño et al. 2011; Kunihiro et al. 2013). The
456
abundance and transcription level of PAH-dioxygenase genes increased significantly during
457
the first 6 days in both conditions, confirming the higher potential of PAH bacterial
458
degradation. Greater activity of Gram-negative than Gram-positive (Actinobacteria) PAH
459
degraders was evidenced during these early days, indicating that Proteobacteria were most
460
probably the main phylum involved in the biodegradation of the spiked PAHs. This finding
461
was also supported by a higher activity of Proteobacteria as compared to other taxa in both
462
planted and unplanted soils, and by a negative correlation between the activity of
negative PAH-degrading bacteria and PAH contents. Several studies indicated that PAH
464
contamination induces a selection of and an enrichment in PAH degraders (Cébron et al. 465
2008; Zhang et al. 2013; Sawulski et al. 2014), and also up-regulates the transcription of the
466
PAH-dioxygenase gene in pure culture (Kim et al. 2006) or complex communities (Louvel et 467
al. 2011). A negative correlation between the transcription of PAH-dioxygenase genes of
468
Gram-negative bacteria and PAH contents would confirm the major involvement of this
469
population in early pollutant degradation, although we cannot rule out the involvement of
470
Gram-positive Actinobacteria that could be the main active PAH-degraders after PAH spiking
471
(de Menezes et al. 2012). Furthermore, fungi could also be involved in PAH degradation
472
(Cerniglia and Sutherland 2010), but we did not detect any increase of fungal 18S rRNA gene
473
or transcript copies during incubation in either condition, suggesting a fairly limited
474
involvement of these microorganisms in our soil.
475 476
Plant effect 477
The presence of plants induced a shift in the active bacterial community structure and the
478
PAH-degrading population. The timescale of the experiment (22 days) allowed us to monitor
479
the root development of alfalfa, and compare processes between planted and unplanted soils.
480
In addition to increasing the PAH biodegradation capacity, alfalfa plants globally increased
481
the abundance and activity of bacteria, the abundance of Gram-negative PAH-degrading
482
bacteria and the expression of both Gram-negative and Gram-positive PAH-dioxygenase
483
genes. However, the presence of plants led to a decrease of the bacterial richness and diversity
484
indexes. This finding contrasts with previous observation from the same soil (NM) spiked
485
with phenanthrene and planted with ray-grass. The authors found that plants indeed induced
486
an increase of bacterial species richness and slightly inhibited phenanthrene degradation, even
487
if the abundance of PAH-dioxygenase genes increased, yet without modification of the
488
transcription level as compared to unplanted soil (Thomas and Cébron 2016). These
489
contrasting results can be explained by two different types of contamination, i.e. a PAH
490
mixture vs. phenanthrene, and two different plant species with contrasted root systems and
491
root exudation (Bourceret et al. 2015). Root exudates probably partly inhibit the degradation
492
of one sole PAH compound, while they might help in co-metabolism processes when PAH
493
contamination is complex and contains high-molecular-weight compounds (Rentz et al. 2005)
494
as shown for PCB degradation (Vrchotová et al. 2013).
495
After 6 days, even if root biomass and length were low, the presence of alfalfa had already
496
modified a few parameters. The pH, the abundance and proportion of active Gram-negative
PAH-degrading bacteria were significantly higher in the planted rhizotron than in the
498
unplanted one. Similar findings about PAH-degrading bacterial activity were reported in
499
batch experiments with sand spiked with phenanthrene (Louvel et al. 2011). After 6 days,
500
plants had already shaped the bacterial community structure: several OTUs belonging to Beta-
501
and Gamma-Proteobacteria were significantly more active in the planted rhizotron, while
502
other OTUs belonging to Alpha-, Beta-Proteobacteria and Actinobacteria were favoured in
503
the unplanted rhizotron. In our experiment, after 12 days, root length and sugar content were
504
significantly higher than after 6 days, and root biomass and DOC tended to increase,
505
suggesting a stronger rhizosphere effect. At this sampling time, significantly higher
PAH-506
degradation was observed in the planted rhizotron than in the unplanted one. This could be
507
linked to an increasing level of PAH-dioxygenase transcription in both Gram-negative and
508
Gram-positive PAH-degrading bacterial populations that was significantly higher in the
509
planted soil than in the unplanted one. Our results clearly show a positive and rapid impact of
510
the rhizosphere on the PAH degradation potential via the increased activity of a wider
511
diversity (both GN and GP) of PAH-degrading bacteria. Even if Actinobacteria were enriched
512
in the unplanted soil, the activity of the PAH degraders belonging to this phylum was favored
513
in the rhizosphere. The higher activity of Gram-positive PAH degraders could help in the
514
degradation of more recalcitrant PAH compounds (Kanaly and Harayama 2000). We
515
highlighted a time-dependent effect in the course of the process dynamics, which could
516
explain why some authors did not observe an increase in the activity of PAH-degrading
517
populations in certain rhizospheres (Kawasaki et al. 2015). The addition of artificial root
518
exudates can increase the density of soil PAH degraders, with an increase (Joner et al. 2002) 519
or no difference (Cébron et al. 2011) in the degradation of spiked PAHs. We showed the
520
activity of growing roots in a more natural rhizosphere system. A rhizotron device is probably
521
the most adapted laboratory system to study the dynamics of rhizosphere processes because it
522
makes it possible to perform analyses on precisely located samples with specific
523
characteristics (depth, root density, roots age…) instead of mean rhizosphere samples usually
524
obtained from pot experiments. Rhizotrons can allow studying the root turnover (Leigh et al. 525
2002), the isothiocyanate degradation rate, microbial communities (Rumberger and 526
Marschner 2003) or spatial heterogeneity of PAH degradation and microbial communities
527
(Bourceret et al. 2015).
528
In our study, the carbon released by actively growing roots and also leached from the top part
529
of the device presenting a higher root density may have activated PAH degradation through
530
co-metabolism (Ambrosoli et al. 2005). This phenomenon could also be attributed to a
priming effect, whereby the release of labile carbon stimulates microbial density and activity
532
(Haichar et al. 2014), promoting PAH degradation or biotransformation (Rentz et al. 2005).
533
As shown by the canonical analysis the higher differentiation between the planted and
534
unplanted conditions was observed after 6 and 12 days of incubation. Root growth seemed to
535
activate bacterial population mostly belonging to Proteobacteria, such as OTUs affiliated to
536
the Gamma- (Pseudomonadaceae, Stenotrophomonas and Acinetobacter), Alpha-
537
(Sphingobium, Devosia), and Beta-(Methylophilaceae, janthinobacterium and
538
Achromobacter) subdivisions. In addition to their ability to degrade PAHs (Fernández-539
Luqueño et al. 2011; Tauler et al. 2015; Gupta et al. 2015), OTUs affiliated to Proteobacteria
540
can be favoured in the presence of plants as compared to unplanted soil (Thomas and Cébron 541
2016; Thomas et al. 2016). On the contrary, in unplanted soil other members of the Alpha
542
(Sphingomonadaceae, Sphingobium, Sphingomonas, Mycoplana, Magnetospirillum) and Beta
543
(Ralstonia, Oxalobacteraceae, Comamonadaceae, Thiobacillus) subdivisions were favoured,
544
as well as Actinobacteria (Iamia, Geodermatophilaceae, Georgenia, and Micrococcaceae).
545
After 16 and 22 days of root development, when no further PAH dissipation was observed,
546
the transcriptional level of the PAH-dioxygenase gene from negative and
Gram-547
positive bacteria decreased or remained constant over time in both planted and unplanted
548
soils. At these time points, root development seemed to mainly influence the structure of the
549
bacterial community. The proportion of many OTUs indeed differed between the planted and
550
unplanted soils, but organic pollutant degradation no longer did.
551 552
Conclusion
553
Our results suggest that the dissipation of spiked PAHs is very fast in the soil when these
554
pollutants represent the main available carbon sources for microbial communities and
PAH-555
degrading bacteria are present. The presence of plants, which release root exudates, could
556
favour microbial degradation by co-metabolism and increase the PAH degradation yield. The
557
transcription of the PAH-dioxygenase gene was higher in the presence of plants than in
558
unplanted soil, and transcription from Gram-negative bacteria (Proteobacteria) was high
559
during the first 12 days when most of the PAHs were degraded. In the planted condition,
560
Gram-positive PAH-degrading bacteria (Actinobacteria) were also highly active, and
561
probably contributed to the higher level of PAH degradation in the rhizosphere. The
562
characterization of the bacterial community structure and activity over time indicated different
563
dynamics between the two conditions, with Beta- and Gamma-Proteobacteria mostly active
in planted soil while Alpha-Proteobacteria and Actinobacteria were more active in unplanted 565 soil. 566 567
Acknowledgments:
568This study was part of the RhizOrg project funded by the Agence Nationale de la Recherche
569
(ANR-13-JSV7-0007_01). The authors thank the GISFI (www.gisfi.fr) for soil providing,
570
David Billet, Geraldine Kitzinger and Gilles Bessaque for technical assistance. Carbohydrate
571
analyses were performed by Jacqueline Marchand belonging to the PTEF facility that is
572
supported by the French national Research Agency through the laboratory of Excellence
573 ARBRE (ANR-11-LABX-0002-01). 574 575 576
Figure captions
577Table 1. Nitrogenous and oxygenated pPAC concentration (mg.kg-1) over time (at T0 and 6
578
days) in planted (Alf) and unplanted (BS) soils (Means ± SD, n=6). Letters indicate
579
significant differences in pPAC concentrations between T0 and 6 days, and depending on
580
presence of plant (one-way ANOVA).
581
Table 2. Bacterial richness (Chao1) and diversity estimators (Inverse of Simpson’s index and 582
Evenness) in unplanted soil (BS) and soil planted with alfalfa (Alf) at the beginning (T0) and
583
after 6 , 12 , 16 and 22 days of incubation from cDNA data (Means ± SD, n=4). The plant
584
effect was tested (from 6 to 22 days) using a two-way analysis of variance (ANOVA)
585
followed by Newman-Keuls multiple comparison test (letters represents groups with
586
significant different values (p<0.05)). One-way ANOVA was used to test time effect (from
587
T0 to 22 days), separately for each condition.
588
Figure 1. Experimental devices and sampling points. (A) The device was composed of a 589
mini-rhizotron (in orange) fitting in a corresponding rhizotron (in black). According to the
590
sampling map (in white) at the depth 3 cm, six samples (in green) were collected, 3 samples
591
(in gray) were used for soil humidity measurements, and 4 supplemental samples collected
592
between green locations allowed quantification of dissolved organic carbon (DOC). (B)
593
Pictures of alfalfa rhizotron devices after 6 , 12 , 16 and 22 days of plant growth.
594 595
Figure 2. Soil and root colonization parameters over time. (A) Dry root biomass and length, 596
(B) sugar content, (C) dissolved organic carbon (DOC)and (D) pH after 6, 12 , 16 and 22
597
days in alfalfa planted (green) and unplanted (brown) soils. Means (n=6 for root biomass and
598
length, and n=4 for pH and DOC) and standard errors. Letters indicate significant (p<0.05)
599
combined effect of time and presence of plant evaluated by using two-way ANOVA followed
600
by Neuman-Keuls multiple comparison test.
601 602
Figure 3. PAH concentration (sum of 13 PAH, i.e. the 16 US-EPA PAHs, except 603
naphthalene, acenaphthylene and acenaphthene) after 6, 12, 16 and 22 days in planted (green)
604
and unplanted (brown) soils. Box plots show data variability and means (black cross), n=24
605
(for T0 samples) and n=6 (from 6 to 22 day samples). Dashed line indicate mean of PAH
606
concentration in the NM soil before spiking. Black asterisks indicate significant differences
607
between planted and unplanted soil (Student t test, p<0.05) and letters indicate significant
608
differences depending on time (one-way ANOVA).
609 610
Figure 4. Abundance values of genes (A) and transcripts (B) and ratio of transcripts relative 611
to their corresponding genes (C) for fungal 18S rRNA, bacterial 16S rRNA and
PAH-612
degrading bacterial communities after 6, 12, 16 and 22 days in alfalfa planted (green) and
613
unplanted (brown) soils. Values are means and standard deviations of 3 replicates (T0) and 6
614
replicates for 6 to 22 days. The effect of time was evaluated for each condition (planted,
615
unplanted) by using one-way ANOVA (p<0.05) and presence of plant was evaluated between
616
6 and 22 days by using two-way ANOVA (p<0.05) followed by Neuman Keuls multiple
617
comparison test. In A and B, different letters indicate significant changes in microbial
618
community abundance depending on time for each condition, black asterisks indicate plant
619
effect. In C, letters indicate cross effect of plant and time on the ratio of transcript relative to
620
gene copies.
621 622
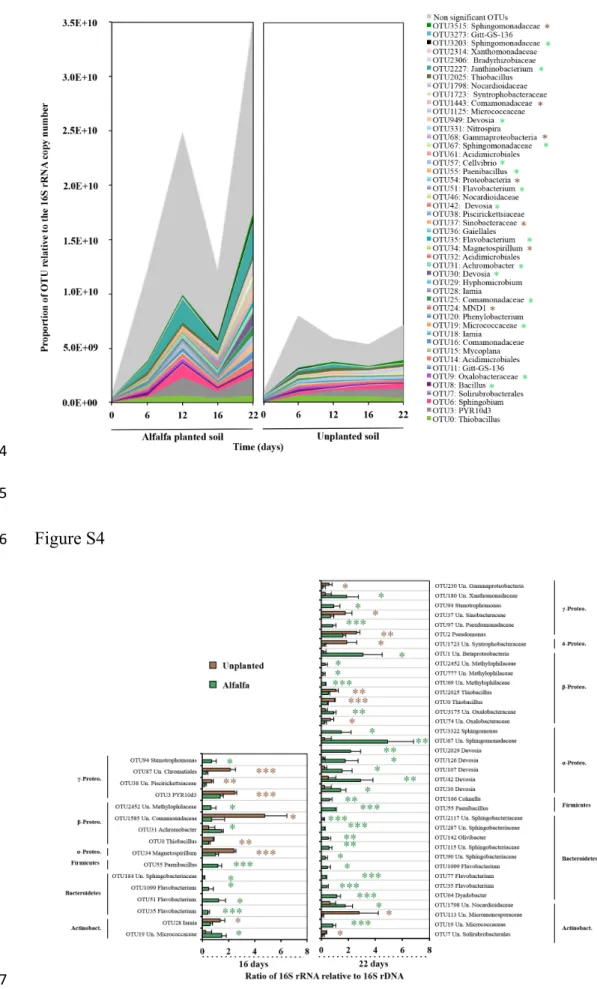
Figure 5. Relative proportion (mean, n=4) of dominant active bacterial phyla (≥1% in at least 623
one sample) in alfalfa planted (Alf) and unplanted soil (BS) at 0, 6, 12, 16 and 22 days of
624
incubation. The twelve significant phyla were identified by a Tukey Kramer ANOVA with a
625
Benjamini Hochberg correction of p-value (q<0.05, and effect size >0.26).
626
Figure 6. Ratio of the 16S rRNA relative to 16S rDNA for OTU (≥10 sequences in one 627
sample) significantly discriminating plant effect, after 6 and 12 days of incubation. Both
conditions were compared using Student t-tests with Benjamini-Hochberg correction of
p-629
value. Asterisks denote degree of significance (green and brown for higher ratio with alfalfa
630
and unplanted soils, respectively; * q<0.05; ** q<0.01; *** q<0.001). OTUs were affiliated at
631
97% of similarities to the deeper taxonomic level, leading to affiliations at different levels.
632
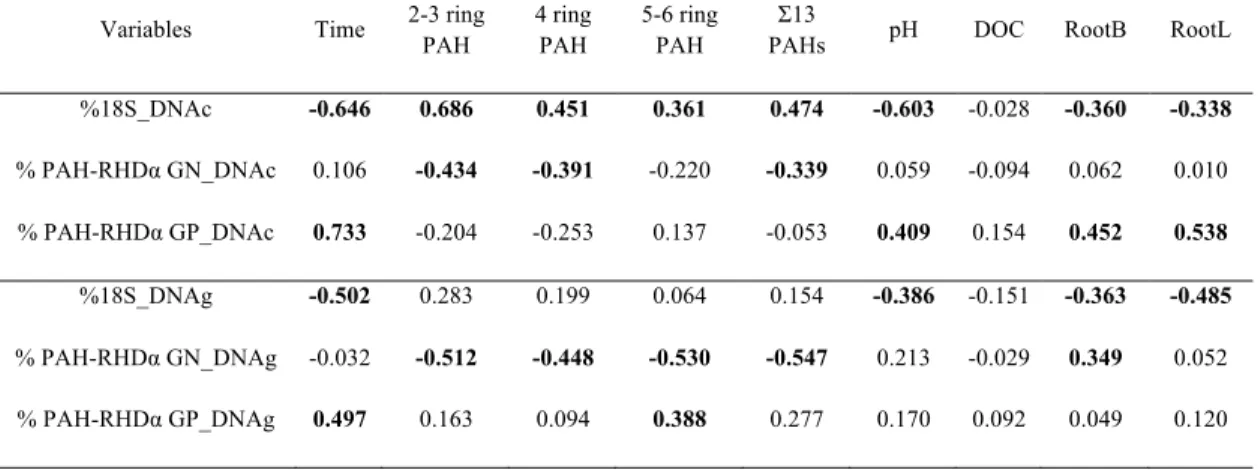
Figure 7. Canonical correspondence analysis (CCA) ordination including abiotique (A) and 633
(B) biotique variables. (A) environmental variables(in red) (DOC, sugar and organic acid
634
contents, pH, percentage of 18S rRNA, PAH-RHDα GN and GPgenes and transcripts relative 635
to 16S rRNA), root biomass (RootB) and length (RootL), sum of 13 PAH concentrations,
2-3-636
ring PAHs (fluorene, phenanthrene, anthracene), 4-ring PAHs (fluoranthene, pyrene,
637
benzo(a)anthracene, chryzene), 5-6-ring PAHs (benzo(b)fluoranthene, benzo(k)fluoranthene,
638
benzo(a)pyrene, dibenzo(a,h)anthracene, benzo(g,h,i)perylene, indeno(1,2,3-cd)pyrene), and
639
(B) the relative abundance of dominant active bacterial OTUs (≥1% in at least one sample,
640
taxonomic affiliation at 97% of similarities to the deeper taxonomic level, leading to
641
affiliations at different levels) (in black) were used to discriminate the 24 samples (4
642
replicates for each sampling time corresponding to 0, 6, 12, 16 and 22 days) collected for
643
alfalfa planted (green) and unplanted (brown) rhizotrons. A Monte Carlo permutation test
644
(1000 permutations) was performed and showed a significant (p<0.0001) effect of
645
environmental variables on the relative abundance of dominant OTUs. Un. Coma.: Un.
646
Comamonadaceae ; Un. Pseudo.: Un. Pseudomonadaceae ; Un.Sphingo.: Un.
647
Sphingomonadaceae ; Un. Geo.: Un. Geodermatophilaceae ; Un. Meth.:Un.
648
Methylobacteriaceae ; Phen.: Phenylobacterium ;Phaeos. Fulvum: PhaeospirillumFulvum ;
649
Un. Xantho.: Un. Xanthomonadaceae ; Un. Oxalo.: Un. Oxalobacteraceae.
650 651
Supplemental data
652
Table S1. PAH concentration (mg.L-1) in the organic extract used to spike NM soil. Values 653
are means (n=3) and standard errors.
654
Table S2. Pearson’s correlation matrix between soil properties and the percentage of PAH-655
dioxygenase transcripts and genes. Values in bold correspond to significant correlation
656
between variables (p<0.05).
657
658
Figure S1. Bioavailable (A) and total (B) PAH concentration in NM soil before (grey) and 659
after (blue) spiking. Black asteriks indicates significant differences between both conditions
(Student t test, p<0,05). Values are means and standard deviation of 12 and 48 samples (total
661
fraction) and 8 and 6 samples (bioavailable fraction), before and after spiking respectively.
662
Figure S2. Total PAH concentration of 13 individual compounds (the 16 US-EPA PAHs 663
except naphthalene, acenaphthylene and acenaphthene) after 6, 12, 16 and 22 days in alfalfa
664
planted (green) and unplanted (brown) soils. Values are means and standard deviations of 24
665
replicates (0 day) and 6 replicates from 6 to 22 days. The effect of time was evaluated for
666
each condition (planted, unplanted) independently by using one-way ANOVA (p<0.05) and
667
effect of presence of plant was evaluated between T1 and T4 by using two-way ANOVA
668
(p<0.05) followed by Neuman Keuls multiple comparison test. Different letters indicate
669
significant differences in PAH concentration depending on time for each condition, black
670
asterisks indicate plant effect.
671
Figure S3. Evolution over time of the relative proportion of dominant OTUs (≥1% in at least 672
one sample), in alfalfa planted and unplanted soil, reported to the transcript 16S rRNA copy
673
number based on cDNA analysis. Forty-seven significant OTUs were identified by a Tukey
674
Kramer ANOVA with a Benjamini Hochberg correction of p-value (q<0.05, and effect size
675
>0.26) and non-significant OTUs correspond to population presenting constant relative
676
proportion over time. Asterisks denote OTUs with significant differences in relative
677
abundance over time specifically in planted (green) or in unplanted soil (brown). OTUs were
678
affiliated at the most precise level.
679
Figure S4. Ratio of the 16S rRNA relative to 16S rDNA for OTU (with at least 10 sequences 680
in one sample) significantly discriminating plant effect, after 16 and 22 days of incubation.
681
Both conditions were compared using Student t-tests with Benjamini-Hochberg correction of
682
p-value. Asterisks denote degree of significance (green and brown for higher ratio with alfalfa
683
planted and unplanted soils, respectively; * q<0.05; ** q<0.01; *** q<0.001).
684 685 686
References
687
Allard A-S, Remberger M, Neilson AH (2000) The negative impact of aging on the loss of
688
PAH components in a creosote-contaminated soil. Int Biodeterior Biodegradation 46:43–
689
49 . doi: 10.1016/S0964-8305(00)00050-0