Figure S1
2
3
4
Figure S1: “Al-normalized” chemical profiles of major elements Si, Mg, and Fe in block BM-B-41-1
5
(long profile, ~220 mm) and block BM-B-41-2 (short profile, ~40 mm) from section 62. Horizontal lines
6
and gray areas represent same data as in Figure 4 (i.e. reference and bulk values).
d
2
Figure S2
8
9
Figure S2: Diffractograms of the various colored aggregates isolated from FEBEX raw bentonite and
10
the bulk raw material.
Figure S3
12
13
Figure S3: Colored corrosion halos observed around various steel components retrieved upon
14
dismantling of the FEBEX experiment.
d
4
Figure S4
16
17
18
Figure S4: 300 K Mössbauer spectra of the raw FEBEX material and of 11 samples from block
BM-B-41-19
1. The refined values of the hyperfine parameters are listed in Table S3 and Table S4.
Supplementary tables
21
Table S1 and S2
22
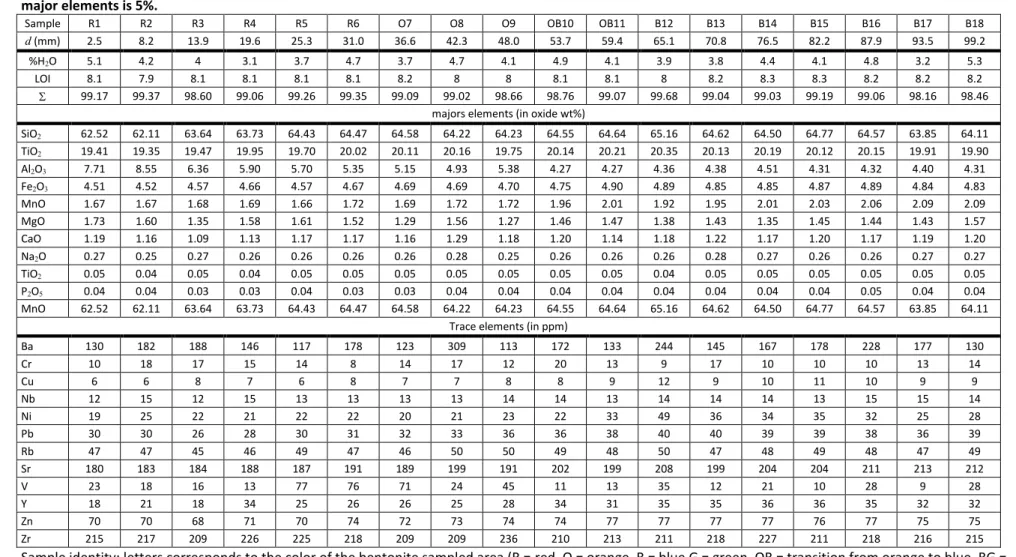
Table S1: Chemical composition of eighteen powdered FEBEX samples from block BM-B-41-1 determined by XRF (and ATG). Relative uncertainty on
24
major elements is 5%.
25
Sample R1 R2 R3 R4 R5 R6 O7 O8 O9 OB10 OB11 B12 B13 B14 B15 B16 B17 B18
d (mm) 2.5 8.2 13.9 19.6 25.3 31.0 36.6 42.3 48.0 53.7 59.4 65.1 70.8 76.5 82.2 87.9 93.5 99.2
%H2O 5.1 4.2 4 3.1 3.7 4.7 3.7 4.7 4.1 4.9 4.1 3.9 3.8 4.4 4.1 4.8 3.2 5.3
LOI 8.1 7.9 8.1 8.1 8.1 8.1 8.2 8 8 8.1 8.1 8 8.2 8.3 8.3 8.2 8.2 8.2
99.17 99.37 98.60 99.06 99.26 99.35 99.09 99.02 98.66 98.76 99.07 99.68 99.04 99.03 99.19 99.06 98.16 98.46
majors elements (in oxide wt%)
SiO2 62.52 62.11 63.64 63.73 64.43 64.47 64.58 64.22 64.23 64.55 64.64 65.16 64.62 64.50 64.77 64.57 63.85 64.11 TiO2 19.41 19.35 19.47 19.95 19.70 20.02 20.11 20.16 19.75 20.14 20.21 20.35 20.13 20.19 20.12 20.15 19.91 19.90 Al2O3 7.71 8.55 6.36 5.90 5.70 5.35 5.15 4.93 5.38 4.27 4.27 4.36 4.38 4.51 4.31 4.32 4.40 4.31 Fe2O3 4.51 4.52 4.57 4.66 4.57 4.67 4.69 4.69 4.70 4.75 4.90 4.89 4.85 4.85 4.87 4.89 4.84 4.83 MnO 1.67 1.67 1.68 1.69 1.66 1.72 1.69 1.72 1.72 1.96 2.01 1.92 1.95 2.01 2.03 2.06 2.09 2.09 MgO 1.73 1.60 1.35 1.58 1.61 1.52 1.29 1.56 1.27 1.46 1.47 1.38 1.43 1.35 1.45 1.44 1.43 1.57 CaO 1.19 1.16 1.09 1.13 1.17 1.17 1.16 1.29 1.18 1.20 1.14 1.18 1.22 1.17 1.20 1.17 1.19 1.20 Na2O 0.27 0.25 0.27 0.26 0.26 0.26 0.26 0.28 0.25 0.26 0.26 0.26 0.28 0.27 0.26 0.26 0.27 0.27 TiO2 0.05 0.04 0.05 0.04 0.05 0.05 0.05 0.05 0.05 0.05 0.05 0.04 0.05 0.05 0.05 0.05 0.05 0.05 P2O5 0.04 0.04 0.03 0.03 0.04 0.03 0.03 0.04 0.04 0.04 0.04 0.04 0.04 0.04 0.04 0.05 0.04 0.04 MnO 62.52 62.11 63.64 63.73 64.43 64.47 64.58 64.22 64.23 64.55 64.64 65.16 64.62 64.50 64.77 64.57 63.85 64.11
Trace elements (in ppm)
Ba 130 182 188 146 117 178 123 309 113 172 133 244 145 167 178 228 177 130 Cr 10 18 17 15 14 8 14 17 12 20 13 9 17 10 10 10 13 14 Cu 6 6 8 7 6 8 7 7 8 8 9 12 9 10 11 10 9 9 Nb 12 15 12 15 13 13 13 13 14 14 13 14 14 14 13 15 15 14 Ni 19 25 22 21 22 22 20 21 23 22 33 49 36 34 35 32 25 28 Pb 30 30 26 28 30 31 32 33 36 36 38 40 40 39 39 38 36 39 Rb 47 47 45 46 49 47 46 50 50 49 48 50 47 48 49 48 47 49 Sr 180 183 184 188 187 191 189 199 191 202 199 208 199 204 204 211 213 212 V 23 18 16 13 77 76 71 24 45 11 13 35 12 21 10 28 9 28 Y 18 21 18 34 25 26 26 25 28 34 31 35 35 36 36 35 32 32 Zn 70 70 68 71 70 74 72 73 74 74 77 77 77 77 76 77 75 75 Zr 215 217 209 226 225 218 209 209 236 210 213 211 218 227 211 218 216 215
Sample identity: letters corresponds to the color of the bentonite sampled area (R = red, O = orange, B = blue G = green, OB = transition from orange to blue, BG =
26
transition from blue to green, out = outer layer of the block), and number to the order of sampling, (starting from the from the interface)
27
d: approximate distance between the sampled layer and the interface
28
LOI: Loss On Ignition
%H2O: water content measured at 105°C
30
: sum of elements (excludes LOI and %H2O)
31
8
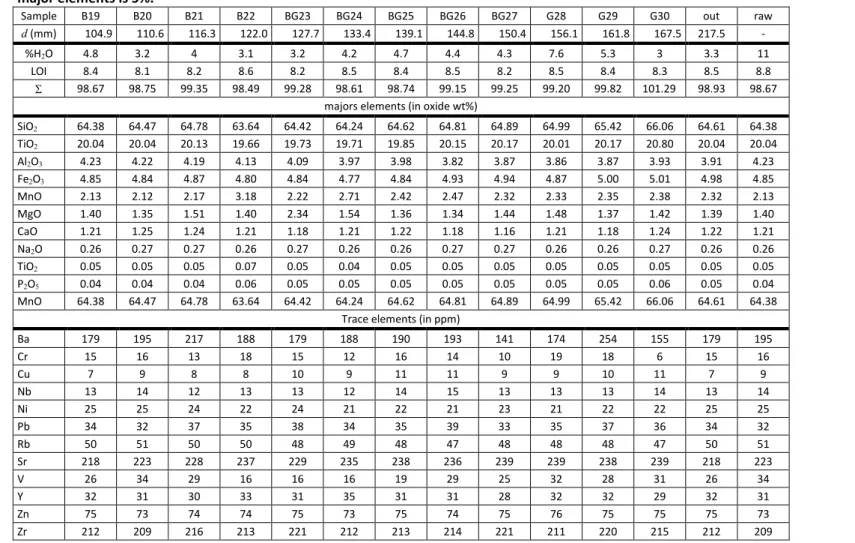
Table S2: Chemical composition of fourteen powdered FEBEX samples determined by XRF (and ATG), including the raw material. Relative uncertainty on
32
major elements is 5%.
33
Sample B19 B20 B21 B22 BG23 BG24 BG25 BG26 BG27 G28 G29 G30 out raw
d (mm) 104.9 110.6 116.3 122.0 127.7 133.4 139.1 144.8 150.4 156.1 161.8 167.5 217.5 -
%H2O 4.8 3.2 4 3.1 3.2 4.2 4.7 4.4 4.3 7.6 5.3 3 3.3 11
LOI 8.4 8.1 8.2 8.6 8.2 8.5 8.4 8.5 8.2 8.5 8.4 8.3 8.5 8.8
98.67 98.75 99.35 98.49 99.28 98.61 98.74 99.15 99.25 99.20 99.82 101.29 98.93 98.67
majors elements (in oxide wt%)
SiO2 64.38 64.47 64.78 63.64 64.42 64.24 64.62 64.81 64.89 64.99 65.42 66.06 64.61 64.38 TiO2 20.04 20.04 20.13 19.66 19.73 19.71 19.85 20.15 20.17 20.01 20.17 20.80 20.04 20.04 Al2O3 4.23 4.22 4.19 4.13 4.09 3.97 3.98 3.82 3.87 3.86 3.87 3.93 3.91 4.23 Fe2O3 4.85 4.84 4.87 4.80 4.84 4.77 4.84 4.93 4.94 4.87 5.00 5.01 4.98 4.85 MnO 2.13 2.12 2.17 3.18 2.22 2.71 2.42 2.47 2.32 2.33 2.35 2.38 2.32 2.13 MgO 1.40 1.35 1.51 1.40 2.34 1.54 1.36 1.34 1.44 1.48 1.37 1.42 1.39 1.40 CaO 1.21 1.25 1.24 1.21 1.18 1.21 1.22 1.18 1.16 1.21 1.18 1.24 1.22 1.21 Na2O 0.26 0.27 0.27 0.26 0.27 0.26 0.26 0.27 0.27 0.26 0.26 0.27 0.26 0.26 TiO2 0.05 0.05 0.05 0.07 0.05 0.04 0.05 0.05 0.05 0.05 0.05 0.05 0.05 0.05 P2O5 0.04 0.04 0.04 0.06 0.05 0.05 0.05 0.05 0.05 0.05 0.05 0.06 0.05 0.04 MnO 64.38 64.47 64.78 63.64 64.42 64.24 64.62 64.81 64.89 64.99 65.42 66.06 64.61 64.38
Trace elements (in ppm)
Ba 179 195 217 188 179 188 190 193 141 174 254 155 179 195 Cr 15 16 13 18 15 12 16 14 10 19 18 6 15 16 Cu 7 9 8 8 10 9 11 11 9 9 10 11 7 9 Nb 13 14 12 13 13 12 14 15 13 13 13 14 13 14 Ni 25 25 24 22 24 21 22 21 23 21 22 22 25 25 Pb 34 32 37 35 38 34 35 39 33 35 37 36 34 32 Rb 50 51 50 50 48 49 48 47 48 48 48 47 50 51 Sr 218 223 228 237 229 235 238 236 239 239 238 239 218 223 V 26 34 29 16 16 16 19 29 25 32 28 31 26 34 Y 32 31 30 33 31 35 31 31 28 32 32 29 32 31 Zn 75 73 74 74 75 73 75 74 75 76 75 75 75 73 Zr 212 209 216 213 221 212 213 214 221 211 220 215 212 209
Sample identity: letters corresponds to the color of the bentonite sampled area (R = red, O = orange, B = blue G = green, OB = transition from orange to blue, BG =
34
transition from blue to green, out = outer layer of the block), and number to the order of sampling, (starting from the from the interface)
35
d: average distance between the sampled layer and the interface
36
LOI: Loss On Ignition
%H2O: water content measured at 105°C
38
: sum of elements (excludes LOI and %H2O)
39
10
10
Table S3 and S4
40
Table S3: refined values of Mössbauer parameters and doublet structural attributions for the raw FEBEX
41
material and fives samples collected in block BM-B-41-1 (spectra shown in Figure 9 and S4). Uncertainties
42
are 0.02 mm∙s-1 for I.S., Q.S., 2ε, and F.W.H.M.; 0.5 T for B
hf, and 2% for the area.
43
300K 77K Hyperfine parameters Attribution Hyperfine parameters Attribution I.S. F.W. H.M. Q.S. /2ε Bhf Area (%) I.S. F.W. H.M. Q.S. /2ε Bhf Area (%) raw 1.20 0.50 2.35 4 para-Fe(II) 1.35 0.50 2.54 5 para-Fe(II) 0.35 0.67 0.54 83 para-Fe(III) 0.46 0.71 0.56 75 para-Fe(III) 0.45 0.90 -0.20 28.8 13 goethite 0.47 1.07 -0.25 48.6 11 goethite 0.53 0.69 0.06 55.0 9 hematite out (220 mm) 1.26 0.56 2.37 3 para-Fe(II) 1.26 0.5 2.76 5 para-Fe(II) 0.34 2.00 0.55 46 para-Fe(III) 0.46 1.50 0.21 33 para-Fe(III) 0.34 0.62 0.58 51 para-Fe(III) 0.46 0.56 0.59 51 para-Fe(III) 0.49 0.44 -0.23 48.9 7 goethite 0.45 0.44 0.12 54.5 4 hematite G30 (168 mm) 1.26 0.56 2.37 8 para-Fe(II) 1.29 0.72 2.71 9 para-Fe(II) 0.34 0.67 0.55 80 para-Fe(III) 0.46 0.73 0.57 81 para-Fe(III) 0.32 0.70 -0.20 34.2 7 goethite 0.47 0.46 -0.20 48.9 4 goethite 0.34 0.56 -0.20 47.7 5 hematite 0.44 0.46 0.00 53.7 6 hematite BG25 (139 mm) 1.27 0.4 2.85 4 para-Fe(II) 0.55 0.72 0.00 20 para-Fe(III) 0.47 0.62 0.58 62 para-Fe(III) 0.55 0.67 -0.4 48.6 4 goethite 0.55 1.10 0.06 55.2 10 hematite B20 (111 mm) 1.32 0.50 2.27 14 para-Fe(II) 1.26 0.60 2.92 15 para-Fe(II) 0.32 0.62 0.59 86 para-Fe(III) 0.46 0.64 0.56 75 para-Fe(III) 0.47 0.46 -0.23 49.8 6 goethite 0.57 0.46 0.25 55.6 4 hematite B15 (82 mm) 1.17 0.67 2.57 16 para-Fe(II) 1.28 0.66 2.88 16 para-Fe(II) 0.34 0.62 0.53 84 para-Fe(III) 0.47 0.66 0.56 74 para-Fe(III) 0.53 0.70 -0.20 48.0 4 goethite 0.41 0.56 0.22 53.5 6 hematite I.S. = Isomer shift value relative to that of the α-Fe at 300 K. (mm∙s-1)44
F.W.H.M. = Full width of line at half of its maximum intensity. (mm∙s-1)
45
Q.S./2ε = Quadrupolar splitting/quadrupolar shift
46
Bhf = Magnetic hyperfine field (T)
47
11
Table S4: refined values of Mössbauer parameters and doublet structural attributions for six samples
48
collected in block BM-B-41-1 (spectra shown in Figures 9 and S4). Uncertainties are 0.02 mm∙s-1 for I.S., Q.S.,
49
2ε, and F.W.H.M.; 0.5 T for Bhf, and 2% for the area.
50
300K 77K Hyperfine parameters Attribution Hyperfine parameters Attribution I.S. F.W. H.M. Q.S. /2ε Bhf Area (%) I.S. F.W. H.M. Q.S. /2ε Bhf Area (%) OB11 (59 mm) 1.10 0.44 2.89 6 para-Fe(II) 1.20 0.50 3.05 6 para-Fe(II) 0.36 0.73 0.57 94 para-Fe(III) 0.45 0.65 0.58 81 para-Fe(III) 0.40 0.50 -0.21 42.7 3 goethite 0.44 0.50 -0.26 49.3 4 goethite 0.34 0.50 -0.05 54.0 6 hematite O9 (48 mm) 0.37 2.00 0.00 33 para-Fe(III) 1.26 0.36 2.80 4 para-Fe(II) 0.35 0.52 0.52 57 para-Fe(III) 0.46 0.32 0.57 71 para-Fe(III) 1.16 0.36 2.51 3 para-Fe(II) 0.50 0.71 -0.23 45.0 4 goethite 0.54 0.44 -0.21 47.6 4 goethite 0.50 0.51 -0.23 49.5 17 goethite 0.51 0.44 -0.20 50.8 3 hematite 0.46 0.50 -0.04 55.0 4 hematite O7 (37 mm) 1.26 0.40 2.81 3 para-Fe(II) 0.31 3.00 0.00 19 para-Fe(III) 0.47 0.64 0.58 69 para-Fe(III) 0.31 1.20 0.00 81 para-Fe(III) 0.49 0.47 -0.22 49.2 12 goethite 0.49 0.47 -0.22 46.0 4 goethite 0.47 0.49 -0.15 52.8 12 hematite R4 (20 mm) 1.25 0.50 2.32 2 para-Fe(II) 1.32 0.50 2.76 4 para-Fe(II) 0.34 0.66 0.56 53 para-Fe(III) 0.47 0.70 0.54 55 para-Fe(III) <0.43> <-0.25> <31.6> 31 goethite 0.48 0.65 -0.23 49.1 29 goethite 0.38 0.59 -0.20 49.3 14 hematite 0.51 0.49 -0.11 52.9 12 hematite R1 (3 mm) 1.45 0.40 2.55 2 para-Fe(II) 0.47 0.71 0.59 43 para-Fe(III) 0.49 0.52 -0.24 49.3 48 goethite 0.47 0.37 -0.11 53.0 7 hematitecrust (first few hundreds of µm)
1.17 0.50 2.57 5 para-Fe(II) 1.24 0.71 2.74 8 para-Fe(II) 0.36 0.58 0.63 41 para-Fe(III) 0.46 0.56 0.63 37 para-Fe(III) 0.44 0.89 -0.20 49.1 9 goethite 0.50 0.42 -0.22 49.8 37 goethite <0.46> <-0.30> <30.2> 45 goethite 0.50 0.64 -0.23 48.1 18 goethite
I.S. = Isomer shift value relative to that of the α-Fe at 300 K. (mm∙s-1)
51
F.W.H.M = Full width of line at half of its maximum intensity. (mm∙s-1)
52
Q.S./2ε = Quadrupolar splitting/quadrupolar shift
53
Bhf = Magnetic hyperfine field (T)
54
a. the shape of this spectra accounts for the presence of very fast relaxation phenomena.
12
12
Figure S1: “Al-normalized” chemical profiles of major elements Si, Mg, and Fe in block BM-B-41-1
56
(long profile, ~220 mm) and block BM-B-41-2 (short profile, ~40 mm) from section 62. Horizontal
57
lines and grey areas represent same data as in Figure 4 (i.e. reference and bulk values).
58
Figure S2: Diffractograms of the various colored aggregates isolated from FEBEX raw bentonite and
59
the bulk raw material.
60
Figure S3: Colored corrosion halos observed around various steel components retrieved upon
61
dismantling of the FEBEX experiment.
62
Figure S4: 300 K Mössbauer spectra of the raw FEBEX material and of 11 samples from block
BM-B-63
41-1. The refined values of the hyperfine parameters are listed in Table S3 and Table S4.
64
13
Table S1:
Chemical composition of eighteen powdered FEBEX samples from block BM-B-41-1
66
determined by XRF (and ATG). Relative uncertainty on major elements is 5%.
67
Table S2:
Chemical composition of fourteen powdered FEBEX samples determined by XRF
68
(and ATG), including the raw material. Relative uncertainty on major elements is 5%.
69
Table S3: refined values of Mössbauer parameters and doublet structural attributions for the raw
70
FEBEX material and fives samples collected in block BM-B-41-1 (spectra shown in Figure 9 and S4).
71
Uncertainties are 0.02 mm∙s
-1for I.S., Q.S., 2ε, and F.W.H.M.; 0.5 T for B
hf