ORIGINAL ARTICLE
Interrelation of ST-segment depression during bicycle
ergometry and extent of myocardial ischaemia
by myocardial perfusion SPECT
Stefano Muzzarelli&Matthias Emil Pfisterer&Jan Müller-Brand&Michael Johannes Zellweger
Received: 17 February 2009 / Accepted: 1 May 2009 / Published online: 27 May 2009 # Springer-Verlag 2009
Abstract
Purpose The aim of this study was to compare ST-segment depression (STD) during bicycle ergometry and extent of myocardial ischaemia assessed by myocardial perfusion SPECT (MPS) in a large patient cohort.
Methods Consecutive patients (n=955) referred for MPS with bicycle ergometry and interpretable stress ECG were evaluated with respect to ECG and MPS findings of ischaemia. The maximal STD was recorded and exercise ECG was considered ischaemic if STD was horizontal or downsloping (≥1 mm). MPS was interpreted using a 20-segment model with a scale of 0 to 4. A summed stress (SSS), summed rest (SRS) and summed difference score (SDS=SSS−SRS, e.g. extent of ischaemia) were derived. Ischaemia was defined as an SDS≥2.
Results An exercise-induced STD was present in 215 patients (22%) and myocardial ischaemia on MPS was present in 366 patients (38%). The extent of ST-segment depression and the number of ECG leads with significant STD were each strongly and significantly associated with increasing severity of ischaemia and the number of coronary territories involved (p<0.01 for all correlations). Conclusion These data demonstrate a strong correlation between the extent of STD, number of ischaemic leads and severity of myocardial ischaemia as assessed by MPS during bicycle ergometry.
Keywords Coronary artery disease . Myocardial ischaemia . Exercise ECG testing . ST-segment depression .
Myocardial perfusion SPECT
Introduction
Exercise stress testing and myocardial perfusion SPECT (MPS) are widely used for diagnostic and prognostic assessment of patients with known or suspected coronary artery disease (CAD) [1]. The diagnostic accuracy and the prognostic value of both diagnostic modalities are well defined. The severity of ischaemia assessed by MPS and the extent of ST-segment depression (STD) during exercise ergometry are validated outcome predictors in patients with CAD [2–4]. Based on this assumption and bearing in mind that STD is a sign of myocardial ischaemia, the extent of STD may be directly related to the severity of myocardial ischaemia. Previous studies which addressed this issue showed conflicting results [5–9]. Furthermore, as exercise was performed on a treadmill, there are no comparative data for exercise testing by bicycle ergometry. The aim of the present study therefore was to assess the interrelation between STD extent on bicycle ergometry and the severity of myocardial ischaemia as assessed by MPS in a large patient cohort.
Methods
Patient population
Consecutive patients (n=1,132) referred for MPS with exercise stress (bicycle ergometry) at the University Hospital of Basel were analysed with respect to ECG and S. Muzzarelli
:
M. E. Pfisterer:
M. J. Zellweger (*)Cardiology Department, University Hospital Basel, Petersgraben 4,
4031 Basel, Switzerland e-mail: [email protected] J. Müller-Brand
Nuclear Medicine Department, University Hospital Basel, Petersgraben 4,
MPS findings of ischaemia. Patients with ST-segment depression ≥ 1 mm or left bundle branch block on their baseline ECG were excluded (n=177). Detailed medical history was available in all patients. Whenever possible, beta-blocking medications as well as negative chronotropic calcium antagonists were withheld for 48 h and long-acting nitrates for 24 h before exercise testing.
Exercise testing
Resting heart rate, blood pressure and 12-lead ECG were recorded before exercise. A standardized, stepwise and symptom-limited bicycle exercise test was per-formed in all subjects to the end points as defined in the exercise testing guidelines [10]. A 12-lead ECG was continuously recorded during exercise and recovery. Blood pressure was recorded every minute during exercise and recovery. ST-segment deviation was assessed auto-matically (CARDIOVIT CS-200®, Schiller, Baar, Switzer-land) and visually controlled and interpreted by an experienced cardiologist, who was blinded for the MPS results. Maximum STD (in mm, 1 mm = 0.1 mV) was defined as the maximal exercise-induced ST-segment depression 80 ms after the J point, which was horizontal or downsloping; it was calculated by subtracting the maximum ST-segment depression during exercise or post exercise from the resting ST-segment level in the corresponding lead. Maximum STD was considered ischaemic if≥ 1 mm and subsequently further categorized with a 0.5-mm scale. In addition, the severity of STD was subdivided in three categories: no significant STD (no STD or STD < 1 mm), STD = 1 mm and STD > 1 mm. Myocardial perfusion imaging
All patients underwent a routine rest/stress (ergometry) dual isotope (201Tl rest/99mTc-sestamibi) MPS protocol as previously described [11,12]. Rest MPS was obtained after administration of 111 MBq 201Tl. 201Tl SPECT was performed 10 min after tracer injection.
At near-maximal exercise, a 740 MBq dose of 99m Tc-sestamibi was injected and exercise was continued for at least an additional minute after injection. Post-stress gated SPECT was acquired on average 95–100 min post-stress in the supine and prone position. SPECT imaging was performed following standard protocols. No attenuation or scatter correction was used. SPECT images were acquired and processed as previously described, with a circular 180° acquisition [11]. During imaging, two energy windows were used for 201Tl, including a 30% window centred on the 70-keV peak and a 20% window centred on the 167-keV peak. For 99mTc-sestamibi SPECT, a 15% window centred on the 140-keV peak was used.
Semiquantitative visual interpretation was performed using a 20-segment model. Each segment was scored using a 5-point scale: 0 = normal, 1 = equivocal, 2 = moderate, 3 = severe reduction of radioisotope uptake and 4 = apparent absence of detectable tracer uptake in a segment. A summed stress score (SSS) was obtained by adding the scores of the 20 segments of the stress images and a summed rest score (SRS) by adding the scores of the 20 segments on the rest images. To assess defect reversibility, a summed difference score (SDS) was calculated by subtracting SRS from SSS, reflecting the severity and extent of ischaemia. For the degree of ischaemia, an SDS of <2 was considered nonischaemic, SDS 2–4 mildly, SDS 5–8 moderately, SDS 9–12 severely and SDS >12 extensively ischaemic. The coronary territories of the main epicardial vessels were defined as previously reported by Kang et al. according to the 20-segment MPS model [13].
Statistical analysis
Numerical data are presented as mean ± SD. Categor-ical data are presented as percentages. The relation between clinical exercise testing variables and severity of myocardial ischaemia as assessed by MPS were tested with the chi-square, Kruskal-Wallis and one-way analysis of variance (ANOVA) tests as appropriate. Interrelation between STD and SDS were tested by linear regression analysis and according to STD cate-gories (presented as box plots) with the Kruskal-Wallis test. All clinical exercise testing and MPS variables, which were associated to false-negative exercise ECG in a univariate model (p < 0.05), were used in a multivariate stepwise forward logistic regression analysis in order to find independent predictors of discrepant results between exercise ECG and MPS. The univariate association was tested by t test for numerical variables with normal distribution, Mann-Whitney U test for numerical variables without normal distribution and by Fisher’s test for nominal variables. The comparison of false-negative stress EGC between patients with known and unknown CAD, between patients with single- and multi-vessel disease and regarding the localization of myocardial ischaemia in patients with single-vessel disease was tested by chi-square test. Differences between exercise testing variables of patients with STD and no evidence of myocardial ischaemia and patients without STD and no evidence of myocardial ischaemia were tested by t test. A p value of ≤0.05 was considered statistically significant. Analyses were performed using the commercially available statistical package SPSS version 15.0.
Results
Patient characteristics
Patient characteristics and exercise testing variables are summarized in Tables 1 and 2. Patients with myocardial ischaemia were older, were more likely to be of male gender and had more often a history of CAD, prior myocardial infarction and typical angina as compared to patients without evidence of myocardial ischaemia on MPS. In addition, the prevalence of antianginal drug, aspirin and statin use was higher in patients with ischaemia.
Exercise testing and MPS findings
As shown in Table2, the majority of patients achieved the submaximal predicted heart rate and also the maximal double product (peak heart rate × maximal systolic blood pressure), which was consistent with an adequate stress test. Stress ECG showed significant STD in 215 patients (22%). MPS was consistent with myocardial ischaemia in 366
patients (38%). The achieved workload (expressed in W) as well as the peak exercise heart rate was lower in patients with myocardial ischaemia, whilst the proportion of patients with typical angina increased as a function of the extent of ischaemia.
Interrelation between extent of ST-segment depression and severity of ischaemia
The incidence of a significant exercise-induced ST-segment depression (≥ 1 mm) increased significantly as a function of ischaemic extent (Table 2). Furthermore, as depicted in Figs.1and2, the maximal STD strongly correlated with the severity of myocardial ischaemia (r=0.62, p<0.01). Look-ing at STD and SDS categories, the number of patients without STD decreased proportionally with increasing SDS. In contrast, the proportion of patients with STD of 1 mm or more increased with increasing severity of ischaemia (p for trend <0.01). Of note, among patients with severe (n=54) and extensive (n=47) ischaemia, 30% (n=16) and 17% (n=8) had no significant STD,
respec-Table 1 Characteristics of the study patients
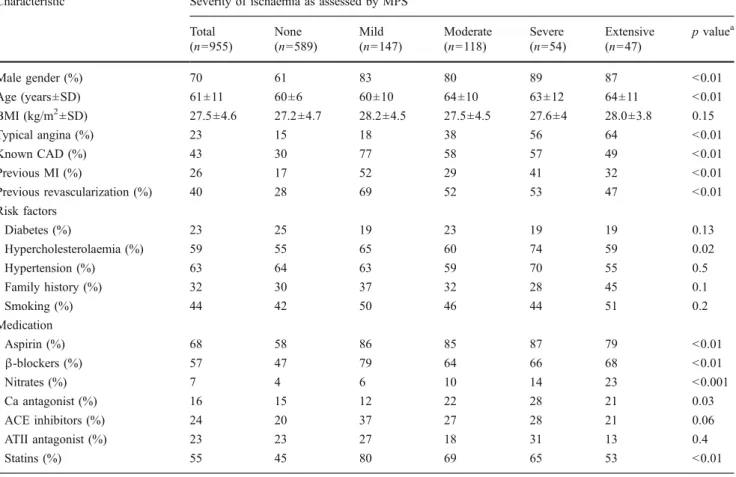
Characteristic Severity of ischaemia as assessed by MPS Total (n=955) None (n=589) Mild (n=147) Moderate (n=118) Severe (n=54) Extensive (n=47) p valuea Male gender (%) 70 61 83 80 89 87 <0.01 Age (years±SD) 61±11 60±6 60±10 64±10 63±12 64±11 <0.01 BMI (kg/m2±SD) 27.5±4.6 27.2±4.7 28.2±4.5 27.5±4.5 27.6±4 28.0±3.8 0.15 Typical angina (%) 23 15 18 38 56 64 <0.01 Known CAD (%) 43 30 77 58 57 49 <0.01 Previous MI (%) 26 17 52 29 41 32 <0.01 Previous revascularization (%) 40 28 69 52 53 47 <0.01 Risk factors Diabetes (%) 23 25 19 23 19 19 0.13 Hypercholesterolaemia (%) 59 55 65 60 74 59 0.02 Hypertension (%) 63 64 63 59 70 55 0.5 Family history (%) 32 30 37 32 28 45 0.1 Smoking (%) 44 42 50 46 44 51 0.2 Medication Aspirin (%) 68 58 86 85 87 79 <0.01 β-blockers (%) 57 47 79 64 66 68 <0.01 Nitrates (%) 7 4 6 10 14 23 <0.001 Ca antagonist (%) 16 15 12 22 28 21 0.03 ACE inhibitors (%) 24 20 37 27 28 21 0.06 ATII antagonist (%) 23 23 27 18 31 13 0.4 Statins (%) 55 45 80 69 65 53 <0.01
BMI body mass index (kg/m2), CAD coronary artery disease, MI myocardial infarction, ACE angiotensin-converting enzyme, ATII angiotensin II
a
tively (Fig.3). The maximal extent of STD also correlated with the number of diseased vessels (Fig.4).
Interrelations between the number of leads with significant ST-segment depression and severity of ischaemia
The relation between ECG and MPS findings of ischaemia were further evaluated by comparing the number of leads with STD and the extent of ischaemia, first using the precordial leads (no significant STD, STD < 4 precordial leads, STD≥ 4 precordial leads) and then all 12 ECG leads (no significant STD, STD < 6 leads, STD ≥ 6 leads). As shown in Fig.3, the number of ECG leads with significant STD over the precordial leads and over all ECG leads correlated with the severity of ischaemia as assessed by MPS (p for trend <0.01 for both). Similarly to the maximal magnitude of STD, also the number of involved ECG leads were associated with the number of diseased coronary vessels (Fig.4).
Predictors for discrepant findings between exercise ECG and MPS
As previously mentioned, the ECG and MPS findings of ischaemia are not concordant for all patients. In fact, among the 366 patients with myocardial ischaemia, 176 (48%) had no significant STD on exercise ECG. Looking at patients
(n=219) with moderate to extensive ischaemia (SDS >5), 71 (32%) had no significant STD. Therefore, we evaluated predictors (patient characteristics, exercise testing data, MPS results) for discrepant results between the two
Fig. 1 Interrelation between maximal ST-segment depression and severity of myocardial ischaemia
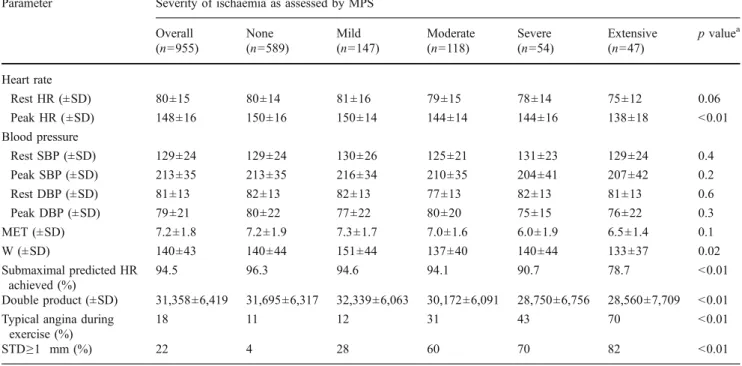
Table 2 Exercise testing parameters
Parameter Severity of ischaemia as assessed by MPS Overall (n=955) None (n=589) Mild (n=147) Moderate (n=118) Severe (n=54) Extensive (n=47) p valuea Heart rate Rest HR (±SD) 80±15 80±14 81±16 79±15 78±14 75±12 0.06 Peak HR (±SD) 148±16 150±16 150±14 144±14 144±16 138±18 <0.01 Blood pressure Rest SBP (±SD) 129±24 129±24 130±26 125±21 131±23 129±24 0.4 Peak SBP (±SD) 213±35 213±35 216±34 210±35 204±41 207±42 0.2 Rest DBP (±SD) 81±13 82±13 82±13 77±13 82±13 81±13 0.6 Peak DBP (±SD) 79±21 80±22 77±22 80±20 75±15 76±22 0.3 MET (±SD) 7.2±1.8 7.2±1.9 7.3±1.7 7.0±1.6 6.0±1.9 6.5±1.4 0.1 W (±SD) 140±43 140±44 151±44 137±40 140±44 133±37 0.02 Submaximal predicted HR achieved (%) 94.5 96.3 94.6 94.1 90.7 78.7 <0.01 Double product (±SD) 31,358±6,419 31,695±6,317 32,339±6,063 30,172±6,091 28,750±6,756 28,560±7,709 <0.01 Typical angina during
exercise (%)
18 11 12 31 43 70 <0.01
STD≥1 mm (%) 22 4 28 60 70 82 <0.01
HR heart rate, SBP systolic blood pressure, DBP diastolic blood pressure, MET metabolic equivalent, STD maximal ST-segment depression, W watt
a
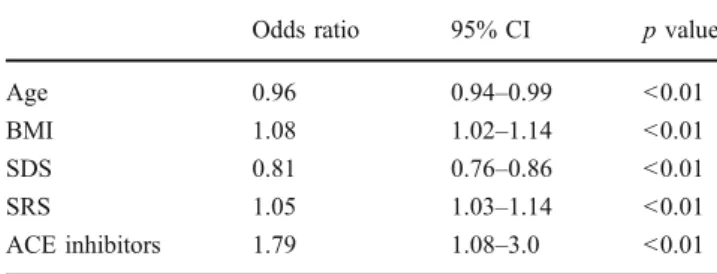
diagnostic modalities. In a univariate analysis, patients with myocardial ischaemia on MPS but no significant STD had more often a known CAD (74 vs 55%, p<0.01), prior myocardial revascularization (67 vs 50%, p<0.01), Q-wave on resting ECG (25 vs 12%, p<0.01), were more often on ACE inhibitor (38 vs 23%, p<0.01) or statin therapy (76 vs 66%, p<0.01) and had less frequently typical angina (24 vs 47%, p<0.01). Additionally, patients with myocardial ischaemia but no abnormal stress ECG had a higher BMI (28.5±4.5 vs 27.3±4.1 kg/m2, p<0.01), were younger (60.2±10.1 vs 64.4±10.4 years, p<0.01), had less severe ischaemia (5 vs 9 SDS, p<0.01) and a larger perfusion defect at rest (6 vs 4 SRS, p<0.01). After inclusion of these parameters in a multivariate regression analysis, advanced age and more severe myocardial ischaemia by SDS were independent predictors of concordant results, whereas higher BMI, larger defect at rest by SRS and ACE inhibitor therapy were predictors of discordant test results, meaning a negative ECG with evidence of ischaemia on MPS (Table3).
Focussing on patients without known CAD or significant Q-wave on their resting ECG (n=498), a significant STD was present in 92 patients (19%) and MPS was consistent with myocardial ischaemia in 117 patients (23%). On the other hand, among patients with known CAD or significant Q-wave on their resting ECG (n=457), a significant STD was present in 123 patients (27%) and MPS was consistent with myocardial ischaemia in 249 patients (55%).
The proportion of patients without significant STD and evidence of myocardial ischaemia on MPS was lower in patients without known CAD or significant Q-wave on resting ECG as compared to patients with known CAD (35 and 54%, respectively, p<0.01).
Focussing on patients with myocardial ischaemia only in one coronary territory (n=144) as assessed by MPS according to the above-mentioned model, 73 (51%) were found to have ischaemia in the territory of the left anterior descending artery (LAD), 24 (17%) in the circumflex artery (RCX) and 47 (32%) in the right coronary artery (RCA). Overall, the rate of false-negative exercise ECG in single-vessel disease was higher as compared to patients with multi-vessel disease (62 vs 40%, p<0.01). The rate of false-negative exercise ECG was independent of the localization of myocardial ischaemia (62% for LAD, 67% for RCX, 60% for RCA, p=0.8).
On the other hand, 25 patients (3%) showed a significant STD without evidence of myocardial ischaemia on MPS (SDS<2). Of note, none of these 25 patients had a transient ischaemic dilation of the left ventricle, which is a know indicator of balanced myocardial ischaemia. Among patients without myocardial ischaemia on MPS, those with significant STD (i.e. false-positive exercise ECG) had a higher peak systolic blood pressure (230±32 mmHg vs 212±35 mmHg, p=0.01), a higher peak heart rate (157±15 bpm vs 150± 16 bpm, p=0.03) and as consequence a higher maximal double product (36,418±7,282 vs 31,885±6,207, p<0.01) as compared to those without significant STD.
Discussion
The present study showed a good correlation between the magnitude of maximal STD or the number of ECG leads with STD during exercise testing and the severity of myocardial ischaemia as assessed by MPS (i.e. SDS and number of diseased coronary vessels).
Although exercise-induced STD is a well-defined and robust ischaemic ECG finding, which correlates with the severity of CAD as assessed by coronary angiography, the relation between the quantitative assessment of this variable (maximal extent of STD or the number of ischaemic ECG leads) and the extent of myocardial ischaemia as assessed by myocardial imaging modalities is less clear [14, 15]. Furthermore, no comparative data are available between ischaemic ECG and MPS findings using a bicycle ergometry protocol, which is the preferred stress modality in Europe.
Results of animal studies suggest that the extent of STD on surface ECG may be proportional to the area and severity of myocardial ischaemia [16]. In accordance with this, Persson et al. demonstrated a significant and positive correlation between the summed ST-segment deviation and Fig. 2 Interrelation between maximal ST-segment depression (STD)
and severity of myocardial ischaemia (SDS) according to STD and SDS categories (p for trend <0.01)
the severity of myocardial ischaemia assessed by MPS induced by balloon inflation during percutaneous coronary angioplasty [17]. Of note, the above-mentioned studies observed ECG changes during complete obstruction of a coronary vessel, limiting therefore the applicability to ECG changes during exercise testing.
Previous studies, which addressed this issue in a clinical setting comparing STD during exercise testing and MPS findings, revealed conflicting results [5–9]. Studies con-ducted by Bogaty et al. and Taylor et al. failed to show a correlation between ECG and MPS findings based on smaller patient collectives, i.e. 66 and 144 patients, Fig. 3 The maximal extent of
ST-segment depression (a) and the number of ECG leads with significant ST-segment depres-sion (b, c) increases with in-creasing severity of ischaemia (p for trend <0.01 for all)
respectively [5, 9]. Other studies reported a correlation between the two diagnostic modalities based on larger patient populations [6–8]. Hauser et al. identified a correlation between exercise-induced STD and severity of myocardial ischaemia as assessed by MPS in 1,006 patients. The incidence of MPS-detected myocardial is-chaemia (almost 1/3) and significant STD (almost 1/4) were similar to the present patient population. In contrast, the correlation between STD and myocardial ischaemia were
performed using a cut-off value of 2 mm STD, which is not consistent with the proposed diagnostic criteria of exercise ECG [10]. Furthermore, taking into account that the precordial leads (especially V5) are most sensitive for ischaemia detection and isolated STD in the inferior leads may be a false-positive response, we performed a separate analysis for precordial leads only to test the correlation between the number of ECG leads with significant STD and magnitude of myocardial ischaemia [18]. Additionally, Fig. 4 The maximal extent of
ST-segment depression (a) and the number of ECG leads with significant ST-segment depres-sion (b, c) correlates with the number of coronary artery terri-tories with ischaemia (p for trend <0.01 for all)
this is the first study comparing exercise ECG and MPS ischaemic findings on bicycle ergometry instead of tread-mill testing.
Exercise testing is a widely available and comparably cheap tool to evaluate patients with known or suspected CAD providing important diagnostic and prognostic infor-mation. Based on the available literature, and as handled in general practice, the presence and the maximal magnitude of STD are integrated in most of the diagnostic and prognostic scores (e.g. the Duke treadmill score in patients undergoing treadmill exercise testing) for assessment of patients with CAD [1, 4, 19]. The extent of myocardial ischaemia as assessed by MPS has been shown to predict outcome and prognostic benefit of myocardial revascular-ization in patients with stable CAD [20]. The present study demonstrates a clear and significant correlation between ECG and MPS findings of myocardial ischaemia, reinforc-ing therefore the pathophysiological background which supports the integration of the maximal STD during exercise testing in the prognostic assessment of patients with CAD as already proposed in different prognostic scores [4,19].
Even though, it should be stressed that many patients with evidence of myocardial ischaemia on MPS had no STD on bicycle ergometry. As above mentioned, higher body mass index, younger age, less severe myocardial ischaemia, presence of a large perfusion defect at rest (which is in part consistent with a larger scar) and ACE inhibitor therapy were independent predictors of false-negative exercise tests. The impact of obesity on accuracy of stress ECG may be explained by the augmented electrical impedance due to more fatty tissue, whereas myocardial scar tissue often is associated with mild peri-infarction ischaemia, which may be difficult to identify by ECG. Focussing on patients without known CAD or significant Q-wave on their resting ECG a lower rate of false-negative exercise ECG was found as compared to patients with known CAD. Interestingly, the localization of myocardial ischaemia as assessed by MPS (i.e. LAD, RCX
or RCA territory) was not different with respect to false-negative stress ECG results.
On the other hand, the proportion of patients with significant STD without evidence of ischaemia on MPS was low. These patients were more likely to have exaggerated exercise blood pressure response and peak double products. In this context, the STD may be a consequence of mild but diffuse subendocardial “relative” ischaemia as seen in patients with a hypertrophied left ventricle without coronary stenosis.
Study limitations
The accepted gold standard for CAD evaluation is not available in this study. Coronary angiography is superior to MPS to establish the diagnosis of CAD, even though myocardial ischaemia may be present even in the absence of relevant fixed coronary obstruction [21]. In contrast to coronary angiography, which is based on luminal assess-ment of the epicardial vessels, MPS is an imaging modality able to detect and quantify myocardial perfusion. As a consequence, exercise ST-segment depression may better correlate with MPS results than with results of coronary angiography.
Conclusions
The extent of STD and the number of ECG leads with STD during bicycle ergometry increased as a function of ischaemic extent and these variables per se provide information about severity of ischaemia.
Acknowledgments S. Muzzarelli was the principal investigator, planned the study, wrote the paper and did the statistical analysis together with M. J. Zellweger. M. Pfisterer and J. Müller-Brand participated in preparing the manuscript. M. J. Zellweger participated in preparing the manuscript, gave advice on planning the study and did the statistical analysis together with S. Muzzarelli.
Conflict of interest None.
Funding This study was done without financial support.
References
1. Gibbons RJ, Chatterjee K, Daley J, Douglas JS, Fihn SD, Gardin JM, et al. ACC/AHA/ACP-ASIM guidelines for the management of patients with chronic stable angina: a report of the American College of Cardiology/American Heart Association Task Force on Practice Guidelines (Committee on Management of Patients With Chronic Stable Angina). J Am Coll Cardiol 1999;33(7):2092–197. doi:10.1016/S0735-1097(99)00150-3.
Table 3 Multivariate analysis of predictors of false-negative stress ECG
Odds ratio 95% CI p value
Age 0.96 0.94–0.99 <0.01
BMI 1.08 1.02–1.14 <0.01
SDS 0.81 0.76–0.86 <0.01
SRS 1.05 1.03–1.14 <0.01
ACE inhibitors 1.79 1.08–3.0 <0.01 BMI body mass index (kg/m2), SDS summed difference score, SRS summed rest score, ACE angiotensin-converting enzyme, CI confi-dence interval
2. Berman DS, Hachamovitch R, Kiat H, Cohen I, Cabico JA, Wang FP, et al. Incremental value of prognostic testing in patients with known or suspected ischemic heart disease: a basis for optimal utilization of exercise technetium-99 m sestamibi myocardial perfusion single-photon emission computed tomography. J Am Coll Cardiol 1995;26(3):639–47. doi:10.1016/0735-1097(95) 00218-S.
3. Hachamovitch R, Berman DS, Kiat H, Cohen I, Cabico JA, Friedman J, et al. Exercise myocardial perfusion SPECT in patients without known coronary artery disease: incremental prognostic value and use in risk stratification. Circulation 1996;93(5):905–14.
4. Mark DB, Hlatky MA, Harrell FE Jr, Lee KL, Califf RM, Pryor DB. Exercise treadmill score for predicting prognosis in coronary artery disease. Ann Intern Med 1987;106(6):793–800.
5. Bogaty P, Guimond J, Robitaille NM, Rousseau L, Simard S, Rouleau JR, et al. A reappraisal of exercise electrocardiographic indexes of the severity of ischemic heart disease: angiographic and scintigraphic correlates. J Am Coll Cardiol 1997;29(7):1497– 504. doi:10.1016/S0735-1097(97)00091-0.
6. Galassi AR, Azzarelli S, Lupo L, Mammana C, Foti R, Tamburino C, et al. Accuracy of exercise testing in the assessment of the severity of myocardial ischemia as determined by means of technetium-99m tetrofosmin SPECT scintigraphy. J Nucl Cardiol 2000;7(6):575–83. doi:10.1067/mnc.2000.108731.
7. Hauser TH, Dorbala S, Sulaiman A, Di Carli MF. Quantitative relation of ST-segment depression during exercise to the magnitude of myocardial ischemia as assessed by single-photon emission computed tomographic myocardial perfusion imaging. Am J Cardiol 2004;94(6):703–8. doi:10.1016/j.amjcard.2004.06.001.
8. Tavel ME, Shaar C. Relation between the electrocardiographic stress test and degree and location of myocardial ischemia. Am J Cardiol 1999;84(2):119–24. doi:10.1016/S0002-9149(99)00219-2. 9. Taylor AJ, Sackett MC, Beller GA. The degree of ST-segment
depression on symptom-limited exercise testing: relation to the myocardial ischemic burden as determined by thallium-201 scintigraphy. Am J Cardiol 1995;75(4):228–31. doi:10.1016/ 0002-9149(95)80025-N.
10. Gibbons RJ, Balady GJ, Bricker JT, Chaitman BR, Fletcher GF, Froelicher VF, et al. ACC/AHA 2002 guideline update for exercise testing: summary article. A report of the American College of Cardiology/American Heart Association Task Force on Practice Guidelines (Committee to Update the 1997 Exercise Testing Guidelines). J Am Coll Cardiol 2002;40(8):1531–40. doi:10.1016/S0735-1097(02)02164-2.
11. Berman DS, Kiat H, Friedman JD, Wang FP, van Train K, Matzer L, et al. Separate acquisition rest thallium-201/stress
technetium-99m sestamibi dual-isotope myocardial perfusion single-photon emission computed tomography: a clinical validation study. J Am Coll Cardiol 1993;22(5):1455–64.
12. Zellweger MJ, Kaiser C, Brunner-La Rocca HP, Buser PT, Osswald S, Weiss P, et al. Value and limitations of target-vessel ischemia in predicting late clinical events after drug-eluting stent implantation. J Nucl Med 2008;49(4):550–6. doi:10.2967/ jnumed.107.046771.
13. Kang X, Berman DS, Lewin HC, Miranda R, Agafitei R, Cohen I, et al. Comparative localization of myocardial ischemia by exercise electrocardiography and myocardial perfusion SPECT. J Nucl Cardiol 2000;7(2):140–5. doi:10.1016/S1071-3581(00)90034-5. 14. Martin CM, McConahay DR. Maximal treadmill exercise
electro-cardiography. Correlations with coronary arteriography and cardiac hemodynamics. Circulation 1972;46(5):956–62.
15. Weiner DA, McCabe CH, Ryan TJ. Identification of patients with left main and three vessel coronary disease with clinical and exercise test variables. Am J Cardiol 1980;46(1):21–7. doi:10.1016/0002-9149(80)90600-1.
16. Holland RP, Arnsdorf MF. Solid angle theory and the electrocar-diogram: physiologic and quantitative interpretations. Prog Car-diovasc Dis 1977;19(6):431–57. doi:10.1016/0033-0620(77) 90009-3.
17. Persson E, Pettersson J, Ringborn M, Sörnmo L, Warren SG, Wagner GS, et al. Comparison of ST-segment deviation to scintigraphically quantified myocardial ischemia during acute coronary occlusion induced by percutaneous transluminal coro-nary angioplasty. Am J Cardiol 2006;97(3):295–300. doi:10.1016/ j.amjcard.2005.08.044.
18. Miranda CP, Liu J, Kadar A, Janosi A, Froning J, Lehmann KG, et al. Usefulness of exercise-induced ST-segment depression in the inferior leads during exercise testing as a marker for coronary artery disease. Am J Cardiol 1992;69(4):303–7. doi:10.1016/ 0002-9149(92)90224-M.
19. Morrow K, Morris CK, Froelicher VF, Hideg A, Hunter D, Johnson E, et al. Prediction of cardiovascular death in men undergoing noninvasive evaluation for coronary artery disease. Ann Intern Med 1993;118(9):689–95.
20. Hachamovitch R, Hayes SW, Friedman JD, Cohen I, Berman DS. Comparison of the short-term survival benefit associated with revascularization compared with medical therapy in patients with no prior coronary artery disease undergoing stress myocardial perfusion single photon emission computed tomography. Circulation 2003;107(23):2900–7. doi:10.1161/01. CIR.0000072790.23090.41.
21. Camici PG, Crea F. Coronary microvascular dysfunction. N Engl J Med 2007;356(8):830–40. doi:10.1056/NEJMra061889.