Nicholas Leplat, Jozef Federič, Katarína Šulková,
Mária Sudolská, Florent Louis, Ivan Černušák, and
Michel Jean Rossi*
The Kinetics of the Reaction
C
2
H
∙
5
+ HI → C
2
H
6
+ I
∙
over an Extended
Temperature Range (213–623 K):
Experiment and Modeling
DOI 10.1515/zpch-2015-0607
Received March 30, 2015; accepted August 15, 2015
Abstract: The present study reports temperature dependent rate constants𝑘1for
the title reaction across the temperature range213to293 Kobtained in a
Knud-sen flow reactor equipped with an external free radical source based on the
re-actionC2H5I + H∙→ C2H∙5+ HIand single VUV-photon ionization mass
spec-trometry using Lyman-𝛼radiation of10.2 eV. Combined with previously obtained
high-temperature data of𝑘1 in the range298–623 Kusing the identical
exper-imental equipment and based on the kinetics ofC2H∙5 disappearance with
in-creasingHIconcentration we arrive at the following temperature dependence
*Corresponding author: Michel Jean Rossi, Laboratory of Atmospheric Chemistry (LAC), Paul
Scherrer Institute (PSI), CH-5232 Villigen PSI, Switzerland, e-mail: [email protected]
Nicholas Leplat: Laboratory of Atmospheric Chemistry (LAC), Paul Scherrer Institute (PSI),
CH-5232 Villigen PSI, Switzerland; and present address: Melbourne School of Engineering, Mechanical Engineering, Engineering Block E Bldg., The University of Melbourne, Parkville 3010 VIC, Australia
Jozef Federič, Ivan Černušák: Department of Physical and Theoretical Chemistry, Faculty of
Natural Sciences, Comenius University, Mlynskádolina CH1, 84215, Bratislava, Slovakia
Katarína Šulková: Advanced Technologies Research Institute, Faculty of Materials Science
and Technology, Slovak University of Technology in Bratislava, Hajdóczyho 1, 917 24 Trnava, Slovakia
Mária Sudolská: Department of Physical and Theoretical Chemistry, Faculty of Natural
Sciences, Comenius University, Mlynskádolina CH1, 84215, Bratislava, Slovakia; and Regional Centre of Advanced Technologies and Materials, Department of Physical Chemistry, Faculty of Science, Palacký University Olomouc, 17, listopadu 12, 771 46 Olomouc, Czech Republic
Florent Louis: PhysicoChimie des Processus de Combustion et de l’Atmosphère (PC2A), UMR
8522 CNRS/Lille1, Université Lille 1 Sciences et Technologies, Cité Scientifique, Bât. C11/C5, 59655 Villeneuve d’Ascq Cedex, France
best described by a three-parameter fit to the combined data set: 𝑘1 = (1.89 ± 1.19)10−13(𝑇/298)2.92±0.51exp((3570 ± 1500)/𝑅𝑇),𝑅 = 8.314 J mol−1K−1in the
range213–623 K. The present results confirm the general properties of kinetic
data obtained either in static or Knudsen flow reactors and do nothing to recon-cile the significant body of data obtained in laminar flow reactors using photolytic free radical generation and suitable free radical precursors. The resulting rate con-stant for wall-catalyzed disappearance of ethyl radical across the full temperature range is discussed.
Highly correlated ab initio quantum chemistry methods and canonical
transi-tion state theory were applied for the reactransi-tion energy profiles and rate con-stants. Geometry optimizations of reactants, products, molecular complexes,
and transition states are determined at the CCSD/cc-pVDZ level of theory.
Sub-sequent single-point energy calculations employed the DK-CCSD(T)/ANO-RCC
level. Further improvement of electronic energies has been achieved by ap-plying spin-orbit coupling corrections towards full configuration interaction and hindered rotation analysis of vibrational contributions. The resulting
the-oretical rate constants in the temperature range 213–623 K lie in the range
10−11–10−12cm3molecule−1s−1, however experiments and theoretical modelling
seem at great odds with each other.
Keywords: Ethyl Free Radical, H-Metathesis, Reaction Rate Constant,
Tempera-ture Dependence, Arrhenius Rate Parameters,ab initio Calculations, Potential
En-ergy Surface, Spin-Orbit Interaction. ||
Dedicated to Prof. Dr. Dr. h.c. mult. Jürgen Troe on the occasion of his 75thbirthday
1 Introduction
Reactions (R1) and (R2) may be found in textbooks and reviews of chemical ki-netics as belonging to a class of elementary reactions, namely atom transfer or metathesis reactions involving atomic hydrogen or halogen whose activation
en-ergies were found to have small positive values [1].
C2H∙
5 + HI → C2H6 + I∙ (𝑘1) (R1)
C2H∙
5 + Cl2 → C2H5Cl + Cl∙ (𝑘2) (R2)
Some time ago, this convenient and simple classification as elementary reaction came into question because experimental work based on laminar flow tube kinet-ics coupled to photoionization mass spectrometric detection of alkyl free radicals
and flash-photolysis resonance fluorescence of the resulting product atomic halo-gen strongly hinted at distinctly different activation parameters for atom
trans-fer reactions [2–4]. In distinct contrast to the classical results these newer
exper-iments yielded small negative activation energies. Together with the measured pre-exponential factors these more recent experiments resulted in large rate con-stants associated with a negative temperature dependence, in strong contrast to the small rate constants associated with a positive temperature dependence. Far from settled, the scientific community continues the search for a scientific recon-ciliation of this disagreement: the dividing line or discriminating difference be-tween both groups of experiments seems to be that the newer results are all asso-ciated with UV (excimer laser) photolytic generation of free radicals using a suit-able molecular precursor whereas the older results made use of thermal methods
of free radical generation. The proponents of the negative activation energy/high
value of the rate constant have performed a select few experiments at total
pres-sures up to tens of Torr ofHeorN2 that should have relaxed and thermalized
the alkyl free radical after UV photolysis before Reaction (R1) or (R2) could have taken place. Needless to say that these high-pressure experiments also resulted in high values of the rate constant associated with a negative temperature
depen-dence [4,5]. However, there are exceptions to the rule where newer results
ob-tained in laminar flow tubes connected to photolytic free radical generation have led to low rate constants coupled to positive temperature dependence for no
ob-vious reasons. Examples are the free radicalsC3H∙5 (allyl),CF2Cl∙,CF∙3,C3H∙3
(propargyl) andCFCl∙2in their reaction withCl2analogous to Reaction (R2) [6,7].
In addition, recentab initio quantum chemical work on reactions like (R1)
using the bromine analog have been found to be consistent with a negative acti-vation energy over a fairly large temperature range, albeit at the exclusion of close
numerical agreement [8] with published experimental results. In order to achieve
agreement with the more recent high values of the rate constant such as𝑘1or𝑘2
the potential well corresponding to the molecular adductC2H∙5•••HBrhad to be
arbitrarily adjusted fromΔr𝐻0 K0 = −9.7to−5.5 kJ mol−1relative toC2H∙5+ HBr
where the former value resulted from the quantum chemical search of the opti-mum reaction path. So far, sophisticated quantum chemical electronic structure calculations involving heavy iodine atoms in a hydrogen transfer reaction such
as (R1) have only been performed forCH∙3+ HIto date [9], so that the work
dis-played here represents the first example forC2H∙5. The reader is referred to Leplat
et al. for a more detailed account of additional background for Reaction (R1) [10],
which presents an experimental measurement of𝑘1that is approximately a factor
of20lower at300 Kcompared to the results of Seetula et al. [11]. So far,
sophisti-catedab initio electronic structure calculations coupled to chemical-kinetic
of results for hydrogen metathesis reactions that differ by factors of20and more
for more complex alkyl free radicals [10,12,13]. We hope that future, hopefully
imminent, developments will allow a quantitative evaluation of the two sets of
results on the level of sophisticatedab initio electronic structure theory coupled
to detailed chemical kinetic models.
In this work we have extended the temperature range of Reaction (R1) from
ambient down to213 Kin order to confirm the temperature dependence obtained
in previous work [10]. The emphasis of the present work is put on thekinetics of
Reaction (R1), namely the reaction rate parameters (pre-exponential factor𝐴,
ac-tivation energy𝐸a), rather than the thermochemistry of ethyl free radical. It must
be stated that the thermochemistry of ethyl was never really at the center of inter-est and did not constitute a point of contention for H-metathesis (transfer) reac-tions. This also becomes apparent when comparing the previously recommended
results with the new measurements [10,12,14]. This is entirely understandable
when one considers the used “strategy” based on the “Third Law” procedure: we
compute the equilibrium constant at high temperature (600–700 K) by taking the
ratio of the (measured) forward and (published) reverse rate constant and eval-uate the thermo-chemical parameters at high temperature which subsequently
are scaled down to298 K. The reason for this apparent lack of sensitivity of the
thermo-chemical parameters is the fact that both groups of disparate
measure-ments of Reaction (R1), namely high ([11]) and low ([10,12]) values, practically
coincide at high temperature which leads to similar or even essentially identical equilibrium constants at high temperature. The present work is based on the
vali-dation work on ethyl free radical published by Leplat et al. in [10] such that typical
validation experiments have not been repeated in the present work, namely the investigation of the reaction kinetics as a function of wall coating of the reaction vessel, the source of free radicals in the external radical source and mass balance considerations. As a disclaimer we would like to stress that the present work is based on the measurement of the disappearance of ethyl free radicals using the
dedicated SPIMS experiment [14] in contrast to the Closed Shell Product (CSP)
de-tection presented in [10].
2 Experimental and theoretical procedures
The experimental technique used for the measurement of𝑘1(Reaction R1) closely
follows our published procedure [10] using a dedicated instrument [14] based on
single VUV photoionization mass spectrometric (SPIMS) detection of ethyl free radical. Both of these publications present a sketch of the experimental
appara-Table 1: Important parameters of the used Knudsen flow reactors “a” and “c”. Reactor a Reactor c Volume (cm3) 213 272.6 Internal area (cm2) 256 253 𝛷 exit aperture (mm) 3.5 2.0 𝑘𝑒(s−1) 1.034 × (𝑇/𝑀)1/2 0.441 × (𝑇/𝑀)1/2 𝑘𝑒(s−1)a 1.649 × (𝑇/𝑀)1/2 a 0.420 × (𝑇/𝑀)1/2 a 𝜔 (s−1) 4386 × (𝑇/𝑀)1/2 3388 × (𝑇/𝑀)1/2 aCalculated on the basis of nominal values (3.5 and 2.0 mm diameter, respectively).
tus. Briefly, ethyl free radical was generated upstream of the Knudsen flow
reac-tor using Reactions (R3) and (R4). The microwave discharge (2.45 GHz) was set to
40–60 Wpower deposition in the tube leading to approximately
H2((𝜇)-wave) → 2H∙ (R3)
H∙ + C2H5I → C2H5∙ + HI (Δr𝐻0 K0 = −74.9 kJ mol−1) (R4)
50%destruction ofH2in a20% H2inArmixture.Arhas been used as an
inter-nal standard for MS detection of ethyl free radical and stable species. The total pressure in the discharge and the downstream free radical mixing tube was in the
range0.1to0.3 mbar. The reactive flow containing ethyl free radical was
subse-quently admitted to the Knudsen flow reactor across a1–2 cmlong and1–2 mm
ID PTFE capillary. Two Knudsen flow reactors of different residence times have been used, namely reactors “a” and “c”, where the former has been used in the past in the framework of technique validation and collection of kinetic data at
higher temperatures [10]. Reactor “c” was designed in order to adapt the reaction
vessel to slower kinetics, thus longer gas residence time that was expected with decreasing temperature. The reactant hydrogen iodide is admitted to the reaction vessel by means of a second capillary inlet line and interacts with ethyl free rad-ical for the first time inside the Knudsen flow reactor without prior interaction. Characteristic parameters of both FEP-coated Knudsen flow reactors are given in
Table1. Experiments have been performed at different temperatures in the range
213–293 Kthanks to a cooling unit (HAAKE Phoenix II P2-CT90W) with an ex-ternal pump, through which the cooling fluid ethanol was pumped through PVC tubing wound around the insulated body of the reaction vessel. The temperature was monitored by two type K thermocouple elements whose readings agreed to
within± 2 K. The calibration of the escape rate constants for both reaction vessels
rate constants of the present reaction system, namely𝑘1and𝑘C2H5
𝑤 , we need to
collect two linearly independent data sets which is the reason for the use of two reaction vessels of significantly differing geometry or gas residence times.
VUV-photons were obtained by discharging pureH2in order to obtain
essen-tially pure Lyman-𝛼radiation at121.5 nm(10.2 eV) as a source of photoionization
of molecular species. Previously we had varied numerous experimental
parame-ters such as the ethyl free radical precursor (C2H5I,C2H6) and corresponding
reaction (Ivs.Clabstraction) leading to the generation of thermal ethyl free
radi-cals, reaction vessel coating (Halocarbon wax 15-00, FEP (Fluorinated Ethylene
Propylene polymer) coating), VUV photolysis frequency (H2 vs.Cl2 discharge
lamp), mass balance and data treatment (decay of ethyl free radical vs. observa-tion of closed shell products from Reacobserva-tion (R1), recombinaobserva-tion and dispropor-tionation of ethyl radical) to find out that the obtained rate constant of interest
(𝑘1) was invariant to all these changes. Therefore, we decided to forego the
vali-dation of the method and selected a unique set of conditions described above.
The used gases and liquids were provided by Messer (Ar ≥ 99.998%,
H2≥ 99.995%) and Sigma Aldrich (C2H5I ≥ 99%). TheHIwas prepared according
to the procedure described by Dillon and Young [15]. Both condensable gases (HI
andC2H5I) were purified and degassed by using several freeze (77.36 K
)-pump-thaw cycles. TheHIwas stored in a glass bulb which was painted black in order
to minimize photolytic decomposition intoI2andH2.
Geometry parameters for reactants (HIand∙C2H5), products (∙IandC2H6),
and intermediate species (transition state (TS) and molecular complexes in the forward (MCR) and reverse (MCP) directions) were optimized with the coupled
cluster method using both single and double substitutions (CCSD) [16–19],
Dun-ning’s double-𝜁correlation consistent basis set cc-pVDZ forHandCatoms [20]
and Peterson’s pseudo potential basis set of the same class on iodine [21].
Vibra-tional frequencies were calculated numerically at the same level as the one used for geometry optimizations using the rigid rotor–harmonic oscillator (RRHO) ap-proximation. Vibrational frequencies and zero-point energy corrections have been
scaled by0.947[22] to compensate for the errors arising from the anharmonic
character of vibrational modes and the approximate electronic structure descrip-tion. Intrinsic Reaction Coordinate (IRC) calculations have been performed using
the algorithm [23,24] available in the GAUSSIAN program [25].
The low frequency vibrational modes corresponding to hindered (internal) rotations may cause substantial errors in the calculations of molecular parti-tion funcparti-tions and thermodynamic properties when treated in the standard rigid
rotor–harmonic oscillator (RRHO) approximation [26]. Therefore, we adopted
a simple one-dimensional (1D) hindered rotor model developed by Pfaendtner
dimensional Schrödinger equation is solved for each internal rotation, giving the energy levels to compute corresponding partition functions and, finally, enabling one to obtain the correct thermodynamic properties. The whole procedure con-sists of 1) calculation of the hindrance potential of a particular internal rotation, 2) the energy potential fit to a Fourier series expansion, 3) calculation of the re-duced moment of inertia, and 4) solving the above-mentioned Schrödinger equa-tion. In this work, the rigid scans of potential energy profiles corresponding to
internal rotations in the∙C2H5, MCR, TS, MCP, andC2H6structures were
calcu-lated at the CCSD level in combination with cc-pVDZ basis set on all atoms (in the case of iodine, the pseudopotential basis set of the same quality was used). The
scanning variable – dihedral angle – has been incremented by10∘in each step.
For all structures, we have identified as internal rotations the rotations of
theCH3andCH2groups, respectively, about theC–Csingle bond. The
frequen-cies of the vibrational modes (at CCSD/cc-pVDZ, without scaling) treated as
in-ternal rotations are151 cm−1(C2H5),199 cm−1(MCR),306 cm−1(TS),330 cm−1
(MCP), and326 cm−1(C2H6). The height of energy barrier increases from∙C2H5
(2.4 kJ mol−1) to MCR (4.1 kJ mol−1), TS (6.2 kJ mol−1) and MCP (13.5 kJ mol−1),
and subsequently increases slightly upon formation of the final productC2H6
(13.7 kJ mol−1). The calculated internal rotation barrier inC2H6is slightly higher
than the experimental value (12.0±0.5 kJ mol−1) [29]. Regarding the symmetry of
rotation, the symmetry number3could be unambiguously attributed only to the
internal rotation ofCH3aboutC–Cin theC2H6molecule. In the case of the other
structures, theCH3rotating top was considered as asymmetric (symmetry
num-ber of1) owing to the presence of the iodine atom in the corresponding systems
(i.e. the threeC–Hbonds inCH3are not equivalent in MCR, TS, and MCP) and
their overall point group symmetry (𝐶1). TheCH2group is asymmetric with
re-spect to the rotation about theC–Cbond in the∙C2H5structure (symmetry
num-ber1) because the twoHatoms inCH2and bothCatoms in the ethyl free radical
are not lying in a common plane.
Single-point energy calculations have been performed employing the single-reference coupled-cluster theory including single, double, and non-iterative triple
substitutions (CCSD(T)) as implemented in the MOLCAS7 program [30]. Scalar
rel-ativistic effects were incorporated using one-component second-order Douglas– Kroll–Hess approach (DK-CCSD(T)). When calculating the triple-excitation contri-bution for open-shell species we have used the spin-adaptation procedure of the
𝑇2excitation DDVV amplitudes. Relativistic ANO basis sets (ANO-RCC) were used
with the large contractions:H[6s4p3d1f],C[8s7p4d3f2g], andI[10s9p8d5f3g] [31].
The semi-core correlation of the 4d electrons on iodine is automatically included when using ANO-RCC sets in MOLCAS. In order to judge the quality of the single-reference CCSD(T) approach we have carefully monitored the absolute values of
the𝑇1and𝑇2excitation amplitudes. In all species they were well below0.1. This is a fairly safe threshold for the evaluation of the applicability of the single-reference approach in coupled cluster theory and was thoroughly analyzed by Urban and
coworkers [32,33].
The effects of higher excitations on the coupled cluster energies have also been evaluated using the continued fraction approximation (cf) as proposed by
Goodson [34]. This method works quite well even for stretched bonds typical for
TS, and is applicable for molecules with smooth convergence in CCSD.
The inclusion of the spin-orbit (SO) correction is important for studying the
energetics of iodine-containing species [9,35–39]. The SO effects have been
cal-culated as described in our previous studies [9,35,37–39] using the restricted
active space state interaction method (CASSCF/CASPT2/RASSI-SO [40], shortly
CASPT2/RASSI-SO), employing the complete active space (CASSCF) wave
func-tion as a reference and using the correlafunc-tion energy contribufunc-tions from
multi-state second-order multi-configurational perturbation theory (CASPT2) [41]. Our
SO corrections are−1.7,−2.1, and−27.0 kJ mol−1for MCR, TS, and MCP,
respec-tively, while the values for𝐼atom andHIwere−30.0and−2.3 kJ mol−1as
calcu-lated in our previous work for the reaction ofHIwithCH3radical [9]. It is worth
noting that the SO corrections for MCR and MCP are close to the ones obtained
for reactants and products with differences amounting to less than3 kJ mol−1. In
response to a referee comment we also tested the geometry dependence of the
SO corrections. This dependence could be significant forHIor for MCR and TS,
both may be regarded asHIperturbed in the presence of∙C2H5radical. We
cal-culated the potential energy curves forHIaround the minimum both for spin-free
and SO-corrected CASPT2 energies.HIis a good test because its SO correction of
2.28 kJ mol−1is important when going towards TS. The plot of theHIenergy
rela-tive to its SO-corrected minimum in the range1.4–2.1Å is displayed in Figure S1 of
the Supporting Information. The geometry effect is marginal around the minimum and starts to rise only slightly for the stretched bond, as the free atom character
of ∙Iatom becomes more important. MCP mainly consists of iodine atom that
is slightly perturbed by the presence ofC2H6being a weakly bound complex of
the type “closed-shell” interacting with an atom, so its effect on the SO correction on atomic iodine is also marginal. The test showed that the geometry effect on the SO correction does not play a significant role for the reaction at hand.
Although we were using fairly large basis sets for single point energies, it was useful to at least estimate the so-called basis set superposition error (BSSE). BSSE
has been calculated using the modification of the original Boys–Bernardi [42,43]
counterpoise (CP) correction as proposed by Xantheas [44]. This modification
takes into account the geometry relaxation when going from the subsystems to the supersystem. The CP correction is only applicable to weakly bound molecular
complexes but not to the transition state, where it can lead to discontinuous
po-tential surfaces [45]. The CP correction estimated in this way represents the
mag-nitude of the error bars for reaction barriers.
The rate constant 𝑘1 for the reaction between HI and C2H5 involves
a hydrogen-bonded adduct in the forward and reverse directions. It was initially
analyzed according to the scheme advocated by Singleton and Cvetanoviç [46] for
pre-reactive complexes and has been already detailed elsewhere for theHI + CH∙3
reaction [9]. The molecular adducts or complexes are called MCR and MCP
de-pending on whether these adducts are closer to the reactants (entrance channel) or products (exit channel) and are sometimes called inner or outer complexes de-pending on the direction of reaction.
In this work, the rate constant has been calculated using two different mech-anisms: – direct mechanism: HI + C2H∙ 5 → TS → 𝐼∙ + C2H6 (R1) – complex mechanism: HI + C2H∙5 𝑘a →MCR (R1a) MCR→ HI + C𝑘b 2H∙5 (R1b) MCR→𝑘c TS (R1c)
For the direct mechanism, the rate constant𝑘1(𝑇)is calculated using the classical
transition state theory (TST) [47–49] as:
𝑘(𝑇) = 𝛤(𝑇) × 𝑘B𝑇 ℎ × 𝑄TS(𝑇) 𝑄R(𝑇) × exp (−𝐸TS− 𝐸R 𝑘B𝑇 ) (1)
For the complex mechanism, the rate constant𝑘1(𝑇)may be obtained from the
following equation:
𝑘1(𝑇) = 𝐾1a,1b(𝑇)𝑘1c(𝑇) (2)
where𝐾1a,1bis the equilibrium constant between MCR and the reactants taking
into account Reactions (R1a) and (R1b), and𝑘1c is the rate constant for
Reac-tion (R1c). The applicaReac-tion of basic statistical thermodynamic principles for the
calculation of𝐾1a,1b= 𝑘1a/𝑘1band the TST formula to calculate𝑘1cleads to the
following equations: 𝐾1a,1b(𝑇) = 𝑄MCR(𝑇) 𝑄R(𝑇) exp (𝐸R− 𝐸MCR 𝑘B𝑇 ) (3)
𝑘1c(𝑇) = 𝛤(𝑇) × 𝑘B𝑇 ℎ × 𝑄TS(𝑇) 𝑄MCR(𝑇) × exp (−𝐸TS− 𝐸MCR 𝑘B𝑇 ) (4)
In above equations,𝑄R(𝑇),𝑄MCR(𝑇)and𝑄TS(𝑇)correspond to the total partition
functions of the reactants, the pre-reactive complex MCR, and the TS at
tempera-ture𝑇, respectively, while𝐸R,𝐸MCR, and𝐸TSare the total energies at0 K
includ-ing the zero-point energy corrections.𝛤(𝑇)indicates the transmission coefficient
used for the tunneling correction at temperature𝑇;𝑘Bandℎare the Boltzmann
and Planck constants, respectively.
The tunneling correction was calculated assuming an unsymmetrical
one-dimensional Eckart function barrier [50]. This method approximates the potential
as a one-dimensional function that is fitted to reproduce the zero-point energy
cor-rected barrier, the enthalpy of reaction at0 K, and the curvature of the potential
at the transition state. In the case of the reaction ofHIwith∙C2H5, the tunneling
corrections are negligible over the studied temperature range (𝛤(𝑇) = 1.00). The
GPOP program [51] was used to extract information from Gaussian output files, to
estimate the Eckart tunneling corrections, and to perform the rate constant calcu-lations over the temperature range of interest.
3 Results and discussion
The significant elementary processes are represented by Reaction (R1) and the fol-lowing three reactions (R5 to R7):
C2H∙5 → wall loss and escape (𝑘C2H5
𝑤 , 𝑘C𝑒2H5) (R5)
C2H∙5 + C2H∙5 → C2H4 + C2H6 (𝑘𝑑) (R6)
C2H∙5 + C2H5∙ → 𝑛 − C4H10 (𝑘𝑟) (R7)
We shown before that these four reactions represent the complete set of elemen-tary reactions under the chosen experimental conditions of molecular flow in the
Knudsen flow reactor in the range293to623 K[10], which is also valid for t-butyl
free radical (t-C4H∙9) [12]. It turns out that this also holds for ethyl free radical for
the present low temperature range (213–293 K) as no significant reaction paths
other than those given above have been discovered.
In analogy to Leplat, Wokaun and Rossi [10] the analysis of the present
reac-tion system makes use of the flow balance displayed in Equareac-tion (5) after estab-lishment of steady-state conditions in the Knudsen flow reactor:
𝑑[C2H5]
𝑑𝑡 = 𝑅𝑖𝑛C2H5− 𝑘1[C2H5][HI] − 2(𝑘𝑟+ 𝑘𝑑)[C2H5]
y = -0,4541x - 26,428 R² = 0,5801 y = -0,5126x - 26,4 R² = 0,7908 -30 -29 -28 -27 -26 2 3 4 5 ln k 1000/T (K-1)
Figure 1: Comparison between results obtained in reactor “a” ( ) and “c” ( ) without accounting
for𝑘𝑤. The corresponding least-squares Arrhenius lines are displayed. For reactor “a” two points at295 K from a previous publication (Table 6 in [10]) have been included in order to decrease the uncertainty in the rate parameters.
− (𝑘C2H5
𝑤 + 𝑘C𝑒2H5)[C2H5] ≡ 0 (5)
As discussed before [10] the ratio 𝐼
0 C2H5
𝐼C2H5 of the MS signals for ethyl free radical in
the absence and presence ofHI, respectively, is given in close approximation by
Equation (6) as a function of theHIconcentration:
𝐼0 C2H5 𝐼C2H5 = 1 + 𝑘1 𝑘C2H5 𝑤 + 𝑘C𝑒2H5 [HI] (6)
The slope of the ratio𝐼
0 C2H5
𝐼C2H5 as a function of [HI] corresponds to𝑘C2H5𝑤 𝑘+𝑘1C2H5𝑒
where
both𝑘1and𝑘C2H5
𝑤 (see Table2) are unknown in contrast to the escape rate
con-stant𝑘C2H5
𝑒 that has been measured for both reaction vessels “a” and “c” (see
above). We need to point out that we routinely observed the recombination
prod-uct n-C4H10 in reactor “c” at all chosen flow rates whereas for reactor “a” the
observation of n-butane was possible only at the highest flow rates owing to the smaller gas residence time. This is synonymous with a smaller partial pressure of
ethyl free radical leading to a smaller rate of recombination/disproportionation.
In contrast, Benson and coworkers were unable to observe n-butane from ethyl free radical recombination in a Knudsen flow reactor at concentrations similar to
the present work [52]. The reason for this still represents a mystery, all the more
so as the used mass spectrometer is identical to the presently used one (Balzers QMG421, QMA400 analyzer).
Figure1displays the rate constants as an Arrhenius plot where the green and
𝑘C2H5
𝑤 = 0 s−1. The results obtained using both reaction vessels are quite similar
across the temperature range213–293 Kwhich translates into similar Arrhenius
expressions given in Figure1. In order to obtain higher quality rate parameters
based on an Arrhenius plot we have included in Figure1two additional points
from a previous publication using Reaction (R1) and the identical reactor (“a”) as
well as reaction conditions (see Table 6 in ref. [10]). There are14points displayed
in Figure1for reactor “a” (green triangles) whereas Table3only lists12points
newly obtained in the present work. The remaining Figures display all points
ob-tained using reactors “a”, “b” and “c” from present and previous work [10].
Anal-ogous to previous, but recent work on Reaction (R1) reported by Leplat [10] we
conclude that𝑘C2H5
𝑤 must be small relative to𝑘C𝑒2H5. We decided to take into
ac-count𝑘C2H5
𝑤 in the evaluation of𝑘1in order to clearly separate both rate constants
and obtain a unique value of both𝑘1and𝑘C2H5
𝑤 for the existing data obtained in
both reaction vessels. We first establish the individual slopes𝑆𝑎and𝑆𝑐given in
Equation (7) by taking the averaged values for the rate constants from the two
corresponding Arrhenius expressions displayed in Figure1. From the ratio 𝐼
0 C2H5
𝐼C2H5
as a function ofHIconcentration for reaction vessels “a” and “c” we obtain the
individual slopes of the straight Arrhenius lines as follows: 𝑆𝑎 = 𝑘𝑎1/𝑘C2H5,𝑎
𝑒 and 𝑆𝑐 = 𝑘𝑐1/𝑘C𝑒2H5,𝑐 (7)
where superscripts “a” and “c” refer to data pertaining to reaction vessels “a” and
“c”. The goal therefore is to obtain values of𝑘1and𝑘C2H5
𝑤 that are independent of
the reaction vessels used in the determination of the kinetics. This is achieved al-gebraically by applying Equations (8) and (9), which will yield the desired values
of𝑘1and𝑘C2H5
𝑤 given the “local” values of𝑘1(𝑘𝑎1,𝑘𝑐1) and𝑘𝑒C2H5(𝑘𝑒C2H5,𝑎,𝑘C𝑒2H5,𝑐)
for the two reaction vessels “a” and “c”. 𝑘1 = 𝑆𝑎𝑆𝑐 𝑆𝑎− 𝑆𝑐 (𝑘𝑒C2H5,𝑐− 𝑘C𝑒2H5,𝑎) (8) 𝑘C2H5 𝑤 = 𝑆𝑐𝑘C2H5,𝑐 𝑒 − 𝑆𝑎𝑘C𝑒2H5,𝑎 𝑆𝑎− 𝑆𝑐 (9)
Table2displays the values of𝑘C2H5
𝑤 at four temperatures, and Figure2presents
an Arrhenius plot with the current data (red and green symbols) in which the
pre-viously measured values of𝑘1at high temperatures [10] have been added (blue
symbols). Table3displays the specific reaction conditions for reaction vessels “a”
and “c” with additional details given in Table A1 (Appendix). Figure3presents
an Arrhenius plot of𝑘1obtained in previous [10] and present work together with
the available literature values of Seetula et al. [11] and Hartley and Benson [53].
It is obvious that the data represented by the blue squares do not follow a sim-ple straight line, and the extended temperature range of the Knudsen flow reactor
Table 2: Rate parametersaobtained in reactors “a” and “c”, wall-catalyzed loss𝑘𝑤, ratio𝑘𝑤/𝑘𝑒.
Reaction 𝐴 𝐸a 𝑘𝑤(s−1) 𝑘𝑤/𝑘𝑒
(cm3molecule−1s−1) (kJ/mol) 293 K 273 K 243 K 213 K min–max C2H∙
5+ HI → C2H6+ I∙
Reactor a 3.33 × 10⁻¹² 3.78
0.53 0.57 0.64 0.74 0.16–0.61 Reactor c 3.42 × 10⁻¹² 4.26
aCorresponding ethyl free radical wall-loss reaction constants𝑘wfor𝑇 ≥ 293𝐾 may be found in [10]. -29 -28 -27 -26 0 1 2 3 4 5 lnk 1000/T (K-1)
Figure 2: Arrhenius plots
forC2H∙5+ HI → C2H6+ I∙ with𝑘𝑤correction. High temperature results previously published ([10]), present low temperature results obtained in reactor “c”, present low temperature results obtained in reactor “a”.
data necessitates the introduction of an additional parameter in order to suitably
describe the temperature dependence of𝑘1. This point is emphasized in Figure4
which displays a straight Arrhenius line in comparison with a three-parameter
fit of the temperature dependence of the consolidated data for𝑘1 obtained
us-ing a Knudsen flow reactor in previous [10] and present work. The simple
two-parameter and three two-parameter fits are given in Equations (10) and (11), respec-tively:
𝑘1= (6.77 ± 0.79)10−12exp(−(4939 ± 289)/𝑅𝑇)
𝑅 = 8.314 J mol−1K−1 (10) 𝑘1= (1.89 ± 1.19)10−13(𝑇/298)2.92±0.51exp((3570 ± 1500)/𝑅𝑇)
𝑅 = 8.314 J mol−1K−1 (11)
In view of the sizable temperature range213to623 K, it is unsurprising that
equa-tion (11) is a better representaequa-tion of the temperature dependence of𝑘1compared
to Equation (10) as displayed in Figure4. In any case, the present low-temperature
con-Table 3: Summary table of reaction conditions for titration of ethyl byHI (see Appendix Table S1
for complete information). The rate constant𝑘1includes correction for𝑘𝑤(Table2).
𝑇 Inlet flow [C2H5]0 [total]0 [HI]max 𝑘1 Error
(K) ofC2H∙5 (molec cm−3) (molec cm−3) (molec cm−3) (cm3s−1molec−1) (%) (molec s−1)
Knudsen Flow Reactor a (𝑉 = 213 ml, exit aperture = 3.5 mm, 𝑘esc(s−1)= 1.034 × (𝑇/𝑀)1/2) 213 4.59 × 10¹³ 7.68 × 10¹⁰ 2.49 × 10¹² 3.15 × 10¹³ 6.23 × 10⁻¹³ 18 228 4.97 × 10¹³ 8.04 × 10¹⁰ 2.39 × 10¹² 1.25 × 10¹³ 6.09 × 10⁻¹³ 46 228 4.48 × 10¹³ 7.25 × 10¹⁰ 1.97 × 10¹² 1.62 × 10¹³ 6.38 × 10⁻¹³ 64 228 4.30 × 10¹³ 6.96 × 10¹⁰ 2.07 × 10¹² 7.92 × 10¹² 3.77 × 10⁻¹³ 61 228 5.40 × 10¹³ 8.74 × 10¹⁰ 2.41 × 10¹² 2.13 × 10¹³ 5.65 × 10⁻¹³ 35 243 2.07 × 10¹³ 3.24 × 10¹⁰ 1.35 × 10¹² 1.30 × 10¹³ 6.61 × 10⁻¹³ 51 243 3.49 × 10¹³ 5.47 × 10¹⁰ 1.80 × 10¹² 1.27 × 10¹³ 5.95 × 10⁻¹³ 76 258 2.55 × 10¹³ 3.88 × 10¹⁰ 1.35 × 10¹² 1.65 × 10¹³ 6.56 × 10⁻¹³ 83 258 2.70 × 10¹³ 4.10 × 10¹⁰ 1.27 × 10¹² 1.04 × 10¹³ 5.93 × 10⁻¹³ 119 273 6.38 × 10¹³ 9.44 × 10¹⁰ 1.89 × 10¹² 1.98 × 10¹³ 8.32 × 10⁻¹³ 59 273 3.32 × 10¹³ 4.92 × 10¹⁰ 1.35 × 10¹² 2.80 × 10¹³ 6.17 × 10⁻¹³ 55 293 3.52 × 10¹³ 5.03 × 10¹⁰ 1.36 × 10¹² 1.98 × 10¹³ 9.85 × 10⁻¹³ 29 Knudsen Flow Reactor c (𝑉 = 272.6 ml, exit aperture = 2.0 mm, 𝑘esc(s−1)= 0.441 × (𝑇/𝑀)1/2) 213 3.18 × 10¹³ 9.75 × 10¹⁰ 3.58 × 10¹² 2.59 × 10¹³ 4.28 × 10⁻¹³ 80 228 4.36 × 10¹³ 1.29 × 10¹¹ 4.12 × 10¹² 2.96 × 10¹³ 6.64 × 10⁻¹³ 68 228 5.23 × 10¹³ 1.55 × 10¹¹ 4.44 × 10¹² 2.91 × 10¹³ 5.27 × 10⁻¹³ 32 243 2.72 × 10¹³ 7.83 × 10¹⁰ 3.40 × 10¹² 2.03 × 10¹³ 7.62 × 10⁻¹³ 56 258 4.29 × 10¹³ 1.20 × 10¹¹ 3.04 × 10¹² 3.05 × 10¹³ 6.63 × 10⁻¹³ 45 258 3.03 × 10¹³ 8.46 × 10¹⁰ 2.59 × 10¹² 2.80 × 10¹³ 6.40 × 10⁻¹³ 91 273 4.33 × 10¹³ 1.17 × 10¹¹ 3.29 × 10¹² 3.11 × 10¹³ 6.94 × 10⁻¹³ 23 273 2.92 × 10¹³ 7.90 × 10¹⁰ 2.48 × 10¹² 2.10 × 10¹³ 8.07 × 10⁻¹³ 34 293 4.72 × 10¹³ 1.23 × 10¹¹ 2.98 × 10¹² 2.03 × 10¹³ 7.57 × 10⁻¹³ 52 293 4.09 × 10¹³ 1.07 × 10¹¹ 2.79 × 10¹² 2.46 × 10¹³ 8.41 × 10⁻¹³ 66
stant associated to a small positive activation energy in contrast to data obtained
in laminar flow tubes using pulsed photolysis from a suitable precursor ([11] and
Figure4). Of note is the negative temperature dependence of the exponential term
in the three parameter fit that may not be confused with an Arrhenius activa-tion energy. Apparently the increase in the rate constant with temperature is
-30 -29 -28 -27 -26 -25 -24 0 1 2 3 4 5 k nl 1000/T (K-1)
Figure 3: Comparison of Arrhenius plots of present data with previously published𝑘
(C2H∙5+ HI → C2H6+ I∙) under all investigated conditions; present work, Seetula et al. [11], Hartley and Benson [53], Hartley and Benson recalculated based on work published in [65,66]. Uncertainties reflect the disagreement between the studies of Hunter and Kristiansson [65] and Hayes and Strong [66].
Figure 4: Comparison between linear fit (Arrhenius) and non-linear three parameter fit to
combined data across the full temperature range213–623 K: Arrhenius (full) line:
(𝑘1= (6.77 ± 0.79)10−12exp((−4940 ± 289)/𝑅𝑇), three-parameter (non-linear) fit (broken line): (𝑘1= (1.89 ± 1.19)10−13(𝑇/298)2.92±0.51exp((3570 ± 1500)/𝑅𝑇) with 𝑅 = 8.314 J K−1mol−1. The experimental uncertainty corresponds to the2𝜎 level whose numerical values are displayed in Table3and in reference [10] (Table 6).
Table 4: Essential structural parameters and imaginary vibrational frequencies for the transition
state and molecular complexes calculated at the CCSD/cc-pVDZ level of theory and CASPT2/RASSI/ANO-RCC spin-orbit corrections.
parameter MCR TS MCP 𝑟 (C–H), Å 2.403 1.872 1.093 𝑟 (I–H), Å 1.621 1.661 3.909 𝜃 (OHC), ° 170.4 175.7 127.4 𝐿a 0.061 𝜈#,cm−1 165i SO,kJ mol−1 −1.69 −2.06 −27.02 aThe
𝐿 parameter is defined as the ratio of the increase in the length of the bond being broken and the elongation of the bond being formed, each with respect to its equilibrium value in the reactant and the product. SO is the spin-orbit contribution of the iodine atom in different stages of the reaction.
Wall reactions
In addition, it is worthwhile to take a closer look at the “other” rate-constant
falling out of the evaluation of the raw data𝑘𝑎1 and𝑘𝑐1, namely𝑘C2H5
𝑤 . The
dis-cussion of this point is rarely undertaken in the literature for reasons unknown because formal algebra leads to an equal weight of both resulting rate
con-stants and therefore𝑘1does not carry more weight than𝑘C2H5
𝑤 . Table2together
with corresponding data from [10] (Table4) reveals that𝑘C2H5
𝑤 increases with
de-creasing temperature in a systematic way, in seeming contrast to the case of
t-C4H∙9 free radical (see Table 3 in ref. [12]). After scaling (down) the high
tem-perature data (298to623 K) [10], one observes an increase of𝑘C2H5
𝑤 (from0.37
to 0.74 s−1) when going from 623to 213 K. The scaling down of the previous
high-temperature values of𝑘C2H5
𝑤 [10] by a factor of1.52was necessary because
the present low-temperature and previous high-temperature measurements were temporally spaced apart by several months during which the state of the surface coating of the reaction vessels may have changed considerably. Frequent use of
the reaction vessel usually leads to a decrease in𝑘C2H5
𝑤 owing to passivation of
the walls. Conversely, a scaling up of the present low-temperature values might have been undertaken with equal justification. In terms of a qualitative interpre-tation one may state that the observed increase of wall-loss of ethyl free radical with decreasing temperature by a factor of two probably has to do with increasing
physi-sorption of ethyl on the cold FEP-coated internal vessel walls at low
tem-perature. This behavior is analogous to benzyl (C7H∙7) free radical inside a
Knud-sen flow reactor that physi-sorbs onto the ambient temperature vessel walls from which it may be desorbed back into the gas phase by heating the walls of the
re-action vessel [54]. It may, however, be difficult to compare the absolute values of
𝑘C2H5
𝑤 resulting from this work with corresponding values originating from
lami-nar flow tube work. Taking the work of Seetula et al. as an example for ethyl free
radical [11], one is led to the following conclusions: the absolute value of𝑘C2H5
𝑤
is roughly a factor of15to20larger than the present value at293 K, similar to
the increase in𝑘1. In addition, there does not seem to be a systematic variation
with temperature nor a dependence of𝑘C2H5
𝑤 on the type of surface coating. This
raises the question as to the nature of𝑘C2H5
𝑤 obtained in the laminar flow tube
ex-perimental series of measurements and whether𝑘C2H5
𝑤 may be compared to the
present measurements. Second-order wall reactions between adsorbed reactants are often invoked in cases where at least one of the reactants are “sticky” which means that its adsorption lifetime or surface residence time on the vessel wall is of the same order of magnitude or larger than the gas residence time. However, we have not observed any kinetics that would suggest such second-order wall re-actions for the reaction of interest throughout the used temperature range.
A look into typical literature values for wall-loss rate constants of free radi-cals may be helpful in this regard when dealing with similar free radiradi-cals studied by applying either discharge-flow techniques such as laminar flow tube or Knud-sen flow reactors. All reaction vessels had some sort of coating to minimize free radical wall losses. Starting from low to high absolute values of the wall-loss rate
constants we have𝑘O𝑤= 0 s−1for the reactionO(3P) + NO2→ NO + O2performed
in a typical discharge flow-resonance fluorescence apparatus [55]. This is not too
surprising because ground state oxygen atoms at low- to ambient temperatures
are thermally nonreactive. Mellouki et al. have measured𝑘HO2
𝑤 = 2 s−1with an
up-per limit of4 s−1in the range300to441 K[56] in the reactionHO∙2+ BrO∙
us-ing a discharge flow reactor equipped with Laser Magnetic Resonance (LMR)
de-tection. Bedjanian et al. have measured𝑘OH𝑤 = 3–10and𝑘HO2
𝑤 = 4–10 s−1in the
range230–320 Kusing a discharge-flow experiment equipped with modulated
molecular beam mass spectrometric detection in their study of theOH∙+ ClO∙
reaction [57]. It is not clear from the report whether or not the𝑘𝑤values follow
some sort of temperature dependence or whether the given limits are associated
with a high or low temperature. A discharge-flow study of the selfreaction ofIO∙
at300 Kby Vipond et al. [58] led to𝑘IO𝑤 = 6–8 s−1whereas a study of∙CH2OH
free radical reactivity withO2performed by Dobé et al. [59] resulted in𝑘CH2OH
𝑤 =
29±5 s−1. In this latter study the pseudo first-order rate as a function of the oxygen
free radical to lose atomicHto convert intoCH2O. Based on the straight first-order
line one may have concluded that fast wall-catalyzed reactions of∙CH2OHwere
absent. However, the published value given above resulted from computer
sim-ulations that “needed” a significant wall-loss for∙CH2OH(hydroxymethyl free
radical). At the limiting upper end of wall-catalyzed loss reaction rate constants for ethyl radical we may cite a study by Golden et al. that dealt with the recombi-nation of ethyl free radical at higher temperature in a gold-coated Knudsen flow
reactor with𝑘C2H5
𝑤 = 11and17 s−1at843and878 K, respectively [60].
Finally, Dobis and Benson generated ethyl free radical through H abstraction
by atomicCl∙in a Knudsen flow reactor [61] in the range203to343 K. In
agree-ment with our present results they did not report a value for 𝑘C2H5
𝑤 , simply
be-cause it is too small a value to be measured in the complexC2H6/Cl∙chemical
system. However, they did not observe the ethyl recombination product n-C4H10
whereas the disproportionation productsC2H6andC2H4were easily observed.
The reason for the opposite temperature dependence of𝑘𝑤for ethyl obtained in
the present and previous [10] study and t-butyl free radical [12], namely
decreas-ing and increasdecreas-ing with temperature, respectively, is by no means clear but may have to do with fast secondary reactions of atomic chlorine with n-butane, the
recombination product. Of note is the identicalC–Hbond strength for both free
radicals leading to the corresponding olefin, which therefore cannot be used as a guide for the differing temperature trend of radical stability. In conclusion, the
large value of𝑘C2H5
𝑤 obtained in the laminar flow tube work of Seetula et al. [11]
is not unusual in comparison to similar investigations of other free radicals, al-though it is rather large at the high-end of the range and does not have a definite
temperature trend as𝑘C2H5
𝑤 resulting from the present study. This raises the
ques-tion whether or not the mechanism is identical to the one observed in Knudsen
flow reactors. Of note is further the low absolute value of𝑘C2H5
𝑤 throughout the
studied temperature range investigated in this and the previous work on
Reac-tion (R1) [10]. Both𝑘1and𝑘C2H5
𝑤 seem to be a factor of approximately20larger in
the work of Seetula et al. [11] compared to the results of the present combined with
the previous study [10] (Table2).
Theoretical calculations
All molecular data relevant toab initio calculations are summarized in Tables4
and5and also in Supplementary Information, Tables S2 to S8 and Figure S1.
The energy profile for Reaction (R1) is displayed in Figure5and is based on
data presented in Table5. Similar to the bromine analog of Reaction (R1), namely
C2H∙
cal-Ta b le 5 : C o m p a rison of va riou s e n e rg y con tr ib u tion s to e n th a lp ie s a t0K (in kJ m ol −1) calculate d a t the CC S D (T )/ ANO -RCC -L (I) // CC S D /cc -pVDZ ale vel o f theo ry . S p in-o rb it co rr e cti o n s cal cul ated a t the C A S P T2 /RAS S I/ ANO -RCC lev el of th e o ry . fo rw a rd rev er s e equi li br iu m reac tion ste p HI + C2 H5 → MCR HI + C2 H5 → TS I+ C2 H6 → MCP I+ C2 H6 → TS HI + C2 H5 =I+C 2 H6 Δ𝐻 0K Δ𝐻 ̸= 0K Δ𝐻 0K Δ𝐻 ̸= 0K Δr 𝐻0K CC S D (T ) −12. 71 −16. 15 −6 .2 7 102. 20 −118. 25 ZP E c orre ct ion +4 .43 b +5 .73 +0 .66 −19 .33 +25 .06 S O co rr e cti o n +0 .59 +0 .22 +3 .01 +27 .97 −27 .75 cp co rr e cti o n +1 .46 c +1 .25 c cf co rr e cti o n +4 .98 +4 .77 +6 .03 +5 .59 −0 .82 CC S D (T ) d tota l −1 .2 5 −5. 42 4. 68 116. 43 −121. 85 e acc -p V D Z -P P on iod in e a to m , u s e d w it h in C C S D op ti m iz a tion s. bV a lu e s in it a lic s a re in d ivid u a l co rre ct ion s to Δ𝐻 0K and Δ𝐻 ̸= 0K. cA n e s ti m ate o f the e rro r b ars b ase d o n co u n te r-p oise ca lc u la tion s for fo rw a rd is ±2 kJ m ol −1 and ±5 kJ m ol −1 re ve rse reac tion s. d T o ta l C CS D (T ) va lu e w it h th e su m o f in d ivid u a lc orre c tion s. e Δ r 𝐻298 K = −125. 45 kJ mol −1 .S e e Fi g u re 5 fo r a p ic toria lr e p re se n ta -tion of C C S D (T )tota l .
culation leads to two molecular adducts MCR and MCP separated by a
transi-tion state whose potential energy is lower by4.17 kJ mol−1relative to MCR,
it-self more stable than the reactants by only1.25 kJ mol−1(Figure5). In contrast,
for the bromine analog of Reaction (R1) the molecular adduct MCR is stabilized by9.70 kJ mol−1relative to the reactants, with MCR itself more stable than TS by
Figure 5: Energy Diagram at𝑇 = 0 K for the complex mechanism of Reaction (R1) using the
results displayed in Table5(reaction enthalpyΔ𝐻0rat0 K equals free energy change at 0 K on ordinate. Of note is the fact that the ordinate is “broken”, that is discontinuous between “TS” and “MCP”). MCR, TS and MCP correspond to Molecular Complex in the entrance channel, Transition State and Molecular Complex in the exit channel when following the reaction from reactants (C2H∙5+ HI) to products (C2H6+ I∙).
a mere0.58 kJ mol−1. This represents a significant difference to the present
treat-ment of Reaction (R1) and needs to be critically evaluated in light of possible dif-ferences in computational protocols between Golden et al. and the present
the-oretical method. The reaction enthalpyΔ𝑟𝐻298 K0 has also been calculated using
the literature standard heats of formationΔf𝐻0 K0 of the species of interest (see
Appendix Table S5 for data and relevant references). The calculated reaction
en-thalpy at the CCSD(T)/ANO-RCC-L(I)//CCSD/cc-pVDZ level of theory including all
possible corrections (−125.45 kJ mol−1, Table5, footnote e) is in excellent
agree-ment with its experiagree-mental counterpart (−124.49 kJ mol−1, Table S5).
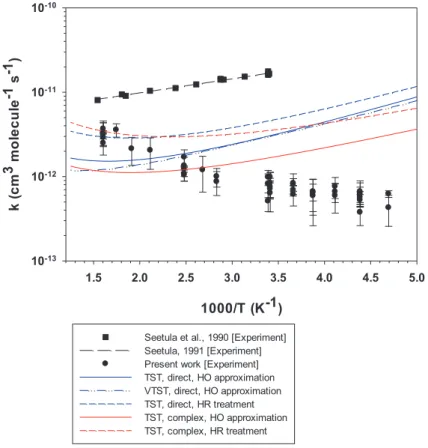
Figure6presents the computed𝑘1values as a function of temperature for
dif-ferent levels of theory, both for the direct and complex mechanisms. We also tested the influence of the kinetic theory using variational transition state theory using the direct mechanism and the rigid rotor harmonic oscillator (RRHO)
approxima-tion [62] as implemented in the GPOP software [51].50points on the Minimum
Energy Path (MPE) were used (25and25in the forward and reverse directions,
respectively). For all these points, SO effects are close to that of the TS structure,
the difference between the edge points in MPE does not exceed0.6 kJ mol−1. As
may be seen in Figure6, the use of either TST or VTST model leads to calculated
rate constants very close to each other. The largest differences (< 30%) may be
1000/T (K-1) 1.5 2.0 2.5 3.0 3.5 4.0 4.5 5.0 mc( k 3 el uc el o m 1- s 1- ) 10-13 10-12 10-11 10-10
Seetula et al., 1990 [Experiment] Seetula, 1991 [Experiment] Present work [Experiment] TST, direct, HO approximation VTST, direct, HO approximation TST, direct, HR treatment TST, complex, HO approximation TST, complex, HR treatment
Figure 6: Temperature dependence of the rate constant of the forward reaction
HI +∙C2H5→ I∙+ C2H6calculated at the CCSD(T)/ANO-RCC-L(I)//CCSD/cc-pVDZ level of theory with different kinetic models. Comparison with present experimental data together with available literature data.
in the Appendix, Tables S6 and S7. The best agreement is achieved for the com-plex pathway and the hindered rotor treatment of the internal rotations, both in the transition state TS and the MCR adduct. The corresponding broken red line in
Figure6comes closest to the average of the high temperature experimental data
for𝑘1and is approximately larger than the average taken at300 Kby a factor
of five. The corresponding harmonic oscillator model as well as the direct
reac-tion pathway results liee significantly below the calculated values of𝑘1 and
re-join the experimental data in the neighborhood of400 K. However, the
tempera-ture trend of𝑘1is not captured correctly in this low temperature range although
every theoretical treatment of varying complexity dealing with this kind of chem-ical activation mechanism shows this negative temperature dependence at
1000/T (K-1) 1.2 1.3 1.4 1.5 1.6 1.7 1.8 1.9 2.0 mc( k 3 el uc el o m 1- s 1- ) 10-22 10-21 10-20 10-19 10-18 10-17 10-16
Hartley and Benson, 1963 [Experiment] Knox and Musgrave, 1967 [Experiment] TST, direct, HO approximation TST, direct, HR treament TST, complex, HO approximation TST, complex, HR treatment
Figure 7: Temperature dependence of the rate constant of the reverse reaction
I∙+ C2H6→ HI +∙C2H5calculated at the CCSD(T)/ANO-RCC-L(I)//CCSD/cc-pVDZ level of theory. Comparison with the available two sets of literature data that do not provide the associated uncertainty limits of the experimental data.
However, all calculations switch to a positive temperature dependence of𝑘1 at
some higher temperature, the turnover temperature being a function of the type
of calculation. However, Figure6also shows that the present four different
theo-retical calculations of𝑘1are significantly below the experimental data of Seetula
et al. [11] even though theory captures well the general negative temperature
de-pendence from the lowest temperature to550and625 K, depending on any of the
four methods (see numerical values in Appendix Table S6). Unlike the situation
withCH∙3+ HI[9], sophisticated theory is unable to clearly decide which
experi-mental data of Reaction (R1) are accurate. The methyl+ HIwork just mentioned
clearly seems to agree with the recommended rate constants whose values at am-bient temperature are lower by a factor of six compared to laminar flow work by
Seetula et al. [11] whereas in the present case the situation is not as clear cut as
more in agreement with the present data set whereas the temperature dependence
seems to speak for the accuracy of the data of Seetula et al. [11]. In short, theory
and experiments are at odds with each other.
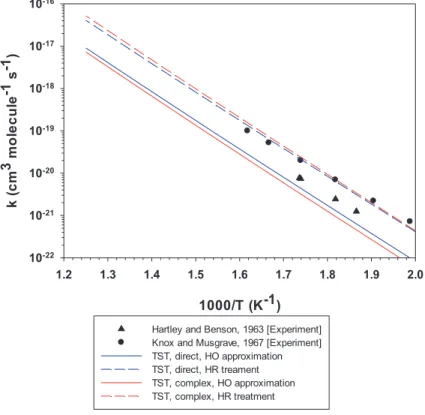
Figure7finally shows the results for the inverse of Reaction (R1), namely𝑘−1
as a function of temperature calculated by the four variants listed above, namely direct and complex pathways, both using harmonic oscillators and hindered ro-tors. The corresponding numerical values may be found in Appendix Table S7. The
inverse rate constant𝑘−1has been found by dividing𝑘1by the overall equilibrium
constant𝐾𝑒𝑞= 𝑘1/𝑘−1for the equilibriumC2H∙5+ HI C2H6+ I∙. Figure7shows
the excellent agreement of the theoretical results pertaining to both the complex and direct mechanisms coupled to the hindered rotor treatment (broken red and
blue lines in Figure7) with the measurements of Knox and Musgrave of𝑘−1[63]
whereas the agreement is less good for the calculations using the harmonic os-cillator approximation. The agreement with the data of Hartley and Benson is
poor as all calculated𝑘−1values using the hindered rotor model lie significantly
above the experimental results [53]. A reaction dynamics or collisional model
ap-proach for the reactionCH∙3+ HBr → CH4+ Br∙avoids transition state theory
al-together and achieves excellent agreement with experimental kinetic results over
the temperature range150to1000 Kalthough a switch between the two
colli-sional models has to be operated “by hand” at400 K[64]. The character of the
model changes with temperature because for𝑇 < 400 Kthe reaction mechanism
follows a complex-forming pathway whereas at𝑇 > 400 Ka direct mechanism
leads to a slight positive T-dependence of the rate constant. The minimum energy path of the reaction includes a distinct local minimum in the entrance and exit channels that are significantly larger compared to the present iodine-containing
system. The model also explains the vibrational excitation of the productCH4for
the direct high-temperature mechanism in contrast to negligible vibrational exci-tation for the complex-forming model. The model nicely demonstrates the vastly different lifetimes for the two mechanistic alternatives, that is direct vs. complex that may perhaps be amenable to experimental distinction.
4 Conclusions
Thermodynamic and kinetic parameters of the title reaction were studied using a composite approach based on CCSD optimizations and CCSD(T) single-point energy evaluations with the large ANO-RCC basis set, followed by a number of
small energetic corrections. The calculated standard reaction enthalpy at298 K
2.13 kJ mol−1). Predicted rate constants based on canonical transition state
the-ory including an asymmetric Eckart tunnelling correction are in good agreement with most of the literature data for the forward and reverse reactions. Experimen-tal data of Reaction (R1) taken over a large temperature range seem to agree bet-ter with the absolute values of the hindered rotor model for the complex-forming reaction mechanism whereas the associated slightly negative temperature
depen-dence matches the laminar flow tube data of Seetula et al. [11]. Both values of𝑘1
and𝑘C2H5
𝑤 at ambient temperature obtained in the present study are smaller by
ap-proximately a factor of20compared to Seetula et al. [11] albeit without showing
a clear temperature dependence of𝑘C2H5
𝑤 in the latter work. Finally, at the present
state of progress it is not possible to decide on the basis of a sophisticated quan-tum chemical model alone which of the two sets of experimental results, namely
the work of Seetula et al. [11] or the present, is more accurate despite the rather
large difference in𝑘1and𝑘C2H5
𝑤 at ambient temperature.
Acknowledgement: NL and MJR would like to thank the Swiss State Secretariat
of Education and Innovation for providing generous funds in the framework of the COST project CM0901 “Cleaner Combustion” through grant SBF No. C11.0052. IČ, KŠ and JF appreciate the support from Slovak Grant Agencies APVV (projects
APVV-0059-10 and LPP-0150-09) and VEGA (grant 1/0092/14). MS would like to
acknowledge the support from the Ministry of Education, Youth and Sports of the Czech Republic (project No. LO1305). Computer time for part of the theoretical calculations was kindly provided by the Centre de Ressources Informatiques de Haute Normandie (CRIHAN) and the Centre de Ressources Informatiques (CRI) of the University of Lille1. FL appreciates the support from the French ANR agency under Contract No. ANR-11-LABX-0005 “Chemical and Physical Properties of the Atmosphere” (CaPPA). MJR would like to acknowledge insightful discussions with John R. Barker (University of Michigan) and David M. Golden (Stanford Univer-sity) on the relationship between theory and experiment for elementary (or not?) free radical-molecule reactions. We explicitly thank professor John R. Barker for pointing out the possible molecular geometry dependence of the applied SO cor-rections in the review process. MJR also thanks Dr. Hualin Xiao (PSI) for statistical calculations.
References
1. D. M. Golden and S. W. Benson, Chem. Rev.69 (1969) 125.
2. P. W. Seakins, M. J. Pilling, J. T. Niiranen, D. Gutman, and L. N. Krasnoperov, J. Phys. Chem.
96 (1992) 9847.
3. J. A. Seetula, J. Chem. Soc. Faraday T.94 (1998) 891.
4. J. M. Nicovich, C. A. Vandijk, K. D. Kreutter, and P. H. Wine, J. Phys. Chem.95 (1991) 9890.
5. V. M. Ferrell, M.S., M.S. thesis, Georgia Institute of Technology, Atlanta, GA (1998). 6. R. S. Timonen and D. Gutman, J. Phys. Chem.90 (1986) 2987.
7. R. S. Timonen, J. J. Russell, D. Sarzynski, and D. Gutman, J. Phys. Chem.91 (1987) 1873.
8. D. M. Golden, J. P. Peng, A. Goumri, J. Yuan, and P. Marshall, J. Phys. Chem. A116 (2012)
5847.
9. K. Meciarova, M. Sulka, S. Canneaux, F. Louis, and I. Cernusak, Chem. Phys. Lett.517
(2011) 149.
10. N. Leplat, A. Wokaun, and M. J. Rossi, J. Phys. Chem. A117 (2013) 11383.
11. J. A. Seetula, J. J. Russell, and D. Gutman, J. Am. Chem. Soc.112 (1990) 1347.
12. N. Leplat and M. J. Rossi, J. Phys. Chem. A118 (2014) 5135.
13. N. Leplat and M. J. Rossi, Int. J. Chem. Kinet.46 (2014) 305.
14. N. Leplat and M. J. Rossi, Rev. Sci. Instrum.84 (2013) 114104.
15. R. T. Dillon and W. G. Young, J. Am. Chem. Soc.51 (1929) 2389.
16. J. Čížek, Adv. Chem. Phys.14 (1969) 35.
17. G. D. Purvis and R. J. Bartlett, J. Chem. Phys.76 (1982) 1910.
18. G. E. Scuseria, C. L. Janssen, and H. F. Schaefer, J. Chem. Phys.89 (1988) 7382.
19. G. E. Scuseria and H. F. Schaefer, J. Chem. Phys.90 (1989) 3700.
20. T. H. Dunning, J. Chem. Phys.90 (1989) 1007.
21. K. A. Peterson, B. C. Shepler, D. Figgen, and H. Stoll, J. Phys. Chem. A110 (2006) 13877.
22. Johnson III, R. D. (Ed.), NIST Computational Chemistry Comparison and Benchmark
Database, NIST Standard Reference Database Number 101, Release 16a,http://cccbdb.
nist.gov/, National Institute of Science and Technology (NIST), Gaithersburg, MD (2013).
23. C. Gonzalez and H. B. Schlegel, J. Chem. Phys.90 (1989) 2154.
24. C. Gonzalez and H. B. Schlegel, J. Phys. Chem.94 (1990) 5523.
25. M. J. Frisch, G. W. Trucks, H. B. Schlegel, G. E. Scuseria, M. A. Robb, J. R. Cheeseman, J. A. Montgomery Jr., T. Vreven, K. N. Kudin, J. C. Burant, J. M. Millam, S. S. Iyengar, J. Tomasi, V. Barone, B. Mennucci, M. Cossi, G. Scalmani, N. Rega, G. A. Petersson, H. Nakatsuji, M. Hada, M. Ehara, K. Toyota, R. Fukuda, J. Hasegawa, M. Ishida, T. Nakajima, Y. Honda, O. Kitao, H. Nakai, M. Klene, X. Li, J. E. Knox, H. P. Hratchian, J. B. Cross, V. Bakken, C. Adamo, J. Jaramillo, R. Gomperts, R. E. Stratmann, O. Yazyev, A. J. Austin, R. Cammi, C. Pomelli, J. W. Ochterski, P. Y. Ayala, K. Morokuma, G. A. Voth, P. Salvador, J. J. Dannen-berg, V. G. Zakrzewski, S. Dapprich, A. D. Daniels, M. C. Strain, O. Farkas, D. K. Malick, A. D. Rabuck, K. Raghavachari, J. B. Foresman, J. V. Ortiz, Q. Cui, A. G. Baboul, S. Clifford, J. Cioslowski, B. B. Stefanov, G. Liu, A. Liashenko, P. Piskorz, I. Komaromi, R. L. Martin, D. J. Fox, T. Keith, M. A. Al-Laham, C. Y. Peng, A. Nanayakkara, M. Challacombe, P. M. W. Gill, B. Johnson, W. Chen, M. W. Wong, C. Gonzalez, and J. A. Pople, Gaussian 03, Revision D.01, Gaussian Inc., Wallingford, CT (2004).
26. D. A. McQuarrie, Statistical Mechanics, Harper & Row, New York (1976). 27. J. Pfaendtner, X. Yu, and L. Broadbelt, Theor. Chem. Acc.118 (2007) 881.
28. J. Pfaendtner, X. Yu, and L. J. Broadbelt, Calctherm, version 0. 9, Northwestern University, Evanston, IL (2005).
29. K. S. Pitzer, Discuss. Faraday Soc.10 (1951) 66.
30. F. Aquilante, L. De Vico, H. Ferre, G. Ghigo, P. A. Malmqvist, P. Neogrady, T. Pedersen, M. Pitonak, M. Reiher, B. Roos, L. Serrano-Andrés, M. Urban, V. Veryazov, and R. Lindh, J. Comput. Chem.31 (2010) 224.
31. B. Roos, R. Lindh, P.-A. Malmqvist, V. Veryazov, and P. O. Widmark, J. Phys. Chem. A108
(2004) 2851.
32. M. Urban, P. Neogrady, J. Raab, and G. H. F. Diercksen, Collect. Czech. Chem. C.63 (1998)
1409.
33. M. Medved, M. Urban, V. Kello, and G. H. F. Diercksen, J. Mol. Struct.-Theochem547 (2001)
219.
34. D. Z. Goodson, J. Chem. Phys.116 (2002) 6948.
35. K. Meciarova, L. Cantrel, and I. Cernusak, Collect. Czech. Chem. C.73 (2008) 1340.
36. A. W. Jasper, S. J. Klippenstein, and L. B. Harding, J. Phys. Chem. A114 (2010) 5759.
37. F. Louis, I. Cernusak, S. Canneaux, and K. Meciarova, Comput. Theor. Chem.965 (2011)
275.
38. K. Sulkova, M. Sulka, F. Louis, and P. Neogrady, J. Phys. Chem. A117 (2013) 771.
39. M. Sulka, K. Sulkova, F. Louis, P. Neogrady, and I. Cernusak, Z. Phys. Chem.227 (2013)
1337.
40. B. Roos and P.-A. Malmqvist, Phys. Chem. Chem. Phys.6 (2004) 2919.
41. B. O. Roos, K. Anderson, M. P. Fulscher, P. A. Malmqvist, L. Serrano-Andrés, K. Pierloot, and M. Merchán, Multiconfigurational Perturbation Theory: Applications in Electronic Spectroscopy, in: Advances in Chemical Physics: New Methods in Computational Quantum Mechanics, I. Prigogine, S. A. Rice (Eds.), John Wiley & Sons, New York (1996).
42. S. F. Boys and F. Bernardi, Mol. Phys.19 (1970) 553.
43. G. Chalasinski and M. M. Szczesniak, Chem. Rev.94 (1994) 1723.
44. S. S. Xantheas, J. Chem. Phys.104 (1996) 8821.
45. G. Lendvay and I. Mayer, Chem. Phys. Lett.297 (1998) 365.
46. D. L. Singleton and R. J. Cvetanovic, J. Am. Chem. Soc.98 (1976) 6812.
47. H. Eyring, J. Chem. Phys.3 (1935) 107.
48. H. S. Johnston, Gas Phase Reaction Rate Theory, Roland Press Co., New York (1966). 49. K. J. Laidler, Theories of Chemical Reaction Rates, McGraw-Hill, New York (1969). 50. C. Eckart, Phys. Rev.35 (1930) 1303.
51. A. Miyoshi, GPOP software, revision 2013.07.15m6,http://www.frad.t.u-tokyo.ac.jp/
~miyoshi/gpop/(2014).
52. S. W. Benson, O. Dobis, and A. C. Gonzalez, J. Phys. Chem.95 (1991) 8423.
53. D. B. Hartley and S. W. Benson, J. Chem. Phys.39 (1963) 132.
54. N. Leplat, Unpublished observations (2015).
55. L. M. Avallone, J. Photoch. Photobio. A157 (2003) 231.
56. A. Mellouki, R. K. Talukdar, and C. J. Howard, J. Geophys. Res.-Atmos.99 (1994) 22949.
57. Y. Bedjanian, V. Riffault, and G. Le Bras, Int. J. Chem. Kinet.33 (2001) 587.
58. A. Vipond, C. E. Canosa-Mas, M. L. Flugge, D. J. Gray, D. E. Shallcross, D. Shah, and R. P. Wayne, Phys. Chem. Chem. Phys.4 (2002) 3648.
59. S. Dobé, F. Temps, T. Bohland, and H. G. Wagner, Z. Naturforsch. A40 (1985) 1289.
60. D. M. Golden, K. Y. Choo, M. J. Perona, and L. W. Piskiewicz, Int. J. Chem. Kinet.8 (1976)
61. O. Dobis and S. W. Benson, J. Am. Chem. Soc.113 (1991) 6377.
62. D. G. Truhlar and B. Garret, Annu. Rev. Phys. Chem.35 (1984) 159.
63. J. H. Knox and R. H. Musgrave, T. Faraday Soc.63 (1967) 2201.
64. J. Ree, Y. H. Kim, and H. K. Shin, J. Korean Chem. Soc.34 (2013) 2473.
65. T. F. Hunter and K. S. Kristiansson, J. Chem. Soc. Faraday T.78 (1982) 2067.
66. D. M. Hayes and R. L. Strong, J. Phys. Chem.90 (1986) 6305.
||
Supplementary material: The online version of this article