HAL Id: hal-03191207
https://hal.archives-ouvertes.fr/hal-03191207
Submitted on 6 Apr 2021
HAL is a multi-disciplinary open access
archive for the deposit and dissemination of
sci-entific research documents, whether they are
pub-lished or not. The documents may come from
teaching and research institutions in France or
abroad, or from public or private research centers.
L’archive ouverte pluridisciplinaire HAL, est
destinée au dépôt et à la diffusion de documents
scientifiques de niveau recherche, publiés ou non,
émanant des établissements d’enseignement et de
recherche français ou étrangers, des laboratoires
publics ou privés.
Effects of Adding Visual Cues on Distance Estimation,
Presence and Simulator Sickness During Virtual Visits
Using Wall Screen
Sabah Boustila, Dominique Bechmann, Antonio Capobianco
To cite this version:
Sabah Boustila, Dominique Bechmann, Antonio Capobianco. Effects of Adding Visual Cues on
Dis-tance Estimation, Presence and Simulator Sickness During Virtual Visits Using Wall Screen. 34th
Computer Graphics International Conference (CGI), 2017, Yokohama, Japan. �hal-03191207�
and Simulator Sickness During Virtual Visits Using Wall Screen
Sabah Boustila
University of Strasbourg 300 Bd S´ebastien Brant Strasbourg, France [email protected]Dominique Bechmann
University of Strasbourg 300 Bd S´ebastien Brant Strasbourg, France [email protected]Antonio Capobianco
University of Strasbourg 300 Bd S´ebastien Brant Strasbourg, France [email protected]ABSTRACT
Stereo and head tracking are considered as distance perception cues in virtual environments. Several studies have investigated their influence on several tasks. Results were different among studies. In this paper, we conducted a complete experiment investigating the influence of the stereo and the head tracking in the specific con-text of virtual visits of houses during architectural project review with clients. We manipulated the stereo and the head tracking in four conditions and we examined the effects of the two factors on distance estimations (walls size, habitability, etc.), task difficulty, presence and simulator sickness. Results revealed a significant effect of the stereo on the judgement of the habitability, the dimen-sions of the rooms and task difficulty. However, for both features, no significant effects were found on the presence and simulator sickness.
CCS CONCEPTS
•Human-centered computing → Virtual reality; User studies;
KEYWORDS
Virtual reality, virtual visits, architectural project review, stereo, head tracking, distance estimation, presence, simulator sickness
ACM Reference format:
Sabah Boustila, Dominique Bechmann, and Antonio Capobianco. 2017. Ef-fects of Adding Visual Cues on Distance Estimation, Presence and Simulator Sickness During Virtual Visits Using Wall Screen. In Proceedings of CGI ’17, Yokohama, Japan, June 27-30, 2017,7 pages.
DOI: 10.1145/3095140.3095161
1
INTRODUCTION AND RELATED WORK
Visual human system provides several cues for the perception of distances such as binocular disparity, accommodation and conver-gence, etc. In virtual environments (VE), the visual stimulus is perceived through several display devices that can distort distance perception cues. Our work takes place in an architectural project aiming to perform virtual visits of houses with clients using virtual reality (VR) tools. During virtual visits, clients are supposed to
Permission to make digital or hard copies of all or part of this work for personal or classroom use is granted without fee provided that copies are not made or distributed for profit or commercial advantage and that copies bear this notice and the full citation on the first page. Copyrights for components of this work owned by others than ACM must be honored. Abstracting with credit is permitted. To copy otherwise, or republish, to post on servers or to redistribute to lists, requires prior specific permission and/or a fee. Request permissions from [email protected].
CGI ’17, Yokohama, Japan
© 2017 ACM. 978-1-4503-5228-4/17/06...$15.00 DOI: 10.1145/3095140.3095161
judge the size of rooms and living comfort (habitability) to validate (or not) the mockup. Thus, they need to evaluate distances.
Previous works have found that distances are misperceived in VEs [14, 20]. For more realistic perception, VR systems can pro-vide head tracking, stereo, etc. The stereo has prompted many researchers to study its influence on distance estimates. Piryankova et al.[20] investigated the effect of stereo using a large screen, they found less underestimations with a stereoscopic display for distances up to 2.5m. However, distances between 3m and 5.5m were similarly underestimated with or without stereo. Further, Willemsen et al. [24] investigated the stereo with a head mounted display (HMD). In all VE conditions, distances between 5m and 15m were underestimated in comparison to the real world. Otherwise, distance estimation is also influenced by accommodation and con-vergence related to stereoscopic display systems. Indeed, Bruder et al.[3] found significant asymmetric effect of these two features on the estimation of distances.
In addition to visual display fidelity (stereo, FoV, etc), immersive VR systems provide viewing interactions such as head tracking [18, 21]. This last allows users to control the visual location in the VE by physical head and body movements. The change induced can help the viewer to judge distances between objects [16]. However, head tracking remains a weak distance cue. Jones et al. [14] found similar underestimations using HMD for distances between 2 and 8 meters whether using head tracking or not.
The combination of the stereo and the head tracking provides sev-eral distance informations and can helps the estimation of distances. A previous work indicated that stereo and motion information are very related to each other [6]. Some VR systems do not allow impor-tant head motions. Indeed, unlike CAVE and HMD, large screens provide display only on one screen in front of the viewer. Thus, just small head motions are allowed to stay focusing on the virtual scene.
Therefore, we were interested in knowing whether this combina-tion is necessary for distance estimacombina-tions and which factor is more implicated when using large screen.
Since the perception is more similar to the real world when experiencing depth and point of view changes during body and head movements/shifting [12], these two advanced features are expected to increase the sense of presence, in comparison to desktop tools. Indeed, the sense of presence was better with stereo and head tracking in [10]. Participants navigate in a furnished virtual room displayed on a rear-projection screen in several conditions: stereoscopy/monoscopy display with and without head tracking. This result is consistent with the result found in [12]. Participants
CGI ’17, June 27-30, 2017, Yokohama, Japan S. Boustila et al.
reported a better sense of presence when seeing a rally racing on a monitor screen using the two features.
Besides, most of previous works found that stereo and head tracking affect the simulator sickness in VEs [18, 23]. In video games context, Schild et al. [23] found a significant effect of the stereo on simulator sickness. The score was higher when using stereo. In this study, participants were sitting without movements in the two conditions (with and without stereo). Thus, the head tracking was not investigated. Furthermore, in the work of McGee [18], the author investigated the influence of head tracking on simulator sickness during a navigation task in a virtual office using a HMD and mouse to navigate. Results revealed that the score of simulator sickness increases when using head tracking.
In this paper, we conducted an experiment to investigate the effect of stereo and head tracking on distance estimations, presence and simulator sickness during virtual visits. To the authors’ best knowledge, no such complete user study has been conducted on the influence of these two features.
2
EXPERIMENT
The experiment consists of virtual visits of houses at scale 1:1. The visit is carried out with an active guided navigation following a predefined path represented by a green breadcrumb in the scene. The participant was standing physically at a distance of 1.5 meters in front of the screen and controlling his virtual movements with a Wiimote. The navigation consists of moving only forward and rotating around using the Wiimote buttons. In the head tracking conditions, participants were encouraged to move physically their body and head inside the tracking space.
During virtual visits, the participant was asked to answer orally the distance estimation questionnaire as explained in section 2.2.
2.1
Method
The experiment used a between-group design with two factors: stereo and head tracking. Each was varied by two levels. This provided a 2 X 2 design, as follow:
(1) Stereoscopic vision + head Tracking (ST) (2) Stereoscopic vision + no head Tracking (SnoT) (3) Monoscopic vision + head Tracking (MT) (4) Monoscopic vision + no head Tracking(MnoT)
The between-group design was used in order to avoid any learn-ing effect biases that may result from visitlearn-ing the same houses for four times.
Stereo and head tracking are two natural visual cues. Stereo seems to provide depth and distance informations. But in VEs it can increase simulator sickness symptoms. Besides, the changing in the perspective view provided by head tracking helps perceiving distances. Our hypothesis were:
H1Stereo and head tracking provide informations about distances and lead to a good perception of distances.
H2Stereo provided by the 3D glasses may induce eyestrain so, we hypothesis that stereo increases the simulator sickness.
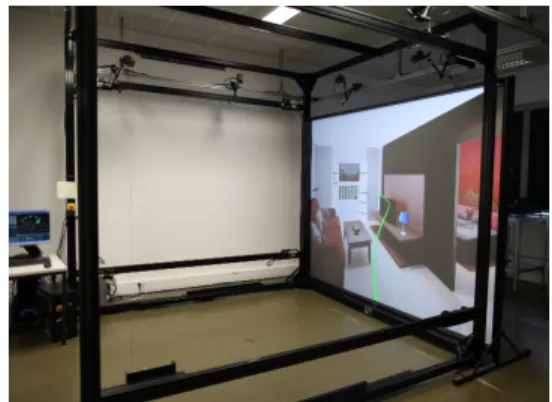
2.1.1 Apparatus and stimuli. The experiment took place in the virtual reality platform In Virtuo in our laboratory. We have used a rear-projected wall screen (3 m x 2.25 m) with a 90◦horizontal field
Figure 1: The platformIn Virtuo. An example of the virtual scene displayed on the large screen.
of view (FoV) and a 71◦vertical FoV. The resolution is 1400 x 1050.
For the interaction, participants used a tracked Nintendo Wiimote. Stereo was possible through active shutter glasses tracked using a Vicon tracking system based on 6 IR Bonita cameras (200Hz) providing a tracked space of 6 m2(see figure 1). The refresh rate was of 60Hz per eye. The virtual eyepoint height was set automatically corresponding to the subject’s eye height. Interocular distance was fixed to 6.3cm.
Our program is developed in C++ and is based on the VRJuggler library for devices management.
The virtual scenes were four houses at scale 1:1 created according to real 2D mockups. They were furnished with beds, sofa, tables, chairs, etc. Houses were created using 3DMax software, with simple textures. Realistic lighting was precomputed to avoid latency during on-line rendering.
2.1.2 Participants.40 voluntary students (33 males, 7 females) in our university took part in this experiment, 10 for each condi-tion. Average age was about 22 (between 20 and 26 years). All participants had normal or corrected-to-normal vision and had not previously performed experiments in VEs.
2.2
Measurements and evaluation
We evaluated the influence of the stereo and the head tracking on distance estimates using a specific questionnaire that we developed with architects. Moreover, we evaluated the influence of the two features on the virtual visits in general using standard presence and simulator sickness questionnaires.
2.2.1 The distance estimation questionnaire.The aim of the eval-uation using that questionnaire is to know the tendencies in dis-tance estimates without quantifying the error. We aimed to know if distances are underestimated or overestimated.
Participants answered this questionnaire while immersed in the virtual scene. The questionnaire is divided into four groups of ques-tions inspired by verbal estimation method and affordance judge-ments method. The evaluation of the questionnaire is explained at the end of this subsection.
(1) Size estimates: questions to estimate dimensions of the rooms (width and depth) in meter and to estimate the over-all area of the house in square meter. Since few people
can be accurate in expressing directly distances with a specific metric, we avoided direct verbal estimation and we preferred using closed-ended questions with 4 possi-ble answers. Participants could choose only one answer among four propositions. As well, our aim was to obtain an estimation tendency (under/overestimation).
Example: choose from the following propositions the width of the room: a) 4.2, b) 4.9, c) 5.6, d) 6.3 m.
To avoid the systematic selection of the middle values, we explained to the participants that the correct answer is not always in the middle. In fact, correct answers were distributed on the 4 possibilities in all the questionnaire. The three wrong values proposed with the correct answer were computed with an offset of 15% which is the just noticeable difference threshold for 3D distances [4]. (2) Furnishing judgements: 7-point Likert-type scale questions
to assess the possibility of furnishing rooms and putting specific furniture at specific locations. These questions depend on furniture present in rooms. In each room, the participant indicates if the place is wide enough to put the furniture.
Example: if you had to place the wardrobe next to the bed, do you think that the space would be: 1) insufficient ,2), 3), 4), 5), 6), 7) very sufficient.
In this example the right answer is 5. If the participant answers with 7, we consider that the size is overestimated. (3) Habitability judgements: 7-point Likert-type scale ques-tions to evaluate the capacity of the rooms to accommodate persons and to evaluate the feeling of comfort while imag-ining particular situations.
Example: When crossing a person in the corridor, the space available would allow you to do it: 1) with difficulty ,2), 3), 4), 5), 6), 7) easily.
For the analysis of furnishing and habitability judge-ments, we just consider if the judgement is positive (over-estimate) or negative (under(over-estimate).
(4) Task difficulty: a 7-point Likert-type scale question to eval-uate the difficulty of the virtual visits and the estimation of distances in the VE.
Example: Evaluate difficulty to visit and to estimate di-mensions: 1) easy, 2), 3), 4), 5), 6),7) difficult.
This questionnaire was elaborated with architects. For furnishing judgementsand habitability judgements the correct answers were calculated with them according to rules and standards of construc-tion, e.g. the minimum width of a corridor is 90 cm. Thus, a person needs a minimum width of 40 cm, in order to cross another person in the corridor.
Besides, even if the right answer was based on norms and rules, the questions used do not need an accurate knowledge of them to give an answer. Questions address cases where the right answer can be given just by imagining situations.
The evaluation of questions:For the analysis, we computed the signed gap as follow:
Error gap = participant’s answer - correct answer
If it is null, the estimation is exact. If it is positive, so the eval-uation is overestimated. Otherwise, the evaleval-uation is underesti-mated. For instance, in the furnishing judgement’s example, the right answer is 5. If the participant answers with 2 (insufficient) he underestimates the value. In this case, the error is -3 equivalent to 2-5.
2.2.2 Presence questionnaire ( PQ). We used the standard Wit-mer and Singer questionnaire translated in French by the Univer-sity of Quebec in Outaouais (UQO) Cyberpsychology Lab [8], to evaluate presence. The stereo and the head tracking are usually con-sidered as additional cues for a high visual display fidelity [21]. Our purpose is to investigate their influence on the sense of presence during virtual visits.
2.2.3 Simulator sickness questionnaire ( SSQ).To evaluate simu-lator sickness we used the questionnaire developed by Kennedy and his colleagues translated in French by the UQO Cyberpsychology Lab [7]. The stereoscopic viewing with glasses can lead to eyestrain which is one of the component of simulator sickness. Otherwise, head tracking can cause vertigo and thus disorientation. Our aim is to investigate the impact of experimental conditions on simulator sickness.
2.2.4 Debriefing session.Participants performed a semi-guided debriefing at the end of the experiment to explain to the experi-menter the methodology used to answer the distance estimation questionnaire.
2.3
Procedure
We investigated the four conditions presented in section 2.1. To minimize the impact of subjective appreciation based on furnish-ing preferences on subjects performance, participants visited four different houses. Subjects were randomly assigned to one of the experimental conditions. The total duration of the experiment is 1h20 for visits and questionnaires.
Virtual eyepoint height calibration.The virtual eyepoint height was set automatically according to the subject’s eye height. When the head tracking is not used, the participant wears glasses and stands facing the screen, the virtual eyepoint height is setting auto-matically. Afterword, the experimenter disables the tracking and starts the experiment.
2.3.1 Experiment.Before starting the experiment, the partici-pant reads instructions and trains on the navigation technique in the VE during 5 minutes.
The experiment starts, the participant moves using an active guided navigation following a predefined path. The aim of the guided navigation was to avoid navigation issues such as difficulties when avoiding obstacles and in order to make sure that all partici-pants had approximately the same visit time. The participant uses arrows on Wiimote to move forward, to stop (by pressing/releasing the forward arrow) and to turn around himself (right arrow to turn right and left arrow to turn left). Rotations up and down and going back were not possible. When the participant is inside a room, he hears a beep and he gets stuck with only the ability to look around himself. The experimenter starts asking orally questions
CGI ’17, June 27-30, 2017, Yokohama, Japan S. Boustila et al.
corresponding to the current room and notes the answers. The participant answers orally. Afterwards, the experimenter unlocks the participant to visit the next room.
At the end, the participant answers the presence and the simula-tor sickness questionnaires and gives a debriefing.
3
RESULTS AND DISCUSSION
For the analysis of the distance estimation questionnaire, first, we computed the error gap for each question. Second, to apply a para-metric test, we computed the mean values of error gaps (reported in table 1) for each group of questions.
Our independent variables are the stereo and the head tracking. The dependent variables are: size estimates (SE), furnishing judge-ments (FJ), habitability judgejudge-ments (HJ) and task difficulty (TD). We also analysed the effects of the independent variables on the presence (PQ) and the simulator sickness (SSQ).
For the statistical analysis, we first performed the Shapiro-Wilk normality test and Bartlett homogeneity test to verify if our data fulfilled the conditions of normality and homogeneity. When these conditions are respected, we realized a multi-factorial ANOVA at a 5% significance level. Otherwise, we performed a non-parametric Kruskal-Wallis rank sum test, and pairwise comparisons using the Nemeneyi post-hoc test. All results are reported in table 1.
Figure 2: Box plot representing mean of error gaps of size estimates for each experimental condition. Wall sizes were overestimated. Significant differences were only between ST vs MT and SnoT vs MT.
3.1
Size estimates (SE) furnishing judgements
(FJ) and habitability judgements (HJ)
As for furnishing judgements, the multi-factorial ANOVA have shown no main significant effect of stereo and head tracking (p-value= 0.710). Participants answer the furnishing judgements ques-tions similarly in all condiques-tions. Usually answers were underesti-mated. The mean of gaps for furnishing judgements varies between -0.404 and -1.651 as illustrated in table 1.
Otherwise, the non-parametric test revealed significant influence of stereo and head tracking on size estimates (p-value = 0.011) and
Conditions SE FJ HJ TD PQ SSQ ST 0.407 -0.923 -1.496 4.050 4.243 14.372 MT 0.919 -0.404 0.522 4.068 4.244 8.889 MnoT 0.672 -1.011 -0.431 4.300 4.290 10.097 SnoT 0.436 -1.651 -1.044 3.400 4.469 12.288 p-value 0.011 0.710 <0.05 0.016 0.576 0.144 H(3) 11.079 F(3,36) = 2.670 10.23 9.356 5.407 0.143
Table 1: All mean, p values showing the influence of the stereo and head tracking on the dependent variables and PQ and SSQ.
habitability judgements(p-value < 0.05). Pairwise comparisons have shown significant differences between ST vs MT (p-value = 0.026, p-value = 0.001) and SnoT vs MT (p-value = 0.026, p-value = 0.015) for size estimates and habitability judgements respectively. No significant difference was found between ST vs SnoT and MT vs MnoT. As shown on the figure 2, sizes are more overestimated when the vision is monoscopic without head tracking.
3.1.1 Trends.According to the mean values, we note a differ-ence in the trends in estimations according to questions. Wall sizes were overestimated whereas furnishing possibilities and habitabil-ity were overall underestimated. This can be related to the strategy used to answer questions. Indeed, during debriefing session, some participants mentioned using a computational strategy to evaluate the size of walls (size estimates), they calculated the distance be-tween two corners based on their own size (mainly). However, for the other questions, they gave answers just by imagining situations and based on intuition. This is consistent with previous works who found that the accuracy in the estimation of distances is different according to the method used to give judgements (direct walking, verbal reports, etc)[9, 22].
Furthermore, the overestimation is probably due to the compu-tational strategy. Indeed, if the participants imagine a segment less than their height and consider it equal to their height they will put more segment than necessary which leads to an overestimation. This is consistent with the earlier finding [1, 2, 26]. In Nevena [26] the dimensions of rooms width and length indicated in feet, were also overestimated.
3.1.2 Stereo and head tracking.For both size estimates and hab-itabilitywe observed no significant difference between ST, SnoT and MT, MnoT. We confidently interpret this as an absence of ef-fect for head tracking. Probably the amount of head motion was much smaller leading to no significant effect. Indeed, large screens provide display only on one screen in front of the view. Thus, even if participants were encouraged to move in the tracked space, they performed just small motions. Jones et al. [14] also found no significant effect of head tracking on distance estimations.
As for stereo, we found an effect on size estimates and habitability judgementsonly when the head tracking is used in ST and MT. When it is removed, the absence (MnoT) or the presence (SnoT) of the stereo do not affect estimations. Similarly, Willemsen et al. [25] have found no significant effect of stereo on distance estimation when head tracking was not used.
Figure 3: Box plot representing mean of gaps of habitabil-ity for each experimental condition. Significant differences were only between ST vs MT and SnoT vs MT.
Besides, even if the significant influence of the two factors was the same between conditions for size estimates and habitability, the effect was different. In fact, according to mean values (table 1), size estimateswere more accurate when using stereo in ST and SnoT. This means that adding stereo when head tracking is used improves size estimates. Nevertheless, this was the opposite for habitability judgements. The habitability was more underestimated in ST and SnoT.
Probably, the stereo with the head tracking help and improve estimations in the computational strategy used to evaluate dimen-sions of the walls whereas the visual impression of distances is not improved (for the habitability). However, since the strategy in furnishing judgementsand habitability judgements was the same, the absence of significant influence of the stereo and head tracking on furnishing judgements do not allow us to confirm this hypoth-esis. Unfortunately, we did not find previous experiments that investigate stereo and head tracking on the estimation of distances using similar strategies. Besides, these results cannot validate or invalidate our first hypothesis H1.
The effect of the two factors is different from the results found in previous works. In fact, some previous works did not find im-provement in distance judgements using stereo [20]. We emphasize that the nature of the task in our study is different from previous works. This difference in the influence of the stereo according to the task to perform was already mentioned [11]. Ragan et al. [21] conducted an experiment where participants counted the connec-tions (intersect or not) between horizontal and vertical lines based on depth. Stereo did not improve results. However, Hu et al. [11] found a significant effect of stereo on task where participants were instructed to approach a virtual block towards a virtual table as close as possible without touching it.
3.2
Task difficulty (TD)
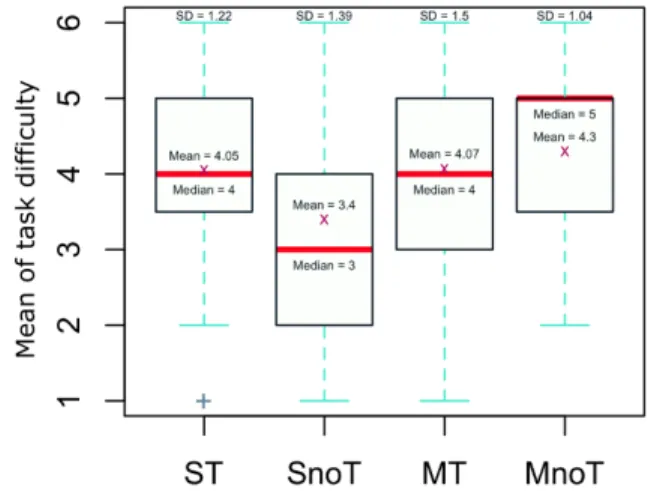
Concerning task difficulty we found significant results (p-value = 0.016). Task difficulty was estimated as being average with a mean values around 4/7 (7 represent a difficult task). Pairwise
Figure 4: Box plot representing the mean of task difficulty for each experimental condition. Task difficulty was as-sessed as being average (means around 4). The task was more difficult in the condition MnoT.
comparisons revealed a significant difference only between SnoT and MnoT (p-value = 0.016). The task was more difficult when the two factors were removed (MnoT) with a mean of 4.3/7 while easier with stereo (SnoT) with a mean of 3.4/7, see figure 4. This means that the head tracking alone do not influence task difficulty while the stereo do only when the head tracking is removed. The task difficulty assesses the difficulty of the experiment in the VE and the difficulty of the distance estimation task. Thus, for head tracking, the result seems logical because it did not affect the estimation tasks. As for stereo, previous work found that the importance of the stereo depends on the difficulty of the task to perform in the VE [19].
3.3
Presence (PQ) and simulator sickness (SSQ)
Results reveal no significant effect of stereo and head tracking on presence (PQ) (p-value = 0.576). The sense of presence was good in all conditions with means between 4.2 and 4.5 on 7 (7 is a good sense of presence), see table 1.
In contrast to previous work that found improvement in presence when using stereo and head tracking [12], in our study, results have shown a similar sense of presence in all conditions. Probably, the importance of the two factors depends on the nature of the task. In our study, participants had to visit houses and since the majority of them have already performed this task in real life, virtual visits seemed natural and probably led to a good sense of presence.
As for presence, no significant effect of stereo and head tracking was found on simulator sickness (SSQ) (p-value = 0.144). The ob-tained simulator sickness scores (see table 1) revealed significant symptoms ([10-15]) for ST, SnoT and MnoT, according to the inter-pretation of scores in [15] and minimal symptoms for MT ([5-10]). However, this difference in simulator sickness scores remains not significant.
Contrary to our expectations, we did not find an effect of stereo and head tracking on simulator sickness. This effect is different from
CGI ’17, June 27-30, 2017, Yokohama, Japan S. Boustila et al.
previous work that found a significant influence when investigating simulator sickness in stereo video game visualisation and virtual navigation tasks [17, 23].
3.4
Lack of measured inter-pupillary distance
(IPD)
Our project review tool is used by architects and their clients. For practical reasons and to save time, the architects preferred using a fixed IPD for all clients.
The IPD can affect distance estimates and simulator sickness. For the simulator sickness, the score of the SSQ should increase when the IPD is not suitable. Indeed, Jinjakam et al. [13] found that the SSQ increases with an IPD of 2.0cm in comparison to 6.5cm. The IPD of 2.0cm is not adapted because normal IPD is between 5.0cm and 7.0cm [5]. In our results, the absence of differences between stereo condition and monocopic condition on global SSQ can be interpreted by the fact that the fixed IPD of 6.3cm does not provoke negative effects during virtual visits. Indeed, if it was not the case, the SSQ should increase when adding stereo.
Besides, we can note that used IPD does not bias size estimates, furnishing judgements, and habitability judgements because there was no significant difference (no degradation) between ST and Mnot and Snot and MnoT in the judgements.
To confirm these interpretations, in future work, we will conduct an experiment with two conditions of stereo viewing, one with a fixed IPD and the other with an adapted IPD.
4
CONCLUSION AND FUTURE WORKS
In this paper, we investigated the effect of stereo and head tracking, with wall screen, on the estimation of distances, the presence and simulator sickness during virtual visits in a context of architectural project review. Distances were judged using a specific question-naire evaluating wall dimensions (size estimates), the possibility of specific furnishing (furnishing judgements) and the leaving com-fort (habitability judgements). Results revealed significant effect of stereo when used with head tracking only on size estimates and habitability judgements. Otherwise, task difficulty was higher when the two factors were removed. No significant influence was found on presence and simulator sickness. In the present study, we have used a fix inter-populary distance (IPD), for piratical reasons. In the future we need to conduct an experiment to compare the effect of a fixed IPD and adapted IPD. Besides, we will conduct an experiment in real environment and compare results with those in the virtual environment.
REFERENCES
[1] S. Boustila, A. Capobianco, and D. Bechmann. 2015. Evaluation of Factors Affecting Distance Perception in Architectural Project Review in Immersive Virtual Environments. In Proceedings of the 21st ACM Symposium on VRST. [2] S. Boustila, A. Capobianco, D. Bechmann, and O. Gnevaux. 2016. A hybrid
projection to widen the vertical field of view with large screens to improve the perception of personal space in architectural project review. In IEEE Symposium on 3DUI. 191–200. DOI:https://doi.org/10.1109/3DUI.2016.7460052
[3] G. Bruder, F. A. Sanz, A. H. Olivier, and A. Lecuyer. 2015. Distance estimation in large immersive projection systems, revisited. In IEEE Virtual Reality (VR). 27–32. DOI:https://doi.org/10.1109/VR.2015.7223320
[4] D.V.S.X. De Silva, W.A.C. Fernando, S.T. Worrall, S.L.P. Yasakethu, and A.M. Kondoz. 2010. Just noticeable difference in depth model for stereoscopic 3D displays. In Multimedia and Expo (ICME), 2010 IEEE International Conference on. 1219–1224. DOI:https://doi.org/10.1109/ICME.2010.5582582
[5] N. A. Dodgson. 2004. Variation and extrema of human interpupillary distance. In Proc. SPIE 5291. 36–46.
[6] F. Domini, C. Caudek, and H. Tassinari. 2006. Stereo and motion information are not independently processed by the visual system. Vision Research 46, 11 (2006), 1707 – 1723. DOI:https://doi.org/10.1016/j.visres.2005.11.018
[7] Universit du Qubec en Outaouais (UQO). 2002. Questionnaire sur les cyber-malaises. http://w3.uqo.ca/cyberpsy/docs/qaires/ssq/SSQ vf.pdf. (2002). [8] Universit du Qubec en Outaouais (UQO). 2002. Questionnaire sur l’tat de prsence.
http://w3.uqo.ca/cyberpsy/docs/qaires/pres/QEP vf.pdf. (2002).
[9] Timofey Y. Grechkin, T. D. Nguyen, J. M. Plumert, J. F. Cremer, and J. K. Kearney. 2010. How Does Presentation Method and Measurement Protocol Affect Distance Estimation in Real and Virtual Environments? ACM Trans. Appl. Percept. 7, 4 (2010), 26:1–26:18. DOI:https://doi.org/10.1145/1823738.1823744
[10] C. Hendrix and W. Barfield. 1995. Presence in Virtual Environments As a Function of Visual and Auditory Cues. In Proceedings of the VRAIS). 74–82.
[11] Helen H. Hu, Amy A. Gooch, Sarah H. Creem-Regehr, and William B. Thompson. 2002. Visual Cues for Perceiving Distances from Objects to Surfaces. Presence: Teleoper. Virtual Environ.11, 6 (Dec. 2002), 652–664. DOI:https://doi.org/10.1162/ 105474602321050758
[12] W. A. IJsselsteijn, H. d. Ridder, J. Freeman, S. E. Avons, and D. Bouwhuis. 2001. Effects of Stereoscopic Presentation, Image Motion, and Screen Size on Subjective and Objective Corroborative Measures of Presence. Presence 10, 3 (June 2001), 298–311. DOI:https://doi.org/10.1162/105474601300343621
[13] C. Jinjakam, Y. Odagiri, K. Dejhan, and H. Kazuhiko. 2011. Comparative Study of Virtual Sickness between a Single-screen and Three-screen from Parallax Affect. International Journal of Computer, Electrical, Automation, Control and Information Engineering5, 3 (2011), 5 – 8.
[14] A. Jones, J. E. Swan, G. Singh, and E. Kolstad. 2008. The Effects of Virtual Reality, Augmented Reality, and Motion Parallax on Egocentric Depth Perception. In IEEE Virtual Reality Conference. 267–268. DOI:https://doi.org/10.1109/VR.2008. 4480794
[15] R. S. Kennedy, J. M. Drexler, D. E. Compton, K. M. Stanney, S Lanham, and D. L. Harm. 2003. Configural Scoring of Simulator Sickness, Cybersickness and Space Adaptation Syndrome: Similarities and Differences? Virtual and Adaptive Environments: Appplications, Implications, and Human Perfoormance (2003), 247–278.
[16] A. Khanzode, M. Fischer, and D. Reed. 2007. Challenges and benefits of im-plementing virtual design and construction technologies for coordination of mechanical, electrical, and plumbing systems on large healthcare project. In Proceedings of CIB 24 th W78 Conference. 205–212.
[17] M. K. McGee. 1998. Assessing Negative Side Effects in Virtual Environments. Ph.D. Dissertation. Virginia Polytechnic Institute and State University.
[18] R. P. McMahan, D. A. Bowman, D. J. Zielinski, and R. B. Brady. 2012. Evaluating Display Fidelity and Interaction Fidelity in a Virtual Reality Game. IEEE Trans-actions on Visualization and Computer Graphics18, 4 (April 2012), 626–633. DOI: https://doi.org/10.1109/TVCG.2012.43
[19] Robert H. Miller and Robert J. Beaton. 1991. Some effects on depth-position and course-prediction judgments in 2-D and 3-D displays. Stereoscopic Displays and Applications II(1991).
[20] Ivelina V. Piryankova, Stephan de la Rosa, Uwe Kloos, Heinrich H. Blthoff, and Betty J. Mohler. 2013. Egocentric distance perception in large screen immersive displays. Displays 34, 2 (2013), 153 – 164. DOI:https://doi.org/10.1016/j.displa. 2013.01.001
[21] E. D. Ragan, R. Kopper, P. Schuchardt, and D. A. Bowman. 2013. Studying the Effects of Stereo, Head Tracking, and Field of Regard on a Small-Scale Spatial Judgment Task. IEEE Transactions on Visualization and Computer Graphics 19, 5 (May 2013), 886–896. DOI:https://doi.org/10.1109/TVCG.2012.163
[22] Adam R. Richardson and David Waller. 2007. Interaction With an Immersive Virtual Environment Corrects Users’ Distance Estimates. Human Factors 49, 3 (2007), 507–517.
[23] J. Schild, J. LaViola, and M. Masuch. 2012. Understanding User Experience in Stereoscopic 3D Games. In Proceedings of the SIGCHI Conference on Human Factors in Computing Systems. 89–98. DOI:https://doi.org/10.1145/2207676.2207690 [24] P. Willemsen, M. B. Colton, S. H. Creem-Regehr, and W. B. Thompson. 2009. The
Effects of Head-mounted Display Mechanical Properties and Field of View on Distance Judgments in Virtual Environments. ACM Trans. Appl. Percept. 6, 2 (March 2009), 8:1–8:14. DOI:https://doi.org/10.1145/1498700.1498702 [25] P. Willemsen, A. A. Gooch, W. B. Thompson, and S. H. Creem-Regehr. 2008.
Effects of Stereo Viewing Conditions on Distance Perception in Virtual Envi-ronments. Presence: Teleoper. Virtual Environ. 17, 1 (Feb. 2008), 91–101. DOI: https://doi.org/10.1162/pres.17.1.91
[26] Nevena Zikic. 2007. Evaluating Relative Impact of VR Components Screen size, Stereoscopy and Field of View on Spatial Comprehension and Presence in Architec-ture. Ph.D. Dissertation. The Pennsylvania State University, PA, USA.