HAL Id: hal-02509232
https://hal.archives-ouvertes.fr/hal-02509232v2
Preprint submitted on 27 Apr 2021
HAL is a multi-disciplinary open access
archive for the deposit and dissemination of sci-entific research documents, whether they are pub-lished or not. The documents may come from teaching and research institutions in France or abroad, or from public or private research centers.
L’archive ouverte pluridisciplinaire HAL, est destinée au dépôt et à la diffusion de documents scientifiques de niveau recherche, publiés ou non, émanant des établissements d’enseignement et de recherche français ou étrangers, des laboratoires publics ou privés.
Calibrated photoacoustic spectrometer for in vitro
characterization of contrast agents based on a standard
imaging system
Mitradeep Sarkar, Théotim Lucas, Yoann Atlas, Gilles Renault, Florence
Gazeau, Jérôme Gateau
To cite this version:
Mitradeep Sarkar, Théotim Lucas, Yoann Atlas, Gilles Renault, Florence Gazeau, et al.. Calibrated photoacoustic spectrometer for in vitro characterization of contrast agents based on a standard imaging system. 2021. �hal-02509232v2�
Calibrated photoacoustic spectrometer for in
vitro characterization of contrast agents
based on a standard imaging system
M
ITRADEEPS
ARKAR,
1T
HÉOTIML
UCAS,
2,3Y
OANNA
TLAS2, G
ILLESR
ENAULT,
4F
LORENCEG
AZEAU3ANDJ
EROMEG
ATEAU2,*1Université de Paris, Inserm, PARCC, F-75015 Paris, France
2Sorbonne Université, CNRS, INSERM, Laboratoire d’Imagerie Biomédicale, LIB, F-75006, Paris,
France
3 Matière et Systèmes Complexes, CNRS UMR 7057, Université de Paris, 45 rue des Saints-Pères,
75006 Paris, France.
4Université de Paris, Institut Cochin, INSERM, CNRS, F-75014 Paris, France
*jerome.gateau@sorbonne-universite.fr
Abstract: Photoacoustic (PA) contrast agents are usually characterized with spectrophotometry or uncalibrated PA imaging systems, leading to partial assessment of their PA efficiency. To perform calibrated PA spectroscopy with a PA imaging system, we developed a method that simultaneously corrects for the spectral energy distribution of excitation light and performs a conversion from arbitrary to spectroscopic units, using a calibration solution of cupric sulfate. The method was implemented on a standard imaging set-up based on a tunable laser operating between 680nm and 980nm and a 5MHz clinical ultrasound array. We demonstrated robust calibrated PA spectroscopy with 15μL sample volumes of known chromophores and commonly used contrast agents, and for up to 4 samples simultaneously. The detection sensitivity was evaluated to be below 0.05 cm -1 in the
range 680-930 nm. 1. Introduction
Photoacoustic imaging (PAI) is an emerging multi-wave biomedical imaging modality able to reveal functional and molecular information at centimeteric depths in biological tissues and with sub-millimeter resolution [1]. PAI is based on the photoacoustic (PA) effect: optically absorbing structures emit ultrasound waves when excited with a transient illumination. The ultrasound waves are generated by thermoelastic expansion and their amplitude is proportional to the absorbed optical energy at the excitation wavelength. Therefore, successive acquisitions of PA images at different optical wavelengths allow spectral discrimination and quantification of the various absorbers in the imaged region [2].
To enhance this hybrid imaging modality beyond the information provided by endogenous absorbers like hemoglobin, absorbing exogenous contrast agents can be injected [3]. Recently, the material science community has shown a growing interest in the development of novel PA contrast agents [4,5], resulting in a strong need for techniques able to characterize them in terms of effective PA spectra and efficiency to generate ultrasound. Spectrophotometry (SPP), based on the transmission of light by a sample, usually measures the optical attenuation: the sum of losses due to the absorption and the scattering of light. However, the latter does not contribute to PA signal generation. Moreover, SPP does not account for the photophysical and thermoelastic processes that occur during the mechanisms of optical absorption and subsequent ultrasound pressure generation.
Several PA spectrometers have already been developed. However, either they are calibrated but do not use a PAI system or they use PAI but are not calibrated. More precisely, Beard et al [6–9] developed a PA spectrometer which is able to measure the absolute optical absorption coefficient by fitting an analytic expression to the photoacoustically-generated ultrasound signal. Furthermore photoacoustic specific coefficients could be calculated with
this system : the photothermal conversion efficiency Ept, which represents the conversion
efficiency of the absorbed optical energy to heat, and the Grüneisen coefficient Γ (relative to water), which describes the conversion of the heat energy to ultrasound waves. However, this PA spectrometer requires large sample volumes (mL) and a specific ultrasound detector with a very broadband and flat frequency response to correctly resolve the ultrasound waveform [8] . Other PA spectrometers based on dedicated single-element detectors place fewer constrains related to the ultrasound frequency response of the detector, but they evaluate the optical absorption coefficient using a calibration with a known reference solution [10,11] . For these PA spectrometers, small sample volumes (3µL [11] and 200µL [10] ) are placed in optically transparent cells and SPP is performed on the same sample to concurrently measure the optical attenuation. Only one sample could be tested at a time and the cell size were not adapted to the frequency response of the detector, leading to sub-optimum detection efficiency. Commercial PAI systems [12,13] have also been proposed to measure the PA spectral response of contrast agents. However, no calibration is performed for such systems, leading to PA spectra assessment in arbitrary units. Furthermore, the sample containers were at least an order of magnitude too large with respect to the center frequency of the detectors. Therefore, they did not match the system sensitivity which could lead to a limited detectability of weakly absorbing samples and an uneven sensitivity to the illuminated sample with an enhancement of the edges as compared to the core of the sample volume.
We have developed and we present herein a calibration method to transform a standard multispectral PAI system into a calibrated PA spectrometer for in vitro characterization of PA contrast agents. We implemented the method in a standard configuration for PAI [14,15] using a clinical linear ultrasound detector array with light delivered from the side. The method uses a calibration solution. For PA contrast agent characterization, small sample volumes (15µL) were injected in tubes whose diameter was chosen such that the ultrasound emission matches the frequency bandwidth of the detector. We demonstrate that our simple experimental setup enables robust calibrated spectroscopic measurement of several samples in parallel.
2. Materials and methods
2.1 Experimental set-up and data acquisition
The experimental setup is presented in Fig. 1(a). It is comprised of a sample compartment and a standard multispectral PAI system. The sample compartment consists of 50-cm long polytetrafluoroethylene (PTFE) tubes (inner diameter: 0.2mm, wall thickness: 0.1mm, Bola, Germany). PTFE (Teflon) is hydrophobic and chemically inert, therefore PTFE tubes are well adapted to contain aqueous solution of PA contrast agents. Moreover, PTFE was shown to have a weak optical absorption in the near infrared (NIR) [16] to avoid strong background PA signal. The tubes were threaded through holes of two parallel perforated plates located 8 cm apart. The tubes were arranged to be parallel one to the other and were positioned at distance of at least 4 mm from each other to ensure independent measurements. Up to four tubes were positioned in the sample holder to perform simultaneous data acquisition (Fig. 1(c)). The tubes were immersed in a water tank (tap water) at room temperature to ensure acoustic coupling between the samples and the ultrasound detector of the PAI system. The two ends of each tube were kept out of the water tank to inject and collect the measured samples, respectively. The inner volume of each tube was 15µL, and the tubes were filled using a 33-gauge needle and a 50µL gas-tight syringe (Hamilton).
Fig. 1 Experimental setup (a) Annotated picture of the PAI system and schematic drawing of the experimental setup. The imaging plane of the array is perpendicular to the picture plane and perpendicular to the tubes. (b) Experimental and theoretical frequency spectra of the PA
generated ultrasound signal. The experimental ultrasound spectra was acquired with the calibration solution at 710 nm. The theoretical spectrum corresponds to equation (1).The spectra are normalized to their maximum values. (c) Image of 4 tubes filled with the
calibration solution.
The PAI system was assembled from several different components. First, a tunable (680-980 nm) optical parametric oscillator laser (SpitLight 600 OPO, Innolas, Germany) delivering < 8 ns pulses with a pulse repetition frequency of 20 Hz was used to generate the optical excitation. Ultrasound was detected with a 128-element clinical linear array (L7-4, 5MHz center frequency, bandwidth 4-7 MHz, ATL) driven by a programmable ultrasound machine used in receive-only mode (Vantage, Verasonics, WA, USA). A bifurcated fiber bundle (CeramOptec GmbH, Germany) guided the light toward the elevation acoustic focus of the ultrasound array and delivered light over the entire length of the array. The mean fluence at the acoustic focus was 3.5 mJ.cm-2 at 730 nm (wavelength at which the laser has the
maximum pulse energy). The tubes containing the samples were placed perpendicularly to the imaging plane of the ultrasound detector and near the acoustic focus (located at 25mm from the surface of the detector). Therefore, the intersection of the imaging plane with each tube was a disk. The illuminated length (perpendicular to the imaging plane) was around 1.5 cm.
For the acquisition sequence, each laser pulse triggered 1) an ultrasound acquisition in parallel on all the elements of the detector array and 2) a recording of the pulse energy using a pyrometer incorporated in the laser. The incorporated pyrometer was not calibrated but it was verified, using an external calibrated pyroelectric energy meter (PE50BF-DIFH-C, Ophir Photonics), that the delivered electric signal was proportional to the pulse energy for each laser pulse at a given wavelength. A thermometer (HI98509, Hanna instruments, France) was used to monitor the temperature of the water bath with a precision of ±0,2 °C. This temperature measurement was necessary to estimate the speed of sound in the water bath [17] which is needed for PA image reconstruction from the ultrasound signals.
For a spectroscopic acquisition, measurements were performed successively at different optical wavelengths (λ) over the entire tunable spectral range of the laser and at an acquisition rate of 20 Hz. The per-pulse tunability of the laser was used. The acquisition sequence consisted in recording the ultrasound signals and the corresponding pyrometer values for 15 successive sweeps of 30 wavelengths between 680 nm to 970 nm with a step of 10 nm, for a total of 30*15 = 450 laser pulses. This swept sequence avoids consecutive excitation at a given wavelength that could induce photodegradation. Any potential changes in the PA spectra of the sample during the acquisition sequence can be detected as the entire spectral
range is covered 15 times consecutively. For all samples reported in this paper, the spectra were found to be stable during the experimental sequences. Therefore, iterations at a given wavelength were averaged to increase the signal-to-noise ratio. Before averaging, ultrasound signal amplitudes were corrected for the pulse-to-pulse energy fluctuations of the laser. Since at each wavelength the pyrometer value was found to vary linearly with respect to the pulse energy, ultrasound signal amplitudes were simply divided by the corresponding pyrometer value.
For measurements with a spectrophotometer (SPP), a baseline correction is performed using a “blank” measurement obtained by filling the sample compartment with the solvent. In a similar manner, for our PA spectrometer, a “blank” dataset was acquired with the tubes filled with deionized water (or the solvent when available). For baseline correction and suppression of the background signal of the tubes, the “blank” dataset was coherently subtracted from the averaged signals of the tube filled with the sample (subtraction of the radio-frequency signals). Thereby, the effective signals from the contrast-agent sample were isolated. During a series of measurements, “blank” datasets were recorded on a regular basis (between two different samples) to ensure an accurate correction and, at the same time, to verify that the tube was not polluted by a sample (comparison with a previous “blank” dataset to check for sample-induced persistent absorption). In Fig. 1(b), the solid black curve presents the ultrasound spectrum for the baseline-corrected signal of one tube. For an optically thin and infinitely long cylinder of water surrounded by water, the PA generated ultrasound waves captured in the far-field are expected to have an acoustic spectrum which has a magnitude proportional to [18] :
p(f )∝
J
1(2
π
a
v
s waterf )
√
f
(1)Where f is the ultrasound frequency, J1 is the first order Bessel function,
a
is the radiusof the cylinder and vswateris the speed of sound of water. For an inner radius of the tube
a
=100µm and vswater =1500 m.s-1, the first and highest peak of this emission spectrum has a
bandwidth at half maximum amplitude between 0.5 MHz and 6.8 MHz and a maximum emission frequency around 3.2 MHz. The theoretical spectrum covers the bandwidth of the detector given by the clinical array manufacturer for pulse-echo ultrasound imaging: 4 - 7 MHz. The experimental PA ultrasound spectrum results from the convolution of the ultrasound signal from the finite illuminated portion of the tube with the electric and spatial impulse response of the detector array element. The experimental spectrum has a peak frequency around 5 MHz with a shoulder around 2.5 MHz (Fig. 1(b)). The overlap between the theoretical and experimental spectra demonstrates that the sample container was well chosen with regards to the detector specifications.
Following the baseline correction with the “blank” dataset, the Hilbert transform of the corrected signals was computed to obtain quadrature signals. The in-phase signals and quadrature signals were beamformed independently using a simple delay-and-sum image reconstruction algorithm to yield two images. Then, an envelope-detected image was computed from the root-mean square of the two images for each pixel. The envelope-detected image of a sample injected in four tubes is presented in Fig.1(c). Each tube appeared as a Gaussian spot, and its amplitude APA (λ) determined using a 2D Gaussian fit. APA (λ) depends
on the tube, the sample and the optical wavelength λ.
2.2 Sample preparation
2.2.1 Calibration solution
To obtain calibrated measurements of the PA spectrum from APA (λ), we use a calibration
reagent, ≥98.0%, Sigma-Aldrich). A solution at a concentration of 250 mM was prepared at room temperature by adding 3.12 g of crystals in a 50 mL volumetric glass flask. The flask was gradually filled with deionized water (resistivity <18MΩ) to dissolve the crystals and obtain an accurate concentration. The decadic attenuation coefficient µSPP(λ) of the solution
was evaluated with SPP in transmission mode using the absorbance measurement.
Absorbance
(λ
)=
μ
SPP(λ
)⋅
L
(2)Where L =1 cm is the length of the SPP cuvette. Since, the calibration solution did not scatter in the investigated spectral range: 680-970 nm [9] , µSPP(λ) is equal to the decadic optical
absorption coefficient µa(λ). Fig. 2(a) displays the absorption spectrum µa(λ) measured with a
UV-Vis-NIR spectrophotometer (Cary 6000i, Varian, USA).
CuSO4,5H2O was chosen as a calibration solution for several reasons. First, it absorbs
over the entire investigated spectral range of 680-970 nm. Although the absorption spectrum is not flat, the coefficient of variation (ratio of the standard deviation to the mean, CV(std)) of µa is only 18 % over the range 680-970 nm. For comparison, the CV(std) of NiSO4,6H2O
(also used, see 2.2.2) is 71 % over the same spectral range. Second, the cupric sulfate pentahydrate solution has already been used as a model medium in PAI [9,19]. Compared to India ink, used elsewhere as a reference solution [10] , CuSO4,5H2O is a molecular absorber
of small molecular weight, and not a particle-based absorber, so the heat transfer to the solvent is direct and the solution is homogeneous (no sedimentation) even for volumes as small as 15µL. Its photothermal conversion efficiency Ep is equal to 1, meaning that the
molecular absorber transfers all the optical energy absorbed by the solution into heat. Finally, CuSO4,5H2O is an inorganic compound that is both chemically stable and also photostable
(no photobleaching or ground-state depletion) over time. 2.2.2 Concentrations of sulfate solution
To study the linearity and the sensitivity of the proposed PA spectrometer, we prepared 11 concentrations of cupric sulfate pentahydrate, in addition to the calibration solution: 6, 12, 30, 59, 92, 121, 178, 236, 301, 451, 601 mM. Their decadic absorption coefficients at 810 nm (the absorption peak) ranged from 0.074 cm-1 to 7.23 cm-1. A molar absorptivity of 12.0 M -1.cm-1 was determined, which is in agreement with the value from the literature [20] .
Solutions of nickel sulfate hexahydrate (NiSO4,6H2O, Sigma-Aldrich) were prepared to
validate the calibration with another stable solution that has also been reported previously for PAI [9]. We prepared 10 concentrations: 53, 92, 192, 282, 376, 564, 756, 948, 1425 and 1902 mM. Their decadic absorption coefficient at 720 nm (the absorption peak) ranged from 0.11 to 4.1 cm-1 with a molar absorptivity of 2.2 M-1.cm-1. The minimum decadic coefficient was
0.015 cm-1 at 890 nm. A solution of CuSO
4,5H2O at 119 mM and NiSO4,6H2O at 775 mM
was prepared to obtain a third know absorption spectrum. This solution is named mix-SO4.
All the absorption spectra of these non-scattering solutions were measured with SPP (Cary 6000i, Varian, USA) over the wavelength range: 680-980 nm. Baseline correction for the SPP was obtained with deionized water. For the PAI measurement, deionized water was used for the corresponding “blank” datasets.
2.2.3 Commonly used PA contrast agents
The PA spectrometer was tested on two different PA contrast agents based on nanoparticles and dyes, respectively. First, a commercial dispersion of citrate capped gold nanorods (GNR) in water (10±2 nm diameter, 42±8 nm length, concentration 35µg/mol, Sigma-Aldrich) with a nominal maximum extinction at 808 nm was injected in the tubes. Because the solution of nanoparticles scatters optical energy, its absorption spectrum µa could not be measured
directly with our transmission-mode SPP system [11]. However, the attenuation coefficient µSPP(λ) was evaluated with SPP (V650, Jasco, Germany) in the wavelength range: 680-900
nm. Baseline correction was performed with deionized water. For the PAI measurement, deionized water was also used for the corresponding “blank” datasets.
For the dye agent, solutions of indocyanine green (ICG, pharmaceutical primary standard, Sigma-Aldrich) at different concentrations were prepared. First, 7.4 mg of powder was dissolved in 1.5 mL of dimethyl sulfoxide (DMSO) to obtain a stock solution at a concentration of 6.4 mM. This stock solution was diluted to obtain 5 concentrations of ICG: 5.5, 7, 9, 12 and 15 µM, each in 25mL of solvent. The final solvent composition was 98.9% Dulbecco’s Phosphate Buffered Saline (concentrated x1 DPBS, Gibco), 1% DMSO and 0.1% Tween 20 (Sigma-Aldrich). Tween 20 is a non-ionic surfactant that forms micelles and stabilizes the dye [21] . Additionally, a solution at 7µM of ICG was prepared in a solvent without Tween 20. Since, ICG is known to be unstable in aqueous solutions and photosensitive, the solutions were stored in amber glass vials and measured with the PAI system within 1-hour after their preparation. In parallel to the PAI measurements, the decadic absorption coefficients of the solutions µa(λ) were measured by SPP (V650) in the
wavelength range: 680-900 nm. The scattering of the solution was negligible in the spectral range of interest. Baseline correction was obtained with the solvent. The solvent was also used for the PAI “blank” datasets.
2.3. Calibration of the PA spectrometer
2.3.1 Theoretical relationship between PA pressure rise and µa
For the laser pulse width and the dimension of the tube used here, the thermal and stress confinement regimes are satisfied [22] . Therefore, the thermal expansion of the sample inside the tube is expected to cause a pressure rise p0 proportional to the decadic absorption
coefficient µa(λ) of the sample:
p
0=Φ
(λ
)⋅Γ
water⋅
η
sample(λ
)⋅
μ
a(λ
) (3)where
Φ
(
λ
)
is the local light fluence at the tube location for the wavelength λ, and Γwater is the Grüneisen coefficient of water. ηsample is the dimensionless photoacousticgeneration efficiency of the sample. It corresponds to the efficiency of the PA pressure generation compared to a sample for which the absorbed energy is fully converted into pressure in a medium with the Grüneisen coefficient of the water. According to the conventional photoacoustic theory, ηsample can be expressed as:
η
sample(
λ
)
=
E
pt , sample(
λ
)
⋅Γ
sample/ Γ
water (4)with Ept,sample and Γsample the photothermal conversion efficiency and the Grüneisen coefficient
of the sample solution, respectively.
The photothermal conversion efficiency Ept,sample is the ratio of the energy effectively
converted into thermal increase of the solution (and subsequently to production of ultrasound waves) to the total absorbed optical energy. Ept,sample may be inferior to 1, due to various
competitive pathways [7] . For molecular absorbers, fluorescence and other energy transfer mechanisms [10] can attenuate the conversion efficiency. Because of their fluorescence, it is expected that Ept,ICG of ICG samples is inferior to 1 and that it displays a spectral dependency.
For plasmonic nanoparticles, thermal transfer and thermal resistance from the absorbers to the solvent may lower the photothermal conversion efficiency [23], and Ept,GNR could be inferior
to 1. However, for solutions of CuSO4,5H2O and NiSO4,6H2O, we assume that Ept =1 for all
the wavelengths in the range 680 to 980 nm since this has previously been reported for aqueous solutions of copper (II) chloride and nickel (II) chloride [7].
A realistic value for the Grüneisen coefficient of water taken from the literature is Γwater =
of the aqueous solution. For solutions of CuSO4,5H2O and/or NiSO4,6H2O, Fonseca et al [9]
determined that Γsample can be expressed as:
Γ
sample=Γ
water⋅
(
1+
β
CuSO 4⋅
c
CuSO 4+
β
NiSO 4⋅
c
NiSO 4)
(5) where cCuSO4 and cNiSO4 are the molar concentrations of CuSO4,5H2O and NiSO4,6H2O,respectively. βCuSO4F = 0.708 M-1 and βNiSO4F = 0.325 M-1 were experimentally determined [9].
2.3.2 Calibration with a reference solution
The ultrasound signal generated from the localized pressure rise is proportional to p0, and the
image reconstruction process used here is linear. Therefore, the amplitude APA (λ) computed
from the image is proportional to µa(λ) for a tube filled with a given sample according to :
A
PA(λ
)=
α
tube(λ
)⋅
η
sample(
λ
)
⋅
μ
a(
λ
)
(6)where αtube(λ) is a wavelength-dependent factor that ensures the conversion between the
arbitrary units of APA and the spectroscopic units of µ
a(λ). This factor is evaluated for each
tube separately due to the spatial heterogeneity of both the illumination and the ultrasound detection. αtube(λ) also accounts for the spectral energy distribution of the laser, the pyrometer
spectral sensitivity and the optical attenuation between the laser output and the tube.
The calibration process consisted in assessing αtube(λ) using the calibration solution for
which µa(λ) and ηcalibration have been predetermined:
α
tube(
λ
)
=
A
calibrationPA(
λ
)
/(
η
calibration⋅
μ
calibrationa (λ
))
(7)Fig. 2(b) presents the ratio APA
calibration (λ) / µacalibration(λ) for the four tubes presented in Fig.
1(c) filled with the calibration solution. One can note that the ratio and as a consequence αtube(λ) are indeed dependent on the tube position and the illumination wavelength.
The calibrated PA spectrum of a sample (equivalent to the decadic absorption coefficient) assuming ηsample =1is expressed as:
θ
PA(λ
)=
A
PA(λ
)/
α
tube(λ
) (8)The photoacoustic generation efficiency ηsample is then determined from θPA(λ) and µa(λ),
when available, considering:
θ
PA(λ
)=
η
sample(
λ
)
⋅
μ
a(λ
) (9)Fig. 2 Experimental spectra with the calibration solution of CuSO4, 5H2O. (a) PA amplitudes
APA derived from the image for the four different tubes (left) axis and the decadic absorption coefficient µa measured with the spectrophotometer (right axis). (b) Ratios of APA over µ
a for
2.3.3 Determination of ηcalibration
Fonseca et al [9] have found that the photoacoustic generation efficiency ηCuSO4 of the
calibration solution of CuSO4,5H2O used for these measurements is wavelength independent
in the range 740 nm to 1100 nm and can be determined by:
η
calibration=
(
1+
β
CuSO 4⋅
c
CuSO 4calibration)
(10)with βCuSO4F = 0.708 M-1. We first used this calculated value of ηcalibration to perform a
calibration according to equation (7) and we computed (equation (9)) the photoacoustic generation efficiency of two sample solutions: NiSO4,6H2O at cNiSO4 = 1.4 M and the solution
mix-SO4. The expected photoacoustic generation efficiency could be computed from equation
(5) with βNiSO4F and βCuSO4F. However, our experimental estimates of ηsample were overestimated
by almost 20% with respect to these expected value. The empirical formula of equation (5) was validated for both sulfate [9] and chloride aqueous compounds [6] . However, we decided to perform our own determination of the parameters βCuSO4 and βNiSO4 to resolve the issue of the
overestimation of ηsample.
Without prior knowledge of ηcalibration, the following quantity was computed for samples
comprised of sulfate solutions:
ξ
PA(λ
)=
A
PA(λ
)⋅
μ
a calibration (λ
)A
PA ,calibration (λ
)=
θ
PA(
λ
)
η
calibration=
η
sampleη
calibration⋅
μ
a(
λ
)
(11)For the sake of clarity, the notations of the different computed quantities are summarized in Fig. 3.
The absorption coefficients of CuSO4,5H2O and NiSO4,6H2O depend linearly on the
relative concentrations. Therefore, for a given concentration cs with s={CuSO4; NiSO4} :
ξ
PA(
λ
, c
s)
=Σ
s⋅
(
1+
β
s⋅
c
s)
⋅
c
s⋅
μ
areference ,s
(
λ
) (12)where µareference,s(λ) is the absorption coefficient of a reference solution of compound s and
Σs = 1/(ηcalibration · csreference) is a constant factor.
To determine βs , the following procedure was used. First, we computed the quantity
ξPA(λ)/c
s for different concentrations cs. For each concentration, we evaluated the fitting factor
to a chosen reference absorption spectrum µareference,s(λ). A linear regression was then applied
to the fitting factors to obtain βs . Following the determination of βCuSO4, ηcalibration was
computed from equation (10).
2.4 Statistical evaluations
Measurement errors were evaluated on each series of measurements of the same sample. Typically 3 acquisitions in 3 to 4 tubes were performed to reach 9 to 12 measurements of the PA spectrum per sample. Between two acquisitions, the tubes were flushed with air before being injected again with 15µL of the sample. Between two different samples, the tubes were flushed with air and the solvent to clean them and again with air to avoid dilution of the next sample. A “blank” dataset was acquired between two different samples when the tubes were filled with the solvent.
For the calibration solution, the expected values are known. Therefore, we computed the coefficient of variation of the root-mean-square error:
CV
RSME(
ξ
PA,
μ
a)=
1
μ
a⋅
√
1
n
∑
i=1 n(
ξ
iPA−
μ
a)
2 (13)where n is the number of measurements. For the other solutions, we computed the mean and the standard deviation.
Each series of measurements started and ended with two acquisitions with the calibration solution. The median value of APA
calibration (λ) over the four acquisitions was used to compute
αtube(λ) for each tube.
Fig. 3 Diagram summarizing the computed quantities and their relationship to the measurements performed with the calibration solution and the sample solution.
3. Results
3.1 Measurement repeatability
The measurement repeatability was evaluated with the calibration solution because measurements with this solution are crucial for the reliability of the calibration process. Different experimental conditions were simultaneously tested in a series of 10 acquisitions. In tube 1 (Fig. 1(c)), the calibration solution was injected before the first acquisition and left untouched for the whole series to assess the intrinsic measurement fluctuations of the system. For tube 2, 50µl of the calibration solution was injected before each acquisition (without flushing with water and air) to measure the variations due to the injection process. Tube 3 was flushed with air and the calibration solution was injected between each acquisition. Flushing with air prevented the mixing of samples corresponding to two successive acquisitions. Finally, tube 4 was cleaned with water and air, and the calibration solution was injected between successive acquisitions.
For each tube, APA
calibration(λ) was computed by assessing the median over the values in the
series for each wavelength λ. Then, ξPA
i (λ) was computed from equation (11) for each
acquisition i (Fig. 3). The coefficient of variation of the root-mean-square error was calculated for each tube and each wavelength according to equation (13), and is displayed on Fig. 4(a). Additionally, each spectrum ξPA
proportionality. The fitting factor γi has an expected value of 1. The coefficient of variation of
the root-mean-square error of γi for each tube is shown in Fig. 4(b).
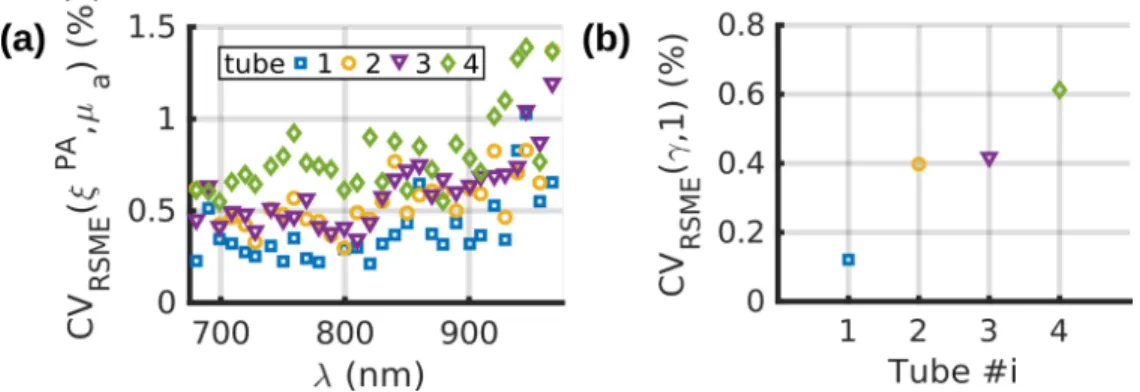
Fig. 4 Repeatability of the measurements evaluated with 10 acquisitions of the calibration solution of CuSO4, 5H2O. Different experimental conditions were applied between two
successive acquisitions for the 4 tubes. Tube 1: the solution was injected once and left in the tube. Tube 2: the solution was re-injected. Tube 3: the tube was flushed with air and the solution was re-injected. Tube 4: the tube was flushed with air and water and the solution was
re-injected. (a) Coefficient of variation of the root-mean-square error of ξPA vs. the optical
wavelength λ for each tube. (b) Coefficient variation of the root-mean-square error for the fitting factor.
The coefficients of variation for ξPA(λ)are below 1.5% for all the wavelength and the
tubes, while the coefficients of variation for the fitting factor γ are below 0.7%, which demonstrates an excellent repeatability of the measurement. The main source of fluctuations is the injection of the solution. Flushing with air results in similar fluctuations as re-injecting without flushing. However, the injection with cleaning (tube 4) had the strongest variation. This variation could be attributed to droplets of the solvents which may stay in the tube (or the needle) and could result in dilution of the injected solution. The fluctuations in concentration between tested samples was evaluated by the coefficient of variation for the entire spectrum (Fig. 4(b)). This coefficient of variation was however lower than the coefficient of variation for individual wavelengths (Fig. 4(a)), which suggests additional sources of fluctuations at each wavelength. For all tubes, the coefficient of variation is stable over the wavelength range 680-930 nm and increases in the range 930 - 970 nm. This increase could be attributed to the lower laser fluence at the tube location above 930 nm. Indeed, the absorption of the laser radiation by the water between the fiber output and the sample is stronger above 930 nm [25]. Consequently, the ratio APA
calibration/µacalibration is smaller (Fig. 2 (b))
resulting in an amplification of the errors in the estimation of ξPA
i(λ) for λ>930nm. 3.2 Photoacoustic generation efficiency of the sulfate solutions
For each of the 11 concentrations of CuSO4, 5H2O, 12 measurements were performed and ξPAi
(λ, cCuSo4) was computed from equation (11) (Fig. 3). Similarly, ξPAi(λ, cNiSo4) was computed
for 8 measurements for each of the 10 concentrations of NiSO4. ξPAi(λ) was also evaluated for
the solution mix-SO4 and deionized water for 10 and 40 measurements, respectively. Fig. 5(a-d) presents the mean values of ξPA(λ) for each compound and each concentration with the
error bars corresponding to ± one standard deviation. The amplitude of the mean spectra ξPA(λ) for the different concentrations ranged over two orders of magnitude and hence were
displayed in four sub-figures to ensure legibility. Each spectra ξPA(λ) was fit with a reference
absorption spectra µareference(λ) assuming a direct proportionality for each type of sulfate
solution (dashed lines). For ξPA(λ) > 0.1 cm-1, the spectral shape of ξPA(λ) matched with the
reference absorption spectra for all the tested sulfate solutions and concentrations (Fig. 5(a-c)). For NiSO4,6H2O, the shape match holds even if the absorption drops by nearly 90 % from
0.1 cm-1, the fits are degraded for λ > 930 nm and the standard deviation increases (Fig. 5(d)).
From the absorption spectra, the sensitivity was determined to be of the order of 0.04 cm-1 in
the range 680 to 930 nm, and 0.15 cm-1 in the range 930 to 970 nm.
Fig. 5 (a-d) Experimental PA spectra ξPA of the solutions of CuSO
4,5H2O for 11 different
concentrations and NiSO4,6H2O for 10 different concentrations. As the amplitudes for different
concentrations ranged over two orders of magnitude, the curves are displayed in 4 sub-figures with different scales for the ordinate axes. The solution of mix-SO4 is shown in (b) and
deionized water is shown in (d). The displayed values are the mean of all the measurements for a given compound and the error bars represent ± one standard deviation. For each PA spectrum ξPA,, a fit optical absorption spectrum is displayed with dashed lines. (e) Proportionality factor
Σ*ηCuSo4 between ξPAi(λ, cCuSo4) / cCuSo4 and µacalibration as a function of the concentration of
CuSO4,5H2O cCuSo4. Two series of measurements are displayed with dark and light blue,
respectively. The equation of the linear regression is displayed (R2 = 0.95). (f) Proportionality
factor ηCuSo4 between θPAi(λ, cCuSo4) and µa(λ, cCuSo4) as a function of cCuSo4. The equation of the
linear regression is displayed (R2 = 0.95) as well as the linear function expected from equation
(5) with βCuSO4F . (g) Proportionality factor ηNiSo4 between θPAi(λ, cNiSo4) and µa(λ, cNiSo4) as a
function of cNiSo4. Two series of measurements are displayed with dark and light green,
respectively. The equation of the linear regression is displayed (R2 = 0.99) as well as the linear
function expected from equation (5) with βNiSO4F.
For the solutions of CuSO4 , the spectra ξPAi(λ, cCuSo4) / cCuSo4 were fitted to the spectrum
µacalibration for each measurement assuming a direct proportionality as in equation (12). The
direct proportionality is validated by the good match shown in Fig. 5(a-d). Fig. 5(e) displays the fitting factor as a function of the concentration for two series of measurements. The series were performed several weeks apart and with a water tank at 25.9 ± 0.3 °C and 22.8 ± 0.3 °C, respectively. The results of the two series matched and they were mixed for a better assessment of βCuSO4 . As expected from (12), the proportionality factor was found to be linear
with the concentration. A linear regression was used to determine the factors ΣCuSO4=3.56 and
βCuSO4 = 0.55 M-1 (coefficient of determination R2 = 0.95). The determined βCuSO4 was then
used to compute ηcalibration=1.14 with equation (10) and subsequently obtain the spectra θPAi(λ,
proportionality, we obtained ηcuSO4 from equation (9). Fig. 5(f) shows ηcuSO4 as a function of
cCuSo4. As expected from equation (5), we found that ηcuSO4 can be modeled as a linear function
with an initial value of 1.0 and a slope βCuSO4 = 0.55 M-1. The linear curve with the slope
βCuSO4F= 0.708 M-1 determined by Fonseca et al [9] did not match with any of our series of
measurements (Fig. 5(f)).
For the solutions of NiSO4 , the spectra θPAi(λ, cNiSo4) were computed with our evaluated
value of ηcalibration. Fig. 5(g) displays the photoacoustic generation efficiency ηNiSO4, obtained by
fitting θPA
i(λ, cNiSo4) to µa(λ, cNiSo4) assuming a direct proportionality, as a function of cNiSo4.
With a linear regression, the measured values were fitted with ηNiSO4 = 0.96 · (1 + 0.57· cNiSo4)
(coefficient of determination R2 = 0.99). We deduce that β
NiSO4 = 0.57 M-1. The same
coefficient βNiSO4 was found by fitting ξPAi (λ, cNiSo4)/ cNiSo4 with a reference absorption
spectrum measured for cNiSo4= 1425 mM. Therefore, the measured βNiSO4 is independent of ηcalibration . Additionally, the results were found to match for the two different series of
measurements. However, as for CuSO4, our measurements did not match with the coefficient
determined by Fonseca et al [9] βNiSO4F= 0.325 M-1. Interestingly, our value of βNiSO4 is larger
than βNiSO4Fwhile βCuSO4 was lower than βCuSO4F. Our values of βCuSO4 and βNiSO4 were found to be
more similar to each other. The discrepancy between the coefficients determined by Fonseca
et al and ours are further discussed in section 4, in terms of the differences between the
experimental methods.
For the solution of MixSO4, we determined that ηmixSO4 = 1.50 by fitting the mean θPA(λ)
by µa(λ). Using our coefficients βCuSO4 and βNiSO4, the calculated value overestimated ηmixSO4 by
0.4 %, while with, βCuSO4F and βNiSO4F, the calculated ηmixSO4 was underestimated by 11%.
3.3 Characterization of conventional PA contrast agents
3.3.1 Gold nanorods
Fig. 6 (a) Experimental spectra with the solution of gold nanorods. PA spectrum (mean ± std) θPA(λ) (left
axis), and the decadic attenuation coefficient µSPP(λ) (right axis) are displayed with the same scale. The
decadic attenuation coefficient shifted by λs = 10 nm was also displayed. (b) Ratio between θPA and the
shifted decadic attenuation coefficient as a function of the optical wavenlength.
Fig. 6(a) displays the PA spectra θPA(λ) for the solution of gold nanorods (GNR) and the
decadic attenuation coefficient µSPP(λ) measured by SPP in the range 680-900 nm. Both
spectra had a similar spectral shape: a broad peak centered around 800 nm and a full-width at half maximum of ~ 130 nm. However, the PA peak had a blue shift of λs = 10 nm as
compared to the SPP peak, and the amplitude of θPA(λ) was globally 25% lower than µSPP(λ+
λs) (proportionality factor for the best fit). Fig. 6(b) presents the ratio θPA(λ) over µSPP(λ+ λs). It
can be noticed that this ratio is not the photoacoustic generation efficiency because the attenuation coefficient µSPP comprises both the absorption and the scattering coefficients. The
ratio is lower at the peak of θPA(λ) but is not inversely proportional to θPA(λ). The lower value
of θPA compared to µSPP could be explained by the combination of two phenomena. First, the
overestimation of µSPP as compared to µ
a. For the geometrical characteristics of the GNR used
here, the shapes of the absorption and scattering spectra are expected to match (but could be slightly shifted) and the ratio between the scattering and the absorption coefficients could be on the order of 10% [26]. The spectral dependency of the ratio θPA(λ) over µSPP(λ+ λ
s) and its
minimum close to the expected plasmon resonance coincide with scattering, but the measured values of the ratio are lower than 90 % and an additional phenomenon could then be combined. Indeed, the GNR is the photothermal converter (heat source) while water is the PA signal-generating medium. Interfacial thermal resistance to the heat transfer at the gold-water interface could lower the effective photothermal conversion efficiency [23,27] and then reduce the value of θPA. However, the influence of the interfacial thermal resistance on the PA
signal is not yet settled at one wavelength (peak absorption) [28] and by extension its spectral dependency is not yet established.
3.3.2 Indocyanine Green
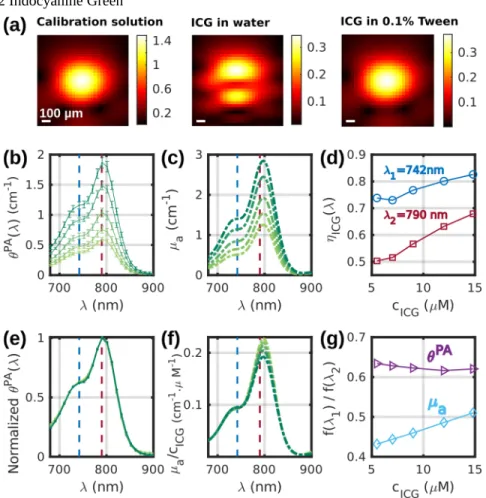
Fig. 7 (a) PA images at 790 nm of a tube filled successively with: (left) the calibration solution, (middle) a solution of indocyanine green (ICG) in DPBS with 1% DMSO, (right) a solution of ICG in DPBS with 1% DMSO and 0.1% Tween 20. The color scales are in arbitrary units. (b) PA spectra θPA (mean ± std)
and (c) the corresponding µa spectra for the different concentrations of ICG. (d) Photoacoustic generation
efficiency evaluated at two wavelengths λ1=742nm and λ2=790nm as a function of the concentration of
ICG. (e) Mean PA spectra of (b) normalized to their maximum value. (f) µa spectra of (c) normalized by
concentration in ICG. .For (b-f), the color of the curves change from light green to dark green with increasing concentration. (g) Ratios θPA(λ
1)/θPA(λ2) and µa(λ1)/µa(λ2) as a function of the concentration of
Fig. 7(a) displays images at λ2=790 nm of a tube filled with (from left to right): the calibration
solution, ICG in an aqueous solution without Tween and ICG stabilized in micelles using 0.1% of Tween. For the calibration solution and the ICG with Tween, the images of the tube are similar: one spot with the same center and the same width. Therefore, we can assume that the calibration and the sample measurements match. However, for the ICG in an aqueous solution without Tween, the image of the tube has two spots along the depth dimension. The position of the dip between the two spots corresponds to the maximum of the single spot for the other solutions, and its width is of the order of 0.2 mm. Therefore, we can assume that each spot corresponds a portion of the wall of the tube. Only the portions parallel to the array are visible because of the limited-view of the detection geometry. Because of its affinity with hydrophobic surfaces, ICG did not stay in the aqueous solution and stuck to the wall of the PTFE tube when Tween was not added. The calibration cannot be used for quantitative measurements when two spots appear because the amplitude APA does not correspond to the
same experimental conditions. These results indicate that surfactants or other compounds are needed to keep hydrophobic absorbers in solution for quantitative accuracy of the measurements. All the other measurements with ICG were performed in a solution comprising of 0.1% of Tween 20.
Fig. 7(b-c) display the spectra θPA(λ) and µ
a(λ), respectively, for 5 concentrations of ICG
and in the range 680- 900nm. The absorption of ICG above 900 nm is negligible and was not displayed for better legibility. As for the solutions of ICG, the scattering could be neglected, µa(λ) was measured with SPP. The PA and optical spectra have a peak around λ2 = 790 nm
and a shoulder around λ1=742nm. The photoacoustic generation efficiency ηICG depends on
both the wavelength and the concentration of ICG. Here the solvent is composed of DPBS with 1% DMSO, therefore the Grüneisen coefficient of the solvent is expected to be slightly larger than Γwater. However, given its low concentration, ICG is not expected to influence the
Grüneisen coefficient of the solution contrary to the sulfate salts. Yet, the optical properties of ICG can vary with the concentration [10]. At λ1 and λ2, it can be seen that ηICG increases with
the concentration. The slope is larger at λ2, but the ηICG values are larger at λ1 than at λ2 (Fig.
7(d)). In a similar solvent but without Tween, Fuenzalida Werner et al [10] determined that
ηICG(λ1) ≈ 0.80 and ηICG(λ2) ≈ 0.62 at concentrations below 10µM. These results are consistent
with our measurements at cICG= 12µM.
Fig. 7(f) displays the spectra µa(λ) normalized by the ICG concentration. The amplitude of
the shoulder at λ1 was found to be linear with the concentration with a slope of 1, whereas the
peak at λ2 is proportionally larger at lower concentrations. The ratio µa(λ1)/µa(λ2) increases
with cICG (Fig. 7(g)). This increase could be attributed to the decrease of µa(λ2)/cICG (Fig. 7(f))
caused bythe aggregation of ICG at higher concentration [10]. Interestingly, however, the ratio θPA(λ
1)/θPA(λ2) was found to be constant, suggesting a stability of the heat transfer from
the molecule to the solvent regardless of the concentration and, by extension, of the aggregation state. Fig. 7(e) shows that the spectral shape of θPA(λ,c
ICG) does not depend on the
concentration of ICG. This stability of the spectral shape was not observed in water without Tween [10], probably because of a stronger aggregation of ICG molecules when they are not in micelles of Tween. The normalization factor used for θPA(λ,c
ICG) is however not directly 1/
cICG as for µa(λ), but it is proportional to 1 / (ηICG(λ1,cICG) * cICG). Therefore, the PA
signal-generation increases non-linearly with cICG. The aggregation of ICG is expected to decrease
the fluorescence efficiency, a competitive process to PA, and therefore benefits PA generation at higher concentration, which is seen by the increase of ηICG (Fig. 7(d)).
4. Discussion
We presented and validated a method to perform calibrated photoacoustic spectrometry in the wavelength range 680- to 970-nm with a commonly used PAI set-up. The method requires tubes that remain fixed during successive injections of: water or a solvent as a background reference, a solution of CuSO4, 5H2O as a calibration solution, and the sample of interest. The
simple calibration process provides PA spectra in spectroscopic units that can be related to the optical attenuation spectra (SPP), both in terms of shape and amplitude. The ratio between the PA spectrum θPA and the optical absorption spectrum µ
a yields the photoacoustic generation
efficiency of the sample. Even if the absorption spectrum is not available for some samples, for instance, because of strong scattering, the PA spectra expressed in SI unit can be compared to other samples,. Even if the other samples were assessed using other PAI systems.
The calibration method can be adapted to various PAI systems, as long as they provide access to the PA generated ultrasound signals or the beamformed images prior to envelope detection (to allow coherent subtraction of the background) and the pulse-energy fluctuations of the excitation light at each wavelength. We applied here the method to a PAI system based on a clinical ultrasound array and carefully adapted the sample size to the frequency bandwidth of the detector. For adaptation to other systems, a simple rule to choose the tube radius would be that the frequency of the first zero of equation (1) must be larger than the upper frequency of the ultrasound bandwidth of the detector. Thereby, the entire frequency bandwidth of the detector will be covered by the generated signals and the detector sensitivity will be optimal. Moreover, if the system is further used for in vivo imaging, the sample size would be adapted to evaluate the sensitivity of the imaging system to the tested contrast agent. From equation (1), the inner tube radius a should smaller than:
a≾
3.83⋅v
s water2⋅
π
∗
f
max (14)With vswater the speed of sound in water, and fmax the upper frequency of the ultrasound
bandwidth. In our case, a should then be inferior to 0.13 mm with fmax=7 MHz, and the value
of a=100µm was thus appropriate. To ensure a good transmission of ultrasound waves, the wall thickness should be as small as possible compared to the acoustic wavelength in the material at the center frequency of the detector and the material of the tube should have an acoustic impedance close to that of water. In this respect, PTFE has an acoustic impedance of ZPTFE=2.97 Mray [29] compare to water Zwater=1.49 Mray. The wavelength at the center
frequency is 0.3 mm in the material (vsPTFE = 1390 m.s-1). With a wall thickness of 0.1 mm, the
transmission coefficient T in pressure through in the three layered system water-PTFE-water is [30] : T =75% at 25°C and at 5MHz. For comparison, a glass tube with the same wall thickness would yield T = 10%. Additional properties of the tube should be a weak optical absorption and scattering, and the material of the tube should be chosen to be chemically inert to avoid interaction with the sample. Our PTFE tubes had all the required properties, and they are commercially available in various diameters and wall thicknesses.
Using tubes as sample containers has several advantages over the containers used in other PA spectrometers: Beard et al [7] used a homemade cuvette, Fuenzalida Werner et al [10] used a single channel microscopy chip, and Pelivanov et al [11]enclosed their sample within a diaphragm between two quartz plates. For these containers, only one sample can be measured at a time and changing to another sample may require tedious preparation procedures. For our system however several tubes could be positioned in the imaged region. This allowed parallel measurements of different samples or for the evaluation of the variability of the measurement for one type of sample. Because thubes have two opened ends, they could also easily be flushed and the same tube could be used for a series of successive measurements. As the PTFE tubes are cost-effective, they were replaced as soon as they were polluted (persistent and additional absorption compared to the first “blank” dataset) or degraded.
The high repeatability of our measurements was shown with a coefficient of variation below 1.5% (Fig.3). The largest variability was observed when the sample was re-injected into a tube after flushing with air and cleaning with water. The small volume actually probed
by the system ~0.5µL (illuminated length of the tube of 1.5 cm) and the small volume in the tube 15µL may cause a slight heterogeneity from one sample to the other. The sensitivity was determined to be 0.04 cm-1 in the range 680 to 930 nm, and 0.15 cm-1 in the range 930 to 970
nm. This sensitivity is comparable to other previously reported PA spectrometers: lower bound of detectability corresponding to a decadic absorption coefficient of 0.02 cm-1 for the
system of Beard et al [8], 0.05 cm-1 for the system of Fuenzalida Werner et al [10] and 0.5
cm-1 for the system of Pelivanov et al [11].
Our calibration method relies on the injection in the sample container of an absorbing solution whose photoacoustic properties are known. We chose a solution of CuSO4,5H2O that
is absorbing in the NIR over the entire spectral range usually used in photoacoustic tomography. This solution is stable and has a photothermal conversion efficiency of 1. Unfortunately, its Grüneisen coefficient depends on the concentration, and values were previous reported in only one study to our knowledge [9]. Our estimation of the photoacoustic efficiency did not match with that study, and this point will be further discussed in the next paragraph. However at the concentration used for the calibration solution, our evaluation of ηcalibration= 1.14 is only 3% lower than the value reported by Fonseca
et al [9]. Pelivanov et al [11] also used CuSO4,5H2O as a calibration solution, but assumed ηCuSO4 = 1 even at concentrations up to 1M and, therefore, their calibration did not account for
the increase in the Grüneisen coefficient with the concentration. This discrepancy was not detected during the study probably because of their use of CuSO4,5H2O at different
concentrations as calibration solutions and a lack of validation on other known solutions. Fuenzalida Werner et al [10] separated the correction method used to obtain the shape of the PA spectrum from the calibration method to estimate the amplitude of the spectrum. They developed a complex process adapted to their measurement setup and validated its ability to retrieve the shape of the absorption spectrum in the range 400nm to 900 nm with solutions of NiCl2. However, amplitude calibration was performed in the visible range at 570 nm with
Brilliant Black BN (BBN), a dye that is photostable, non-florescent and for which the photoacoustic efficiency is expected to be equal to ηBBN = 1. No dye with similar properties
was identified in the NIR. The use of a pure solvent rather than a solution would give access to tabulated and otherwise measured thermodynamic properties that allow accurate knowledge of the Grüneisen coefficient. For instance, water was used as a reference solution to determine the Grüneisen coefficient of other solutions [9,24]. However, as water has a weak optical absorption below 1300 nm, its use as a calibration solution requires a laser source in the wavelength range 1300 to 1500 nm, and a system where the excitation light propagates in air before reaching the sample and not through a water bath. Therefore, a dedicated measurement system has to be built and a standard PAI system cannot be used. Moreover, for our system, water was already used for the “blank” measurement because the contrast agents for in vivo studies are in aqueous solutions. Other pure solvents commonly used for organic chemistry also have a weak absorption in the wavelength range 680-980 nm, and hence are not suitable to be used as a calibration solution. Consequently, the use of an aqueous solution CuSO4,5H2O with an evaluation of its Grüneisen coefficient is a simple,
functional and economical solution for the calibration of our spectrometer to simultaneously obtain the spectral shape and the amplitude of unknown samples.
With our calibration solution, we found that θPA at the highest tested concentration c CuSO4 =
0.6 M is 7% lower than what could be expected from the absorption spectrum µa and the
Grüneisen coefficient of Fonseca et al [9]. On the other hand, for the highest tested concentration of NiSO4,6H2O, cNiSO4 = 1.9 M, θPA was found to be 29% higher than expected.
To explain the discrepancy between our measured photoacoustic generation efficiencies and those reported by Fonseca et al [9], we identified the main differences in the measurement methods and then we evaluated their potential influence. Fonseca et al measured the Grüneisen coefficient based on the absorption of water in a spectral range (1400-1500nm) where the absorption coefficient of CuSO4 and NiSO4 can be considered negligible compared
to water. Their measurements were performed for large volumes (typically 1.5mL) [8]. One side of the sample container was in contact with air and the sample was illuminated from that side. The PA signal generated at the air-sample boundary by the exponentially decaying light fluence (caused by absorption) was measured with a broadband ultrasound detector. The signal amplitude was compared to a water sample (ratio) to determine the relative Grüneisen coefficient. The first major difference with our method is that our sample is contained in a 0.1 mm-radius tube with 0.1 mm thick walls. The second major difference is that we measured the Grüneisen coefficient in a wavelength range where the solute has a stronger absorption. Regarding the influence of the tube dimension and walls, two hypotheses can be formulated. The first hypothesis is that the walls of the tube may experience thermal expansion and might contribute to the Grüneisen coefficient. However, the thermal diffusion length during the laser pulse can be estimated to be smaller than 100nm both in water and in PTFE [22]. The contribution to the PA signal of that portion of the tube is thus negligible, considering that the PA generated temperature rise occurs purely in the solution present in the tube. The second hypothesis is that changes in the acoustic properties of the solution in the tube can modify the acoustic emission of the PA signal and/or its transmission though the walls of the tube. The speed of sound vs, the volumetric mass density ρ and the acoustic impedance Z= vs * ρ of
aqueous solutions of CuSO4 were shown to increase with the concentration of solute [31]. At
25°C, for pure water, vswater = 1496 m.s-1, ρwater = 997 kg/L and Zwater=1.49 MRay. For cCuSO4 =
0.6 M, vsCuSO4 = 1538 m.s-1, ρCuSO4 = 1088 kg/L and ZCuSO4= 1.67 MRay. As the relative
increase of vs and ρ is very low (a few percent), the modification of the PA generated
ultrasound spectrum is expected to be negligible and cannot explain the discrepancy. The increase in the speed of sound is expected to impact the signal amplitude mainly through the Grüneisen coefficient which is proportional to vs2. At 5MHz, the transmission coefficient of
the three layered model sample-PTFE-water [30] would only increases from T= 75% when the sample is water to T= 78% for cCuSO4 = 0.6 M. Moreover, this hypothesis cannot explain
that our value of ηCuSO4 is lower than that reported by Fonseca et al. In sum, the differences
due to the sample container cannot explain the discrepancy in the Grüneisen measurements. Regarding the excitation of the solutions in a wavelength range where the solutes have appreciable absorption, two hypotheses can be formulated. First, one could think of a non-linear PA behavior or a non-non-linearity of the measurement system. However, a non-non-linearity would distort the spectral shape of θPA compared to µ
a and this was not observed even for
NiSO4,6H2O which has an absorption amplitude drop of about 90% from 720nm to 890nm.
Finally, we can hypothesize that the Grüneisen coefficient differs when the absorption coefficient of the solution is dominated by the solute instead of the solvent. Using the same measurement system as Fonseca et al, Stahl [8] evaluated the Grüneisen coefficient of an aqueous solution of CuCl2 (cCuCl2= 200 g.L-1) as a function of the wavelength from 750nm to
1500 nm. At 20°C, it was observed that the Gruneisen coefficient was stable up to 1150 nm when the absorption was dominated by the solute, while for wavelengths greater than 1380 nm where the absorption was dominated by water, the Grüneisen coefficient increased by 14%. A possible, but not confirmed, explanation could be a Grüneisen coefficient specific to the hydration shells around the metallic ions of Cu2+ compared to the rest of the bulk solution.
The bulk solution is mainly excited when the absorption is dominated by the solvent as for experiments reported by Fonseca et al, while the hydration shells would have a stronger influence when the absorption is dominated by the solute. This results could explain why βCuSO4 was lower in our case than for Fonseca et al. Unfortunately, no study was reported for
Ni2+ and, therefore, we can not conclude that the higher β
NiSO4 can be explained by this
phenomenon. Further studies would be needed to confirm our evaluation of the photoacoustic generation efficiency of CuSO4 and NiSO4 and to fully understand the photoacoustic
properties of these chromophores in the different wavelength ranges. Such studies are beyond the scope of this paper. However, our evaluations of βCuSO4 and βNiSO4 were double checked by
performing two series of measurements and validated by measuring ηmixSO4 . Thus, we consider
that our evaluation of ηcalibration is valid for the range 680-980 nm.
Spectral measurements of commonly used contrast agents in PAI: gold nanorods and ICG, showed results compatible with previously reported studies. In particular, the wavelength and concentration dependent photoacoustic generation efficiency of ICG were verified. Our evaluation of the photoacoustic generation efficiency combines the Grüneisen coefficient and the photothermal conversion efficiency , but highly absorbing chromophores like ICG can be diluted enough so that the Grüneisen coefficient of the solution can reasonably be assumed to be that of the solvent. Therefore, variation of ηICG with the concentration are linked to the
changes in the photothermal efficiency, in particular due to the dye aggregation and reduced fluorescence. For scattering solutions of gold nanorods, as already shown by Pelivanov et al [11], the PA spectrum enables removal of the influence of the light scattering to access to the absorption properties of the solution. Our PA spectral measurement can be used to quantitatively characterize the PA properties of plasmonic nanoparticles and is expected to capture the shape of the absorption spectrum. However, the photothermal conversion efficiency may be lower than 1 due to thermal resistance from the absorbers to the solvent [27]. Therefore, our calibrated measurement may not exactly match the amplitude of the optical absorption coefficient. Comparison with the attenuation coefficient measured with SPP in transmission mode could provide information about the strength of the scattering and its spectral dependency.
5. Conclusion
The design of photoacoustic contrast agents has been demonstrated to be challenging, in particular because the photoacoustic spectrum may differ from the optical attenuation spectrum due to scattering and other physical processes. Therefore, a calibrated measurement of the photoacoustic spectrum and the photoacoustic generation efficiency is highly desirable at all stages of the development of PA contrast agents. We demonstrated a novel method that can be adapted to most commonly-used photoacoustic imaging systems to obtain calibrated photoacoustic measurements in the NIR range. Measurements were performed with small sample volumes of 15 µL and the detection sensitivity in terms of the decadic absorption coefficient is lower than 0.05 cm-1 for most of the spectral range. The system enables PA
measurements at very early stages of the development of new contrast agents. This method can benefit the material science and biomedical communities and satisfy the growing need for characterization of photoacoustic contrast agents.
Funding. This work project has received financial support from the CNRS through the MITI interdisciplinary programs (Defi Imag’IN), Gefluc Paris- Ile de France, Emergence Sorbonne Université 2019-2020, France Life Imaging (ANR-11-INBS-0006) and from the European Union's Horizon 2020 research and innovation program under grant agreements No. 801305 (NanoTBTech) and N°68335 (FOLSMART). M. Sarkar acknowledges support from the Paris Region (Ile-de-France) under the Blaise Pascal International Chairs of Excellence. Imaging was performed at the Life Imaging Facility of Paris Descartes University (Plateforme Imageries du Vivant – PIV).
Acknowledgments. The autors thank Lise Abiven at the Laboratoire de la Chimie de la Matière Condensée de Paris for the NIR spectrophotometric measurements. The authors also thank Alba Nicolás-Boluda, Jean-Baptiste Bodin, Rachel Meallet-renault, Gilles Clavier and Nicolas Tsapis for fruitful discussions.
Disclosures. The authors declare no conflicts of interest.
Data availability. Data underlying the results presented in this paper are not publicly available at this time but may be obtained from the authors upon reasonable request.