HAL Id: hal-03089690
https://hal.archives-ouvertes.fr/hal-03089690
Submitted on 28 Dec 2020
HAL is a multi-disciplinary open access
archive for the deposit and dissemination of
sci-entific research documents, whether they are
pub-lished or not. The documents may come from
teaching and research institutions in France or
abroad, or from public or private research centers.
L’archive ouverte pluridisciplinaire HAL, est
destinée au dépôt et à la diffusion de documents
scientifiques de niveau recherche, publiés ou non,
émanant des établissements d’enseignement et de
recherche français ou étrangers, des laboratoires
publics ou privés.
Can Structural MRI Radiomics Predict DIPG Histone
H3 Mutation and Patient Overall Survival at Diagnosis
Time?
Jessica Goya Outi, Raphael Calmon, Fanny Orlhac, Cathy Philippe, Nathalie
Boddaert, Stephanie Puget, Irène Buvat, Vincent Frouin, Jacques Grill,
Frédérique Frouin
To cite this version:
Jessica Goya Outi, Raphael Calmon, Fanny Orlhac, Cathy Philippe, Nathalie Boddaert, et al.. Can
Structural MRI Radiomics Predict DIPG Histone H3 Mutation and Patient Overall Survival at
Diag-nosis Time?. 2019 IEEE EMBS International Conference on Biomedical & Health Informatics (BHI),
May 2019, Chicago, United States. pp.1-4, �10.1109/BHI.2019.8834524�. �hal-03089690�
CAN STRUCTURAL MRI RADIOMICS PREDICT DIPG HISTONE H3 MUTATION AND
PATIENT OVERALL SURVIVAL AT DIAGNOSIS TIME?
Jessica Goya-Outi
?Raphael Calmon
†Fanny Orlhac
#Cathy Philippe
±Nathalie Boddaert
†St´ephanie Puget
†Ir`ene Buvat
?Vincent Frouin
±Jacques Grill
§Fr´ed´erique Frouin
??
IMIV, Inserm/CEA/Univ. Paris-Sud/CNRS/Universit´e Paris-Saclay, Orsay, France
#Epione, INRIA Sophia-Antiopolis, Valbonne, France
†
Pediatric Department, Hˆopital Necker Enfants Malades, Paris France
±UNATI, Neurospin, CEA, Universit´e Paris-Saclay, Gif-sur-Yvette, France
§
UMR 8203 CNRS, Gustave Roussy, Universit´e Paris-Saclay, Villejuif, France
ABSTRACT
Identifying tumor phenotypes non-invasively from quantitative imaging features is a challenge faced by radiomics. This study aimed at investigating if radiomic features measured at diagnosis time from conventional structural MRI can predict histone H3 mu-tations and overall survival of patients with diffuse intrinsic pontine glioma. To this end, 316 features from multimodal diagnostic MRI of 38 patients were extracted. Two approaches were proposed: a conventional estimation of features inside the whole region of in-terest and a mean estimation inside this region of local features that are computed from fixed size patches. A feature selection pipeline was then developed. Three machine learning models for H3 muta-tion classificamuta-tion and three regression models for overall survival prediction were evaluated. Leave-one-out F1-weighted scores for SVM model combining imaging and clinical features reached 0.84, showing a good prediction of H3 mutation using structural MRI. Some encouraging results were obtained to predict overall survival but they need to be reinforced on a larger number of patients.
Index Terms— Structural MRI, Radiomics, Image Standardiza-tion, Machine Learning, Rare Cancer
1. INTRODUCTION
Radiomics [1] is currently widely investigated in oncology. It aims at extracting multiple quantitative imaging features to identify tumor phenotypes with some predictive values. In this study, we investi-gate the contributions of radiomics to the diagnosis and prognosis of patients with diffuse intrinsic pontine glioma (DIPG). DIPG is a rare inoperable lethal pediatric cancer frequently associated with his-tone H3 mutations (H3.1K27M or H3.3K27M). These mutations are currently identified following biopsy and are associated with patient response to therapy [2].
In this context, we analyzed the ability of radiomic models to distinguish H3 mutation types non-invasively and to predict patient overall survival (OS). The ultimate goal will be to define whether this could avoid biopsy, or replace it when it is not feasible, and guide patient care from diagnosis time. For these prediction tasks, two methods for computing imaging features inside a spherical re-gion of interest included in the tumor were tested, a stringent feature selection procedure was proposed and radiomic signatures were built using different machine learning methods.
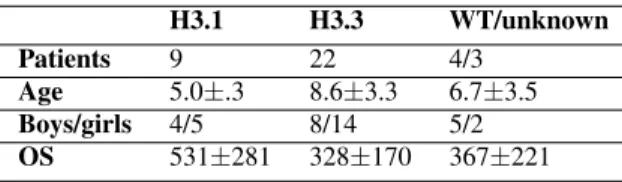
Table 1. Characteristics of 38 DIPG patients included in this study. Age at diagnosis is given in years, overall survival (OS) in days.
H3.1 H3.3 WT/unknown Patients 9 22 4/3
Age 5.0±.3 8.6±3.3 6.7±3.5 Boys/girls 4/5 8/14 5/2 OS 531±281 328±170 367±221
2. CLINICAL AND IMAGE DATA
This retrospective monocentric study included 38 patients with DIPG, scanned at diagnosis with four structural MRI modalities: T1-weighted (T1w), T2-weighted (T2w), T1-weighted post-contrast injection (T1wc) and T2-weighted FLAIR (FLAIR) with the same scanning parameters. Among these patients, 22 were H3.3K27M mutated, 9 were H3.1K27M mutated, 4 were H3.3/1 wild-type and 3 had unknown H3 mutation status. One of the 38 patients had a censored OS (last follow-up 390 days after diagnosis). There was no significant difference in sex between mutation types, H3.3K27M patients were older at diagnosis (Wilcoxon p=0.0009) and survived less time (Wilcoxon p=0.03) than H3.1K27M patients (Table 1). These data were similarly to [2] and thus showed that the studied sample is representative. Only the 31 patients with H3 mutation were included in the mutation discrimination model while all the 38 patients were included in the OS prediction modeling.
3. IMAGE FEATURE EXTRACTION
Images were pre-processed by a dedicated pipeline [3] including intensity standardization according to the hybrid white stripe ap-proach, resampling to isotropic voxels (1 mm3) and multi-modal images registration to each T2w scan. A total of 79 indices including first-order and texture features were computed for each MRI modal-ity using PyRadiomics [4]. For each patient, a large spherical region was drawn inside the tumor (globT ) on the T2w scans. The same globT was used in T1w, T1wc and FLAIR scans. Two sets of ra-diomic features were extracted using either global (FglobT) or local
• FglobT: A total of 316 (79 textural indices x 4 MRI
modali-ties) imaging features were computed within globT ROI; • FlocT: To eliminate the influence of the volume of the ROI
on textural values, a small sphere (locT , 5-mm radius) was used to scan every globT , with 1 voxel step, and textural in-dices were computed within locT ROI, for each locT posi-tion. Each globT voxel (v) was characterized by the feature values computed in locT centered on v. The means of each index were used to define the imaging feature set FlocT.
For the robustness analysis, further explained in the next section, the same feature extraction procedures were used in two additional scenarii, corresponding to two global regions derived from globT : a) globT dilated, globTdand b) globT eroded, globTe, with a 5-mm
radius sphere.
Fig. 1. Exemplification of local (FlocT) and global (FglobT) feature
extraction approaches.
4. LEARNING MODELS
Three feature sets were used as input in the development of pre-dictive models: Imaging feature set (316 features); Clinical feature set composed of age at diagnosis, sex and the globT volume (ap-proximation of tumor volume); and a Combined set of clinical and imaging features (316 + 3 features) was also investigated.
Since the number of patients is too small for effective train-ing/test sample splitting, Leave-One-Out Cross-Validation (LOOCV) was applied in feature selection and machine learning steps for model performances estimation in both H3 mutation prediction and OS prediction. It is important to note that the feature selection is performed inside each LOOCV fold, preventing selection bias [5]. For each LOOCV fold, all 316 imaging and 3 clinical features were standardized by mean subtraction and unit variance scaling in the training set and the same normalization parameters were then used to normalize the validation set. Models using FglobT and FlocT
were estimated separately. 4.1. H3 mutation prediction
In order to prevent over-fitting and make results interpretable, a small number of features should be selected, given the limited number of patients. Aiming to select robust, informative and non redundant fea-tures, a three steps selection procedure was applied to the imaging features. Step 1: Features were selected according to their robustness
to the spherical ROI delineations. Using the three definitions of tu-mor region (globT , globTeand globTd), the absolute agreement
in-traclass correlation coefficient (ICC) of each feature was computed. Only features with ICC > 0.9 were kept. Step 2: Features present-ing an individual Area Under the Receiver Operatpresent-ing Characteristic curve (AUC) < 0.75 were excluded. This threshold was a compro-mise between keeping features that could combine well with others and excluding those that could degrade the model. Step 3: To reduce redundancy, hierarchical clustering was performed, keeping the min-imum absolute Spearmans correlation coefficient (|r|) between clus-ter members greaclus-ter than 0.85. The feature with the greatest AUC of each cluster was finally selected. For the clinical feature set, only steps 2 and 3 were applied. If none of the features was selected, an univariate model was built with the feature presenting the greatest AUC.
The minority class H3.1 was resampled using regular Synthetic minority Over-sampling Technique (SMOTE) [6] in the training set. Support Vector Machine (SVM), K-Nearest Neighbors (KNN) and Random Forest (RF) were applied. Briefly, linear kernel was used in SVM and its penalty parameter C was set to 1. The parameter K was set to 3 in KNN. The number of trees was set to 100 in RF.
4.2. OS prediction
For the OS regression, the same feature selection steps were applied. However, in Step 2 and in Step 3, AUC < 0.75 criterion was re-placed by C-index < 0.55. The C-index is the equivalent of the AUC for regression problems.
Cox proportional hazards (COXPH) combined with inner-LOOCV Least Absolute Shrinkage and Selection Operator (LASSO) and with inner-LOOCV Ridge regression as well as Random Sur-vival Forest (RSF) were used to estimate patients risks. For each LOOCV fold, the median estimated risk value in the training set was used as a threshold to classify the validation patient into low-risk or high-risk groups. The number of trees was set to 1000 and minimal node size to 5 in RSF.
5. STATISTICAL ANALYSIS 5.1. H3 mutation prediction
Performances were estimated by the LOOCV F1-weighted score, grouping the validation patient results of every fold. The LOOCV was repeated 30 times to estimate the standard deviation of the pre-diction scores due to randomness introduced by SMOTE and RF.
5.2. OS prediction
Each patient was classified into low and high risk group using a model computed on the training set that they were not part of. All the patients classified as low-risk in any of the folds of the LOOCV were grouped together and a single Kaplan-Meier curve was com-puted for that low-risk group. The same was done for the high-risk group.
A permutation based strategy was used to assess the statistical significance since it is not possible to use the cross-validated sur-vival curves directly because the observations are not independent. The statistical significance of the LOOCV log-rank statistic was then obtained from the permutation distribution of the LOOCV log-rank statistic. It was estimated by 500 repetitions of the whole learning model process with random permutations of patients’ OS time [7].
6. RESULTS 6.1. H3 mutation prediction
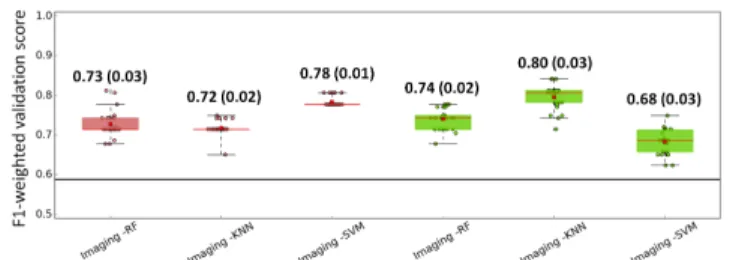
In average 10±1 local imaging features and 7±1 global imaging fea-tures were selected in each fold after the 3 steps selection. Feafea-tures selected in each fold tended to be the same, 9 local features and 6 global features were selected in at least 20 out of the 31 folds. Con-cerning the clinical features, age at diagnosis was selected in every fold, volume in 7 out of 31 folds and sex in none of the folds. The F1-weighted scores for all three machine learning methods using lo-cal and global imaging features are shown in Fig. 2(a). Each point correspond to one of the 30 trials. For global extraction, FglobT,
F1-weighted scores for SVM were slightly better than for the KNN and RF methods. For local extraction, FlocT, F1-weighted scores
for KNN were the best followed by RF and SVM. Furthermore, per-formances of models with local and global features are comparable. Overall, all machine learning models performed well for H3 mu-tation classification based on imaging features (F1-weighted score around 0.74). For the sake of comparison, the F1-weighted score for a model classifying all the samples as the most frequent one (H3.3) is 0.59.
In Fig. 2(b), the performances of SVM models using imaging features are compared to SVM models using clinical and combined (clinical + imaging) features. For global extraction, the imaging model is better than the clinical one and for both local and global extraction, the combined models are better than the imaging model alone. The SVM model using combined features was better with FglobT than with FlocT. The same trend (mean (standard
devia-tion)) was observed for the F1-weighted scores values of KNN and RF models using combined features: KNN local, 0.76 (0.04), KNN global 0.81 (0.02); RF local 0.74 (0.04), RF global 0.79 (0.04).
Based on the performances estimation with the LOOCV, the fi-nal proposed model using all 31 patients was computed by SVM using global extracted imaging features combined with the clinical features. The resulting selected features were: 1) Age at diagnosis, 2) T1wc GLSZM GrayLevelVariance, 3) T1w first-order Median, 4) T1wc first-order 10Percentile, 5) FLAIR GLCM Homogeneity1, 6) FLAIR first-order Median and 7) FLAIR first-order 90Percentile. 6.2. OS prediction
After the 3 steps feature selection 15±2 local imaging features and 7±1 global imaging features were selected in each fold. Features selected in each fold tended to be the same, 10 local features and 6 global features were selected in more than 26 out of the 38 folds. Concerning the clinical features, sex and volume were selected in 22 out of 38 folds while age at diagnosis only in 11 folds. In 5 folds, none of the clinical features were selected leading to a combined model identical to the imaging model. The cross-validated Kaplan-Meier curves (using the validation patient of each trial) for all the three regression methods, clinical, imaging (global and local), and clinical + imaging (global and local) feature dataset are shown in Fig. 3. COXPH Ridge regression and RSF invert the low and high risk groups in validation for all four sets of features including imag-ing features, while COXPH LASSO presents this behavior for the two sets of features including FglobT. COXPH LASSO regression
presented adequate survival curves for the two sets of features using FlocT. For the sake of comparison, training Kaplan-Meier curves
for the model learned were computed using all 38 patients. All the RSF and most of the ridge regressions showed significant log-rank p-values, suggesting over-fitting. Features selected in the final model using FlocT imaging set presenting non-zero weight after LASSO
(a) Imaging feature set models (results using FglobT are in red, FlocT in
green)
(b) SVM models using clinical (in blue), imaging and combined feature set (results using FglobTare in red, FlocTin green)
Fig. 2. Box-and-whisker plots of the F1-weighted validation scores. Values for each of the 30 LOOCV trials are displayed. Mean (red square) and standard deviation values are displayed. The black line represents the F1-weighted score, 0.59, corresponding to all patients classified as H3.3.
reduction (the method with the most satisfactory LOOCV result) were: 1) FLAIR GLSZM LowIntensitySmallAreaEmphasis and 2) T2w first-order Maximum.
7. DISCUSSION
Recently, radiomics has been promising to reveal patients progno-sis or phenotypes profiles non-invasively. In this study, we inves-tigated if radiomic features from diagnostic structural MRI could reveal the H3 mutation associated with each DIPG tumor and pre-dict patient OS. Results showed that good H3 mutation classification scores were found by three different machine learning methods when using imaging features previously selected by our proposed selection pipeline. Moreover, they performed better than a clinical model and F1-weighted scores increased when combining imaging and clinical features. Three first-order and textural imaging features issued from FLAIR, two from T1wc and one from T1w were selected in the final proposed model along with age at diagnosis. Future tests in an inde-pendent data set should be performed to confirm these scores. Local feature extraction was motivated by the presumption that features reflecting texture information could be formerly hidden by volume bias [3]. However, even though more local features were selected after our feature selection pipeline, models using global features pre-sented equivalent or better F1-weighted scores for H3 mutation clas-sification. Therefore, for this classification task, the interest of local extraction is not demonstrated. As the computation burden is high for the local extraction, we could suggest removing these local fea-tures for our particular application. But this recommendation cannot be generalized, and the potential impact of local features deserves to be tested for some other predictive tasks.
Fig. 3. Cross-validated Kaplan-Meier curves for the three overall survival models and five different combinations of features. High-risk in red, low-High-risk in blue.
configurations could separate significantly low and high risk patient groups at diagnosis time. Nevertheless, the problem that we at-tempted to address is complex since different mutation populations were mixed up and only non-invasive diagnostic features (i.e. ig-noring data derived from biopsy) were used. Actually, DIPG long-term survivals are defined as patients having survived longer than two years after diagnosis [8]. Since too few patients (five in our dataset) had long-term survival times, we could not use this classi-fication. As several methods, especially RSF, presented good train-ing performances but poor validation performances, we investigated some possible over-fitting. We tested a modified version of RSF [9] with minimal depth pathway hunting, which was more drastic than our three-step feature selection. As shown in Fig. 4, this RSF proce-dure provided better validation results.
This study was undertaken with a low number of patients, which makes the use of radiomics and machine learning methods very chal-lenging. This low number could not be increased at the present time for the three following reasons. First, DIPG is a rare disease. Sec-ond, the use of retrospective homogeneous datasets, including the four MRI modalities, has reduced the number of admissible patients. Third, as newly diagnosed patients are involved in on-going thera-peutic trials, their data are not currently available. However, this first discovery study was necessary to define the potential interest of the different structural images. For instance, the interest of FLAIR and post-contrast T1 weighted images to understand the different types
Fig. 4. Cross-validated Kaplan-Meier curves for the pathway hunt-ing RSF procedure. High-risk in red, low-risk in blue.
of H3 mutation was first illustrated by our results. This interest re-mains to be confirmed using data of an on-going clinical trial, when they will be available.
8. CONCLUSION
The combination of radiomic features, including first-order and tex-tural indices derived from structex-tural MRI at diagnosis, and of clinical data were found to be predictive of two types of histone H3 muta-tion in patients with DIPG. However, when using these features, it was not possible to validate a model discriminating two subgroups of patients with statistically significant differences in their overall survival.
9. REFERENCES
[1] P Lambin, E Rios-Velazquez, et al., “Radiomics: Extracting more information from medical images using advanced feature analysis,” Eur J Cancer, vol. 48, no. 4, pp. 441–446, 2012. [2] D Castel, C Philippe, et al., “Histone H3F3A and HIST1H3B
K27M mutations define two subgroups of diffuse intrinsic pon-tine gliomas with different prognosis and phenotypes,” Acta Neuropathol, vol. 130, no. 6, pp. 815–827, 2015.
[3] J Goya-Outi, F Orlhac, et al., “Computation of reliable textu-ral indices from multimodal brain MRI: suggestions based on a study of patients with diffuse intrinsic pontine glioma,” Phys Med Biol, vol. 63, no. 10, pp. 105003, 2018.
[4] JJM Van Griethuysen, A Fedorov, et al., “Computational ra-diomics system to decode the radiographic phenotype,” Cancer Research, vol. 77, no. 21, pp. e104–e107, 2017.
[5] C Ambroise and GJ McLachlan, “Selection bias in gene extrac-tion on the basis of microarray gene-expression data,” PNAS, vol. 99, no. 10, pp. 6562–6566, 2002.
[6] NV Chawla, KW Bowyer, et al., “Smote: Synthetic minority over-sampling technique,” JAIR, vol. 16, pp. 321–357, 2002. [7] RM Simon, J Subramanian, et al., “Using cross-validation to
evaluate predictive accuracy of survival risk classifiers based on high-dimensional data,” Briefings in Bioinformatics, vol. 12, no. 3, pp. 203–214, 2011.
[8] LM Hoffman, SEM Veldhuijzen van Zanten, et al., “Clinical, ra-diologic, pathologic, and molecular characteristics of long-term survivors of diffuse intrinsic pontine glioma (DIPG): A collab-orative report from the international and european society for pediatric oncology dipg registries,” J Clin Oncol, vol. 36, no. 19, pp. 1963–1972, 2018.
[9] X Chen and H Ishwaran, “Pathway hunting by random survival forests,” Bioinformatics, vol. 29, no. 1, pp. 99–105, 2013.