Publisher’s version / Version de l'éditeur: ASTM STP, 1451, pp. 19-36, 2003-12-01
READ THESE TERMS AND CONDITIONS CAREFULLY BEFORE USING THIS WEBSITE.
https://nrc-publications.canada.ca/eng/copyright
Vous avez des questions? Nous pouvons vous aider. Pour communiquer directement avec un auteur, consultez la
première page de la revue dans laquelle son article a été publié afin de trouver ses coordonnées. Si vous n’arrivez pas à les repérer, communiquez avec nous à [email protected].
Questions? Contact the NRC Publications Archive team at
[email protected]. If you wish to email the authors directly, please see the first page of the publication for their contact information.
NRC Publications Archive
Archives des publications du CNRC
This publication could be one of several versions: author’s original, accepted manuscript or the publisher’s version. / La version de cette publication peut être l’une des suivantes : la version prépublication de l’auteur, la version acceptée du manuscrit ou la version de l’éditeur.
Access and use of this website and the material on it are subject to the Terms and Conditions set forth at
Pullout resistance of roofing fasteners using different methods
Baskaran, B. A.; Sexton, M.; Lei, W.; Molleti, S.
https://publications-cnrc.canada.ca/fra/droits
L’accès à ce site Web et l’utilisation de son contenu sont assujettis aux conditions présentées dans le site LISEZ CES CONDITIONS ATTENTIVEMENT AVANT D’UTILISER CE SITE WEB.
NRC Publications Record / Notice d'Archives des publications de CNRC:
https://nrc-publications.canada.ca/eng/view/object/?id=7ab3448f-4429-46e6-adf8-ac7b4fead646 https://publications-cnrc.canada.ca/fra/voir/objet/?id=7ab3448f-4429-46e6-adf8-ac7b4fead646
Pullout resistance of roofing fasteners using different methods
Baskaran, A.; Sexton, M.; Lei, W.; Molleti, S.
NRCC-39815
A version of this document is published in / Une version de ce document se trouve dans :
Roofing Research and Standards Development: 5th Symposium, ASTM STP 1451, Tampa, Fl.,
Dec. 7, 2003, pp. 19-36
A. Baskaran,1 M. Sexton,2 W. Lei2 and S. Molleti3
Pullout Resistance of Roofing Fasteners Using Different Methods
REFERENCE: Baskaran. A., Sexton. M., Lei. W., and S. Molleti, “Pullout Resistance of Roofing Fasteners Using Different Methods,” Roofing Research and Standards Development: 5th Symposium, ASTM STP 1451, W.J. Rossiter and T.J. Wallace, Eds.,
ASTM International, West Conshohocken, PA, 2003.
ABSTRACT: Wind uplift rating is one of the key performance requirements for
single-ply mechanically attached systems. It depends on the properties of the membrane (mechanical, physical and chemical), substrate (compressive strength and dimensional stability), and deck (thickness and deflection). An attachment system (fastener, plate and seam) integrates the above components to form an assembly. Fastener pullout resistance (FPR) from the deck is one of the essential design parameters in the system specification. As well, the FPR is an indicator of the existing deck condition in reroofing/recover applications. In the field, the FPR values are obtained using pullout testers. To quantify the accuracy of the manual pullout testers under various environmental conditions, an experimental program is in progress at the National Research Council’s Dynamic Roofing Facility (DRF). From this ongoing research, this paper compares the FPR data from the field pullout tester with those obtained using the laboratory universal Instron testing machine. In the manual pullout tester, consistency of the FPR data depends on the operator. Considering this variable and to generalize the data, the above experiments are performed on two decks (steel and wood) with three different fastener types. The study finds that the field manual pullout tester underestimates the FPR data in comparison to the data obtained from the laboratory machine. This trend is found true irrespective of the selected decks and fasteners. In the roofing market, automatic pullout testers are also available that function using a battery-powered source. Selected experiments were performed to identify the influence of the pull out speed on the FPR data using an automatic pullout tester.
KEYWORDS: wind uplift, mechanically attached roofs, fastener design, roof decks,
pullout testers, fastener pullout resistance
1
Senior Research Officer and Group Leader, National Research Council, 1200 Montreal Road, Ottawa, ON, K1A 0R6.
2
Technical Officers, National Research Council, 1200 Montreal Road, Ottawa, ON, K1A 0R6.
3
Introduction
Wind loading on mechanically attached single-ply roofing is a complex problem. The devastating effect of two hurricanes, Andrew (110 to 125 mph) and Iniki (90 to 100 mph), clearly directed the roofing industry in search of better engineering methods to evaluate and design roofing systems. Failure of materials from roofing systems was the single largest (95 percent) contributor to financial loss during these hurricanes [1].
Mechanically fastened single-ply roof systems, that appear to be the fastest growing methods for industrial roofing, face the greatest challenge of resisting the variable wind forces that act upon them [2]. Of particular interest is their ability to handle the effects of wind flutter and fatigue caused by uplift forces of varying intensity and direction. Figure 1 shows a typical spot-fastened mechanical single-ply system. The wind uplift forces deflect the membrane causing membrane tension and loading on the fastener. The variation of wind-induced effects with time and space creates the phenomenon of dynamic wind loading on the fastener [3]. Spot-fastened systems subjected to asymmetrical loading are more vulnerable to wind dynamics. When the fasteners are exposed to multi-directional wind forces, rotation and rocking occurs. These effects cause fatigue deformation on the metal deck [4]. Ultimately, this prolonged fatigue leads to a reduction in the pullout resistance of the fastener, a factor that must be accommodated in the design of roof systems.
In contrast, the current industry design practices for determining fastener pullout resistance rely on tests that apply a constant static tensile force. It is understood that the development of a test procedure that can simulate the wind dynamics on fasteners is beyond the scope of the present paper. Instead, this paper attempts to determine, systematically, the accuracy of the existing field test practice. Need for such evaluations is critical due to several reasons, some of them highlighted below:
• For new construction design, typically, the FPR values are taken from the fastener manufacturer’s specifications, which provide the FPR data of a fastener for various deck (steel, wood and concrete) applications. There are differences among steel roof decks [5], depending on their grades. For example, ASTM A 653 Standard Specification for Steel Sheet, Zinc Coated (Galvanized) or Zinc- Iron Alloy – Coated (Galvanized) by the Hot Dip Process, Grade 80 (minimum yield strength 80 ksi–550 Mpa) and Grade 33 (minimum yield strength 33 ksi–230 Mpa) are both labeled as 22 Ga steel decks and are used interchangeably across North America. FPR value of a fastener tested on decks of Grade 80 and Grade 33 can vary as much as 50%.
• Similarly, there is a significant variation in the FPR data obtained for a fastener between plywood deck and oriented strand board [6].
• In most of the re-roofing applications, the deck properties cannot be easily determined. In those conditions, one of the critical design parameters is the FPR data.
To quantify the accuracy of the manual pullout testers under various environmental conditions, an experimental program is in progress at the National Research Council’s Dynamic Roofing Facility (DRF). From this ongoing research, this paper compares the FPR data from the field pullout tester with those obtained using the laboratory universal Instron testing machine. In the manual pullout tester, consistency of the FPR data depends on the operator. Considering this variable and to generalize the data, the above experiments are performed on two decks (steel and wood) with three different fastener types. The study finds that the field manual pullout tester underestimates the FPR data in comparison to the data obtained from the laboratory machine. This trend is found true irrespective of the selected decks and fasteners. In the roofing market, automatic pullout testers are also available that function using a battery powered source. Selected experiments were performed to identify the influence of the pull out speed on the FPR data using an automatic pullout tester.
Engineering Properties of the Selected Materials Decks
Steel: 22 - Gauge (0.76 mm thick) galvanized corrugated sheets of 610 mm long by
915 mm (24 in. by 36 in.) wide were used as steel deck specimens. Young's modulus (Es) value of the steel is approximately equal to 200000 MPa (29 x 103 ksi) and had minimum yield strength 230 MPa (30 ksi). The yield strength values were not measured for the present study. These values are reported as specified by the manufacture in accordance with the ASTM A 653 specification for the metal decks.
Wood: 12 mm (1/2 in) thick plywood sheets, 1219 by 2438 mm (48 by 96 in) were
used as the wood deck specimens. Young's modulus (Ew) value of the wood parallel to the grain, Ew = 10000 MPa (1451 ksi).
Fasteners
Three different fastener types were tested and their characteristics are listed in Figure 2. All installed fasteners were 130 mm (5.1 in.) long with a thread length of 102 mm (4 in.).
• Fastener #1 had a shank diameter of 4.572 mm (0.18 in.) with industry classification as #15. According to the manufacture specification, it is fabricated using hardened carbon steel with CR-10 fluorocarbon coating.
• Fastener #2 had a shank diameter of 4.37mm(0.17 in.) with industry classification as #14. It is fabricated using carbon steel with epoxy electro deposition coating.
• Fastener #3 is similar to Fastener #1 in size and is fabricated by a combination of techniques similar to that of Fastener #1 and Fastener #2, i.e., using carbon steel with CR-10 fluorocarbon coating.
As shown in Figure 2, differences exist among the fasteners in the head and tip design that can contribute to the pullout resistance. Close examination of the fastener tips also reveals the differences among the fasteners’ thread design, namely distance between the thread and its angle to the shank. Nevertheless, the same fasteners were tested for both wood and steel deck, in an attempt to establish FPR comparisons between them. All the materials were obtained as on shelf items through typical industry distribution channels.
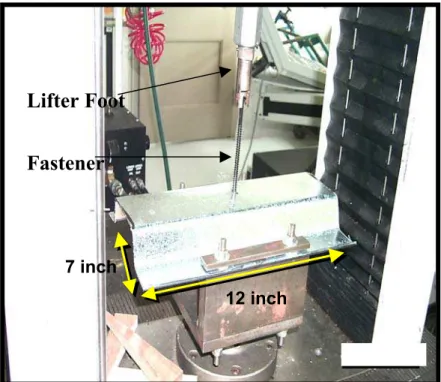
Instron Machine (IM) - Experimental Set Up and Data Steel Deck Samples
Samples tested were cut from 22 - Gauge (0.76 mm thick) galvanized corrugated sheets of 610 mm (24 in.) long by 915 mm (36 in.) wide. The sizes of the samples were 178 mm (7 in.) wide by 305 mm (12 in.) long. It was necessary to use these dimensions, since samples tested with shorter lengths 89 by 152 mm and 152 by 152 mm (3.5 x 6 in. and 6 x 6 in.) provided inaccurate results owing to excessive sheet deformation. On the other hand, samples tested with 305 by 305 mm (12 in. x 12 in.) do not affect the pull out resistance of the fasteners. As shown in Figure 3, the existing IRC/NRC facility can test samples with dimensions up to 457 by 610 mm (18 x 24 in.). Steel deck specimens were prepared by installing fasteners through the upper horizontal section of the deck’s profile, the so-called top flange or male rib. The fasteners were installed using a drill press. Special precautions were taken during the installation process to ensure that no bending of the sheet occurred and that the pressure applied during each application remained fairly constant. In each case, the fasteners were centered with respect to length and installed with a minimum penetration depth of 19 mm (3/4 in) to a maximum depth of 25mm (1 in).
F 1
:
#15
F 2
:
# 14
F 3
:
# 15
130 mm (5”)
#2
#1
#3
=4.37
= 4.572 mm
=4.572
Fastener
Lifter Foot
7 inch 12 inchFastener
Lifter Foot
10 inch 12 inchWood Deck Samples
Samples of 254 by 305 mm (10 x 12 in.) in size were prepared from 1219 by 2438 mm (48 x 96 in) sheets of 12 mm (1/2 in.) thick plywood. With wood decks, fasteners were installed perpendicular to the grain at penetration depths of 38 mm (1.5 in.). Penetration depth refers to the distance from the topside of the wood to the tip of the fasteners.
For both samples, an attachment base was designed so that the samples were held down along its edges. This attachment system was connected to a computer-controlled Instron Model 4502 testing machine. A constant upward force was applied by pulling the fastener at the 3 different rates of:
• Speed 1- S1 - 40 mm/min (1.6 in./min) • Speed 2- S2 - 48 mm/min (1.9 in./min) • Speed 3- S3 - 64 mm/min (2.5 in./min)
While the experiment is running, the software records the load vs. displacement curve in kilograms and millimeters. At the completion of the test, data were stored in an ASCII file for further analysis.
0 500 1000 1500 2000 2500 3000 0 5 10 15 20 25 DISPLACEMENT (mm) LOAD, N 1 2 3 4 5
Series Peak Load (N)
1 2513
2 2480
3 2380
4 2507
5 2447
Figure 4. Typical Load - Displacement Curve from Instron Machine
In Figure 4, typical load versus displacements recorded during testing of five different steel deck samples are compared. The graph refers to results obtained from testing Fastener #1at a pulling speed of 40 mm/min (1.6 in./min). During testing, the fastener was gradually pulled out of the deck causing sheet deformation along the fastener's
perimeter or area of influence. Eventually the fastener thread pulled out of the deck. In the case represented in Figure 4, the test was terminated immediately after the initial pullout of the fastener’s thread from its deck engagement. Continuation of the test showed significant reduction of pullout resistance following the initial failure. The sheet deformation around the fastener was about 4 mm vertically. Slight bending and damages in terms of coating loss on the threads of the fastener were also observed. The connection failure involved both the fastener and the steel deck.
FPR data obtained from IM is shown in Figure 5 for steel and wood deck samples. Data at three different pull out speeds for three different fasteners are compared. The plotted FPR data represents the average value of more than ten independent pullout tests. The standard deviations are also calculated and shown in the figure. The following observations are noted:
• In the case of the steel deck samples, Fastener # 1 yields 2504 N (563 lbf) as FPR, the highest FPR of all the 3 fastener types tested.
• Fasteners # 1 and # 3 have the same head design and shank diameter (4.57mm) and are both classified as #15 by the industry, however, Fastener # 1 performed better than Fastener # 3. This is due to the fact that there is a difference between the tip and thread design of Fasteners # 1 and # 3. These differences contributed to the fastener’s engagement with the deck, thereby affecting the FPR value. • For the steel deck samples, using the average data, a maximum difference of 62 N
(14 lbf) was calculated between the different pulling speeds. This is true for all three different fasteners.
Further scrutiny of the FPR results of wood and steel decks revealed the following:
• FPR does not vary between the testing samples in the case of steel decks. This is not true with wood decks. The maximum standard deviation for steel deck samples was 62 N (14 lbf) whereas in the case of wood deck it was 686 N (27 lbf).
• Even though steel is much thinner than wood (0.76 mm in comparison to 12 mm), fastener pullout loads are higher with steel decks. Two factors contribute to the higher pullout load with steel deck. First, the Young's modulus value of steel is high, Es = 200000 MPa (29 x 103 ksi), compared to that of wood, Ew (wood modulus parallel to the grain) = 10000 MPa (1451 ksi). Secondly, the steel deck gains a certain percentage of the pullout load by deflecting before the fastener fails. This was not observed with the wood deck.
Similar experiments were also carried out using OSB (a machine made product from wood flakes) deck samples instead of plywood. Overall, FPR values were greater for plywood than OSB. This is found to be true regardless of the fastener pulling speed. The difference between the two materials can be attributed to the additional strength contributed by the grain of the plywood. Plywood grains, having natural bonding, allowed the load to be more distributed thereby increasing the pullout loads. OSB, on the other hand, has low bonding between the grains. This causes a reduction in the FPR.
IM-STEEL
0 500 1000 1500 2000 2500 3000 FPR,N S1 S2Fastener1 Fastener2 Fastener3
IM -WOOD
0 500 1000 1500 2000 2500 3000Fastener1 Fastener2 Fastener3
FPR,N
S1 S2
S3
S3
Portable Automatic Machine (PAM) – Experimental Set Up and Data
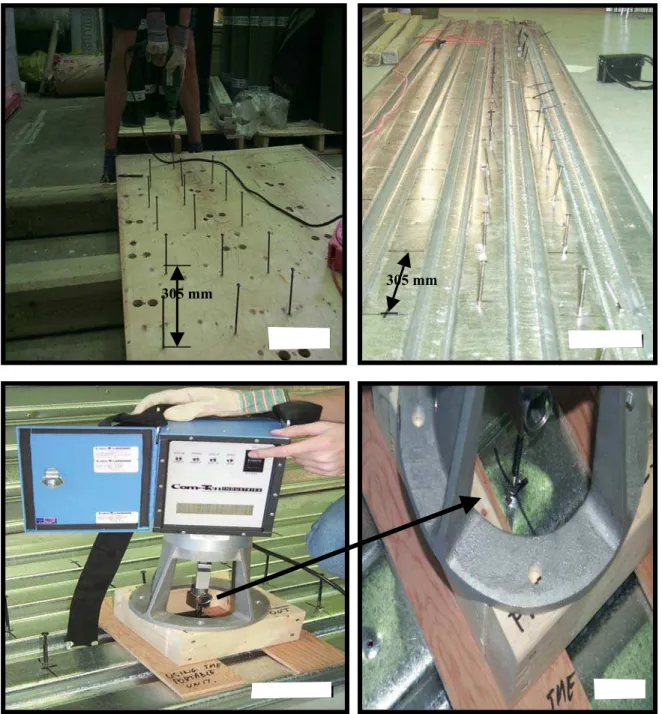
For the portable machines, an entire sheet of roofing deck was used for testing. However, the decks used were taken from the same manufactured set as those used for testing with the IM. As shown in Figure 6, both deck samples were placed on a 152 mm by 152 mm (6 x 6 in.) wood beams to provide the space needed for the fastener penetration depth and stability during the testing.
305 mm 305 mm
Fasteners were installed on the same deck sheet so that they were far enough away from each other to avoid influencing the engagement of adjacent fasteners during testing, when the deck experienced some deformation. Therefore a distance of 305 mm (12 in.) was provided between two fasteners.
A wood base support was attached to the PAM base for two reasons:
1. First, to get enough clearance between the fastener head and PAM tester when using a 127 mm (5 in.) long fastener.
2. Second, to provide a flat surface for the PAM base to avoid any tilt of the machine during testing.
Test performed without the wood base affected the FPR values for the above-mentioned reasons. Moreover, care should be taken such that the operator is not preventing the localized deck deformation during testing. This is more critical with the steel deck samples than with the wood decks tested. Another factor that can affect the FPR data was the alignment of the fasteners. As shown in Figure 6, care should be taken when attaching the fastener head to the pullout tester, such that the fastener remains vertically aligned. FPR data significantly varies between an inclined fastener and a vertical one. This difference in values also varies depending on the fastener thread design.
PAM has three pre-set pullout speeds (40, 48 and 64 mm/min) that are similar to the speeds used in the IM. It can display the load cell data either in newton, kilogram or pound. However, it stores only the maximum pullout resistance for the test. To run the PAM, according to the manufacturer, one can use the supplied battery or an AC/DC converter. During the present study the battery was not strong enough to allow many tests continuously and consistently. After about 15 pullout tests, the machine could not maintain the required speed and the maximum pullout resistance values were not consistent. Therefore, to avoid this limitation, all experiments were conducted using an 110V-12V converter.
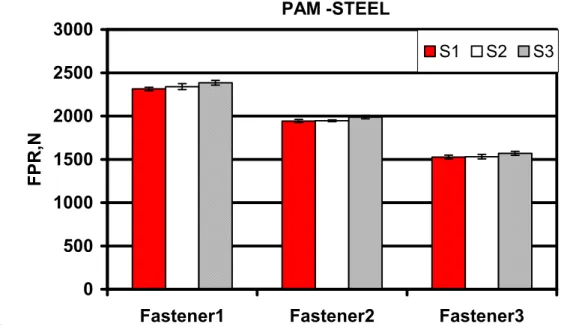
Figure 7 shows the FPR data on steel deck samples obtained from PAM. Differences in the fastener pulling speed does not affect the FPR values of the fastener. However, the three different fasteners each showed different values of FPR. The difference between fastener # 1 and # 3 was more than 814 N (183 lbf) (refer to Figure 5 in the case of IM, it was 698 N (157 lbf)). Discussion with the PAM manufacturer revealed that the output signal from load cell used in the PAM might have been interfering with the excitation signal. To recalibrate the load cell and to remove the signal interference, the PAM has been returned to the manufacturer several times. As the issue continued, it was decided to exclude the PAM data from the further comparison with the IM and error analysis.
500 0 PAM -STEEL 1000 1500 2000 2500 3000
Fastener1 Fastener2 Fastener3
FPR,N
S1 S2 S3
.
Figure 7: Pullout Resistance Data from Portable Automatic Machine (PAM)
Portable Manual Machine (PMM) - Experimental Set Up and Data
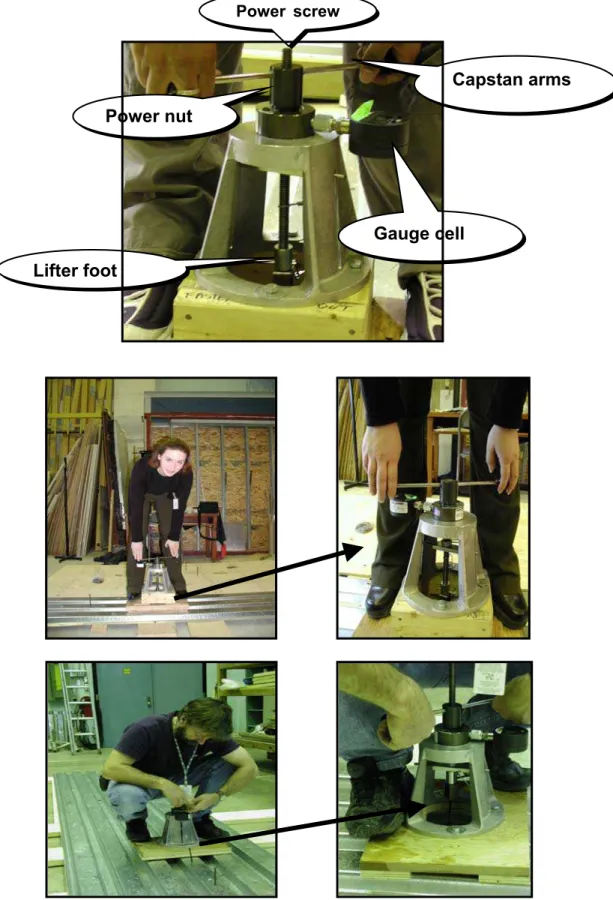
For testing with the PMM, the same samples and set up as for the PAM were used. Figure 8 shows the components of the PMM and testing in progress. Tensile forces are applied against the fastener by rotating the capstan arm. The power nut and screw arrangement transforms the rotational force into vertical tensile force. As shown in the figure, similar to PAM, a wood base attachment was used during the PMM operation. One major differences of the PMM in comparison to the other methods is the operator involvement. Three operators, two male and one female, were selected. The senior male operator had previous operating experience of the machine whereas the female and the other male operators were spectators during the pullout testing process and had a trial run before the actual testing.
Figure 9 shows the FPR data from the PMM both for steel and wood deck samples. In comparing the performance of different fasteners for the steel deck, it is clear that Fastener # 1 performs better than the others. A similar observation had also been noticed with the wood deck samples. However, the operator influence is clearly evident from the data. This influence is more pronounced in the wood deck samples then the steel deck samples. As shown, there is no consistent FPR variation amongst the different operators for the different fasteners tested. In the case of the wood deck samples, for Fastener # 1, operator 3 obtained higher FPR values than the other two operators. Similarly, operator 1 yielded the highest FPR values for Fasteners # 2 and # 3. Overall, operator dependence is more evident in the wood deck samples than the steel deck samples. This is also evident if one compares the calculated standard deviation values.
Power screw
Capstan arms Power nut
Gauge cell Lifter foot
PMM - STEEL
0 500 1000 1500 2000 2500 3000Fastener1 Fastener2 Fastener3
FPR, N Opp.1 Opp.2
PMM - WOOD
0 500 1000 1500 2000 2500 3000Fastener1 Fastener2 Fastener3
FPR,N
Opp.1 Opp.2
Opp.3
Opp.3
Comparison of Fastener Pullout Resistance
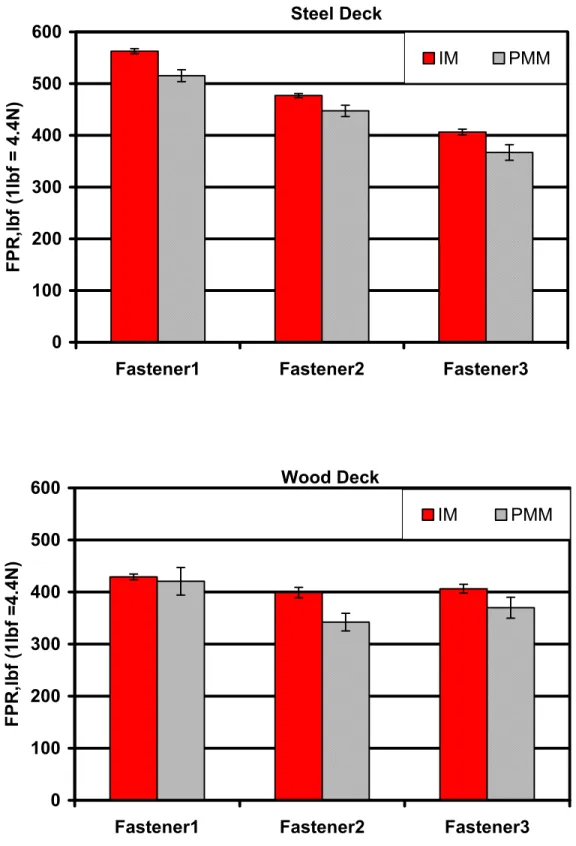
Figure 10 compares the FPR data obtained from the IM with that of the PMM. Data from steel and wood deck samples are presented for three different fasteners that are tested. In the case of the IM, the average data from three different speeds are compared with the average data obtained from three different operators of the PMM.
• For steel deck, a maximum deviation of about 222 N (50 lbf) between PMM and IM was noticed during the testing of Fastener # 1.
• For wood deck, a maximum deviation of about 330 N (70 lbf) between PMM and IM was noticed during the testing of Fastener # 2.
• For all fastener types, standard deviation values are higher for the steel deck samples than the wood deck samples.
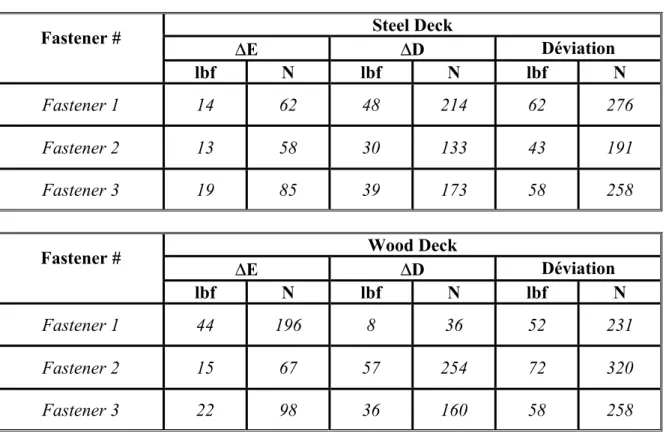
To establish the accuracy of the PMM, both experimental error and deviation from IM are calculated as shown in Table 1. The experimental error represents the PMM and IM difference in the standard deviation values for the respective fastener and deck type. Deviation error represents difference in the average value between the PMM and IM. The steps involved in the calculations are shown below:
(
i i IM PMM SD SD E∑
= − = ∆ 3 1 3 1)
(1)(
i i IM PMM AVG AVG D∑
= − = ∆ 3 1 3 1)
(2)∑
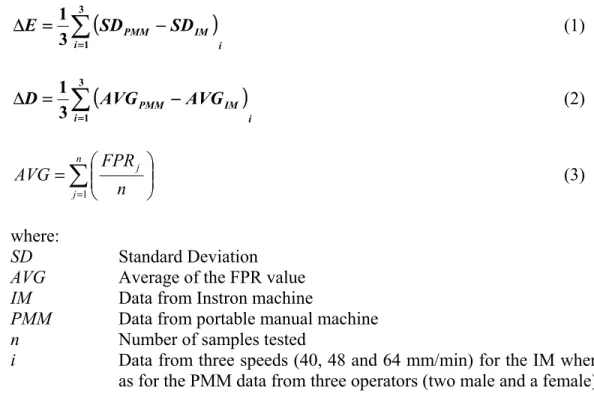
= = n j j n FPR AVG 1 (3) where: SD Standard DeviationAVG Average of the FPR value
IM Data from Instron machine
PMM Data from portable manual machine
n Number of samples tested
i Data from three speeds (40, 48 and 64 mm/min) for the IM where as for the PMM data from three operators (two male and a female) By algebraically adding the values of the equations (1) and (2), one can obtain the deviation of the PMM from IM. As tabulated, in the case of steel deck samples the experimental errors are less than deviation errors and this is not true for the wood deck samples. Regardless of the scenario, the PMM FPR data was always less than that of the IM. The PMM underestimates the FPR on the steel deck samples by 191–276 N (43-62 lbf) depending on the fastener type whereas in the case of the wood deck samples, the difference ranged from 231–347 N (52-78 lbf), depending on the fastener type.
Steel Deck 0 100 200 300 400 500 600
Fastener1 Fastener2 Fastener3
FPR,lbf (1lbf = 4.4N) IM Wood Deck 0 100 200 300 400 500 600
Fastener1 Fastener2 Fastener3
FPR,lbf (1lbf =4.4N)
IM
PMM
PMM
TABLE 1: Deviation of the PMM from IM Steel Deck ∆E ∆D Déviation Fastener # lbf N lbf N lbf N Fastener 1 14 62 48 214 62 276 Fastener 2 13 58 30 133 43 191 Fastener 3 19 85 39 173 58 258 Wood Deck ∆E ∆D Déviation Fastener # lbf N lbf N lbf N Fastener 1 44 196 8 36 52 231 Fastener 2 15 67 57 254 72 320 Fastener 3 22 98 36 160 58 258 Summary
From the limited data presented in this paper, one can generalize the following conclusions. ♦ ♦ ♦ ♦ ♦
The speed has no influence on the maximum pullout resistance.
Larger fastener shank diameter or larger fastener type does not necessarily yield higher fastener pull out resistance.
Good homogeneity of the data was obtained from the steel deck samples. Pullout resistance values from the steel deck samples are greater than those from wood deck samples.
Greater experimental error observed in the usage of PMM than the error from the IM. In field applications, overall, one should account for about 220-330 N (50 –70 lbf) underestimation in the fastener pullout resistance, when portable manual machines are used.
This paper presented a discussion that concentrated only on static pullout resistance of new materials. These resistance values are critical in determining the fastener design load with the respective deck composition. An equally important feature in fastener design is the prediction of its service life under dynamic conditions. For the steel deck, this phenomenon is influenced by various factors such as fatigue loading, deck corrosion, and thermal bridging. For wood deck, the factors influencing this phenomenon include moisture content, material non-homogeneity and the sample age. Efforts are in progress at IRC/NRC to develop proper experimental procedures to account for some of these
effects and to gather experimental data to predict fasteners' service life. Development of such design data is vital in re-roofing situations to determine the strength of the existing fastening system. Supporting this view, using Instron Machine, two types of experimental results are reported, one on fatigue loading on steel decks and another on water immersion effects on wood decks [4]. To establish the accuracy of the PMM in situations that are common in re-roofing applications, experiments will be undertaken using the PMM.
Acknowledgment
For conducting some of the experiments reported in the paper, the authors gratefully acknowledge the assistance of Sophie Nabon and Hugues Magnier (Exchange students from the Ecole Polytechnique France).The presented research is being carried out for a consortium - Special Interest Group for Dynamic Evaluation of Roofing Systems (SIGDERS). SIGDERS was formed from a group of partners who were interested in roofing design. These partners included: Manufacturers - Atlas Roofing Corporation, Canadian General Tower Ltd., GAF Materials Corporation, GenFlex Roofing Systems, Firestone Building Products Co., IKO Industries Ltd., Johns Manville, Sarnafil, Soprema Canada and Stevens Roofing Systems. Building Owners - Canada Post Corporation, Department of National Defence, Public Works and Government Services Canada.
Industry Associations -Canadian Roofing Contractors' Association, Canadian Sheet Steel
Building Institute, Industrial Risk Insurers, National Roofing Contractors’ Association and Roof Consultants Institute. Research Agencies-Institute for Research in Construction, Institute for Aerospace Research and Canadian Construction Material Centre.
References
1. Gerhardt, H.J. and Gerbatsch, R.W., “Wind Resistance of Mechanically Attached, Single-Ply Systems, Fastener Load, Safety Considerations and Optimal Fastener Patterns, A Decade of Change and Future Trends in Roofing”, International
Symposium on Roofing Technology, National Roofing Contractors Association, USA,
(1991), pp 276-282.
2. Warshaw, S.W. and Hoher, K., “Mechanical Fastening of Single-Ply Roof Membranes into Steel Decks--An Engineering Evaluation, A Decade of Change and Future Trends in Roofing”, 1985 Second International Symposium on Roofing
Technology, (1985), pp. 183-193.
3. Mahendran, M., “Fatigue Behavior of Corrugated Roofing Under Cyclic Wind Loading”, Transactions of the Institution of Engineers, Australia, Civil Engineering, Vol. CE 32, No. 4, (1990 b), pp. 219 - 226.
4. Baskaran, B.A. and Dutt, O., “Performance of Roof Fasteners Under Simulated Loading Conditions”, Journal of Wind Engineering and Industrial Aerodynamics, 72, pp. 389-400, 1997.
5. Graham, M.S., 2001, “Differences Among Steel Roof Decks”, Professional Roofing, October Issue, National Roofing Contractor Association.
6. Chui,Y.H. and Craft, S., 2002, “Fastener Head Pull Through Resistance of Plywood and Oriented Strand Board”, Canadian Journal of Civil Engineering, 29, 384-388.