HAL Id: hal-03137410
https://hal.archives-ouvertes.fr/hal-03137410
Submitted on 10 Feb 2021
HAL is a multi-disciplinary open access archive for the deposit and dissemination of sci-entific research documents, whether they are pub-lished or not. The documents may come from teaching and research institutions in France or abroad, or from public or private research centers.
L’archive ouverte pluridisciplinaire HAL, est destinée au dépôt et à la diffusion de documents scientifiques de niveau recherche, publiés ou non, émanant des établissements d’enseignement et de recherche français ou étrangers, des laboratoires publics ou privés.
Distributed under a Creative Commons Attribution - NoDerivatives| 4.0 International
More frequent separation and repartnering among
people aged 50 and over
Anne Solaz
To cite this version:
Anne Solaz. More frequent separation and repartnering among people aged 50 and over. Population & Societies, 2021, pp.1-4. �hal-03137410�
Anne Solaz*
Divorces and union dissolutions have become much more frequent in the last half-century, as has repartnering. What about people aged 50 and over? Using several data sources, Anne Solaz explains that these people have also been affected by this phenomenon, and examines differences in partnership trajectories between cohorts and between men and women in France.
More frequent separation and repartnering
among people aged 50 and over
The partnership trajectories of the large baby-boom cohorts who reached age 50 in the 21st century are different from those of previous generations. With the increase in non-marital cohabitation in the 1970s, fewer couples married. Separation and repartnering also became more frequent. Are these differences still visible beyond age 50? Will these cohorts continue to behave in the same way as they reach old age? Does the frequency of separation or repartnering beyond age 50 vary according to past union history?
Changing union histories across cohorts
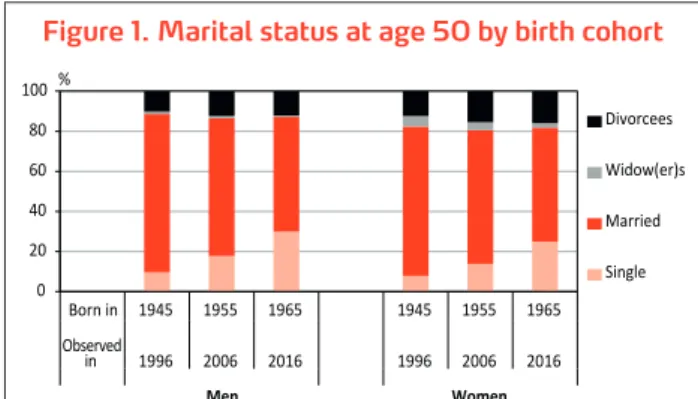
Twenty years ago, most people reaching age 50 had experience of just one union and celebrated their 50th birthday with their partner as part of a married couple with children [1]. Today, the marital status of 50-year-olds is more diverse (Figure 1). While 79% of men and 75% of women born in 1945 were married at this age, the proportion was just 57% for both sexes in the cohort born 2 decades later. There are now slightly more divorcees but many more people who have never married (‘single’ status). In the most recent observed cohort, born in 1965, 30% of men and 25% of women have never married.
Most single people at age 50 have nonetheless been in one or more cohabiting consensual unions, but these unions are less straightfoward to study than civil
partnerships or marriage. Using data from the European Generations and Gender survey (Box), cohabiting unions can be identified, regardless of whether they were formalized or led to family formation, and the union history of successive cohorts can be compared at different times in their life cycle. The French EPIC survey (Box) has been used to update results with more recent data for the youngest cohorts.
* French Institute for Demographic Studies. This study was conducted with Marine Billmann during her internship as part of the ‘Vieillir à deux’ (Ageing as a couple) project supported by the Agence nationale de la recherche (ANR-15-CE36-0009). Special thanks to Carole Bonnet, Joëlle Gaymu, Fanny Godet, and the project team members.
Figure 1. Marital status at age 50 by birth cohort
Source: INSEE, data for 2016, 2006, and 1996.
0 20 40 60 80 100 Born in 1945 1955 1965 1945 1955 1965 Observed in 1996 2006 2016 1996 2006 2016 Men Women Divorcees Widow(er)s Married Single %
Anne Solaz, Population & Societies no. 586, INED, February 2021.
www.ined.fr
Population
&
&
Societies
Number 586 • February 2021 • Population & Societies
cliquer ici pour la
Forming a union in later life: intentions… With the massive increase in separations, associated with greater social acceptance of separated or divorced people, the over-50s can now repartner more easily after dissolving a union.
That said, among people living alone, intentions to form or reform a union decrease rapidly with age from the 50s onwards (Figure 3); 29% of people over 50 surveyed in 2005 said they would probably or certainly repartner within 3 years versus 8% of those over 60 and just 3% of those in their 70s.(1) Men are much more inclined to repartner than women; 37% of men aged 50–59 reported probably or certainly intending to form a new union versus 24% of women in this age group. At ages 70–79, the proportion is still 10% for men compared to just 1% for women. Intentions to form a union are also linked to past union history. Men and women who have never been in a couple rarely want to form a union within the next 3 years, either because they have stopped looking for a partner, or because they have never wanted one. At a given age, people living alone after their partner’s death are also less inclined to form a new union than those who separated from their previous partner. This is especially true for women; only 9% whose partner has died want to form a new union in the coming years (2% ‘certainly’ and 7% ‘probably’). The proportion is twice as high (18%) among men. … and their realization
Observed behaviours confirm the differences in intentions by age and sex. New unions become increasingly rare as age advances (Figure 4). Men aged 70 and living alone are only half as likely to One-third of 50-year-olds have had
at least two cohabiting partners
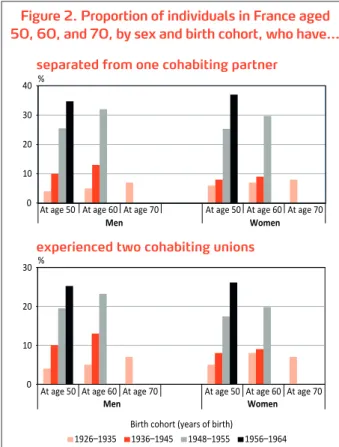
The share of people who have already separated from at least one married or cohabiting partner at age 50 increases from one birth cohort to the next. It rises from 4% among men born between 1926 and 1935, to one-quarter among those born just after the Second World War, and to more than a third among those born between 1956 and 1964 (Figure 2). The trend for women is similar.
Experience of several cohabiting relationships also becomes more frequent across cohorts. Among people born in the 1930s, only 4% of men and 5% of women at age 50 had experienced several unions. While the proportion then slightly increases with age because of repartnering, it was still only 8% by age 70 for both men and women in this cohort. Most experienced just one union, generally a marriage, in their lifetime. The situation is very different for the 1960s cohorts born 30 years later, among whom a quarter of men and women had already been in at least two cohabiting relationships by age 50. While the proportions are similar for both sexes at this age, the gender differential is wider at age 60 because women are less likely to enter a new union beyond age 50.
Figure 2. Proportion of individuals in France aged 50, 60, and 70, by sex and birth cohort, who have…
Coverage: Individuals born between 1926 and 1964; weighted numbers in each source.
Sources: Harmonized GGS data (2005) for the 1926–1935 and 1936– 1945 cohorts; EPIC survey (2013–2014) for the 1948–1955 and 1956– 1964 cohorts.
Figure 3. Intentions to form a cohabiting union within 3 years by age and sex in 2005
Coverage: People not living with a partner. Source: GGS, 2005. 0 20 40 60 80 100 M W M W M W M W M W
Ages 50–59 Ages 70–79 Never in a union Single a�er
separa�on partner’s deathSingle a�er
Age group Union history
Certainly Probably Probably not Certainly not % 0 10 20 30 40
At age 50 At age 60 At age 70 At age 50 At age 60 At age 70
Men Women
0 10 20 30
At age 50 At age 60 At age 70 At age 50 At age 60 At age 70
Men Women
1926–1935 1936–1945 1948–1955 1956–1964 Birth cohort (years of birth)
% %
separated from one cohabiting partner
experienced two cohabiting unions
Anne Solaz, Population & Societies no. 586, INED, February 2021. Anne Solaz, Population & Societies no. 586, INED, February 2021.
form a new union as men aged 50, but women are 5 times less likely to do so at age 70 than at age 50. Men repartner more frequently than women at all ages, and the gender difference widens with advancing years. Men are 0.25 times more likely than women to repartner at age 50, 3 times more likely at age 73, and 4 times more likely at age 86. It is difficult to say whether the differences of intention reflect women’s lower likelihood of repartnering, or rather a lesser propensity to do so, as women have ‘less to gain’ than men, given the unequal gender division of domestic labour—among these older generations especially. At older ages, women may prefer a relationship where they maintain their independence [3], without living under the same roof as their partner, for example, as Lewin [4] has shown for several European countries. Moreover, with advancing age, the sex ratio of ‘potential partners’ becomes increasingly imbalanced. While similar numbers of men and women are not in a union at age 50, partnerless women outnumber men by 3 to 1 at age 75 and by 5 to 1 at age 90. This ‘union market’ asymmetry is heightened as men tend to choose younger partners. For all these reasons, men are much more likely than women to form or reform a union at all ages.
Last, for a given age, people never having been in a union at age 50 are the most likely to remain single in old age. They may be less interested in living with a partner or have unobserved characteristics, such as a health problem, that make them less attractive. People who have separated (after marriage or a cohabiting union) are in a stronger position on the repartnering market than those widowed.
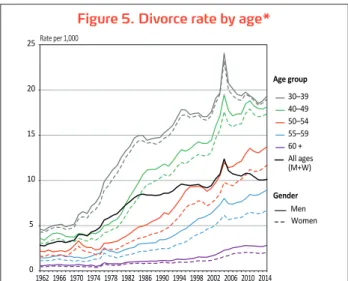
A rise in divorce at older ages
While divorce becomes less frequent with age, the number of divorces involving a man or woman aged over 50 has increased sharply in recent years. In 1996, 17% of all divorces involved a man aged over 50, and by 2016 the proportion had risen to 38%. These pro-portions were 11% and 29%, respectively, for women over 50. The relative increase is even greater for divorces involving spouses aged over 60, which have tripled as a proportion of all divorces (Table 1).
Table 1. Divorces involving older adults as a share of all divorces in 1996 and 2016 (in %)
Ages 50 ̶59 Ages 60+ Overall: ages 50+ Women Men Women Men Women Men 1996 9 13 3 4 11 17
2016 21 26 8 12 29 38 Source: Ministry of Justice.
This increase in divorce at older ages (sometimes called ‘grey divorces’ or ‘silver splitters’ [6], which refers to older adults’ greying hair) is due in part to the large size of the birth cohorts concerned, but this is not the only explanation. While stabilizing at youn-ger ages, and even decreasing since the 2000s for the youngest cohorts (Figure 5), the propensity to divorce is still trending upward at these ages. After a peak Figure 4. Probability of forming a cohabiting
union after age 50 by sex and age in 2017
Coverage: People aged 50–90 living alone.
Source: Fichiers démographiques sur les logements et les individus (Fidéli), 2017. 0 1 2 3 4 5 0 1 2 3 4 5 6 7 8 50 52 54 56 58 60 62 64 66 68 70 72 74 76 78 80 82 84 86 88 90 Age Men Women
Men’s excess likelihood (right-hand scale)
Male-to-female ra�o of probabili�es %
Figure 5. Divorce rate by age*
*Number of divorcees of age x per 1,000 spouses of age x. Source: Ministery of Justice and INSEE (long time series on popula-tion structure). 0 5 10 15 20 25 1962 1966 1970 1974 1978 1982 1986 1990 1994 1998 2002 2006 2010 2014 30–39 40–49 50–54 55–59 60 + All ages (M+W) Age group Gender Men Women Rate per 1,000
(1) Results for intentions to form a union may be biased by a cohort effect, which cannot be distinguished here from the age effect because we only know about intentions at a single point in time.
Anne Solaz, Population & Societies no. 586, INED, February 2021. Anne Solaz, Population & Societies no. 586, INED, February 2021.
3
www.ined.fr
between 2005 and 2006 following a change in the law in early 2005 to simplify divorce procedures, divorce at ages 50–60 continued to rise for both sexes. In a
couple, marriage, divorce, union dissolution, repartnering, over-50s, baby-boomers, ERFI survey, EPIC survey, France
Keywords
In France, among individuals born in the 1930s, only 4% of men and only 5% of women lived in a union several times by age 50. Most have experienced only one cohabiting union, usually marriage, in their lifetime. Among those born 30 years later, in the 1960s, a quarter of both men and women have experienced more than two unions. Men are more likely to repartner than women at any age. These gender gaps widen with age. Men are a quarter more likely than women to form a new relationship at age 50, and 3 times more likely at age 73. Divorces among seniors are increasing.
Abstract
context of general decline in the propensity to divorce since the 2000s in France [7], this reverse pattern is surprising. It was first identified in the United States but is now also clearly visible in France. It remains to be seen whether the phenomenon is specific to the baby-boom cohorts now reaching these later ages, or whether the increase will continue when the younger cohorts enter their 50s.
REFERENCES
[1] Delbès C., Gaymu J., 2005, Situations matrimoniales et ménages des personnes âgées: quelles évolutions? Retraite et
société, 45(2), 69–87.
[2] Perelli-Harris B., Kreyenfeld M. R., Kubisch K., 2010, Harmonized histories: Manual for the preparation of comparative fertility and union histories (MPIDR Working Paper WP-2010-011), Rostock, Max Planck Institute for Demographic Research.
[3] Gierveld J. D. J., 2002, The dilemma of repartnering: Considerations of older men and women entering new intimate relationships in later life, Ageing International, 27(4), 61–78. [4] Lewin A. C., 2018, Intentions to live together among couples living apart: Differences by age and gender, European Journal of
Population, 34(5), 721–743.
[5] Bonnet C., Godet F., Solaz A., 2019, Gendered economic
determinants of couple formation over 50 in France (Working
Paper G2019/13), Montrouge, INSEE.
[6] Brown S. L., Lin I. F., 2012, The gray divorce revolution: Rising divorce among middle-aged and older adults, 1990–2010, The
Journals of Gerontology: Series B, 67(6), 731–741.
[7] Bellamy V., 2016, 123 500 divorces en 2014. Des divorces en légère baisse depuis 2010, Insee Première, 1599, June.
Box. Data sources
The European Generations and Gender surveys (GGS) are longitudinal surveys conducted in different countries of Europe using similar sampling methods and questionnaires. They cover a wide range of topics, including family structure, union history, fertility, health and well-being, work, financial resources, and values. The first wave of the French version (Enquête sur les relations familiales et intergénérationnelles) was conducted in 2005 on a sample of 10,069 people aged 18–79. The GGS is a valuable data source for studying union trajectories because it includes a set of retrospective questions on union history. Respondents are asked about their partner, if any, but also about previous cohabiting unions (lasting at least 3 months), along with the cohabitation start and end dates, or the marriage and divorce dates of these unions. The study described here is based primarily on retrospective union history data taken from the Harmonized Histories (HH) version of the first GGS survey wave conducted in 12 countries [2].
The EPIC survey of individual and partnership trajectories (Étude des parcours individuels et conjugaux), conducted by INED and INSEE in 2013–2014, provides more recent data on unions and family life in France. Data were collected on all types of unions (marriages, civil partnerships, consensual unions) and on people not in a relationship at the time. A total of 7,825 people aged 26–65 living in an ordinary household in metropolitan France were surveyed. Fidéli (Fichiers démographiques sur les logements et les individus) is an exhaustive statistical database on dwellings and individuals compiled annually by INSEE that can be used to link demographic and economic information. It comprises various sets of administrative data obtained from the tax authorities (housing tax, building register, individual tax files, and tax returns), additional data on place of residence, and welfare benefits received by households from the Filosofi database (Fichier Localisé Social et Fiscal).
Also used were INSEE’s long time series on population structure and data on divorces from the Ministry of Justice.
INED: 9, cours des Humanités • CS 50004 •
93322 Aubervilliers Cedex • France
Director of Publications: Magda Tomasini Editor-in-chief: Gilles Pison
English Language Editor: Christopher Leichtnam Translator: Catriona Dutreuilh
Graphic Designer: Isabelle Milan Printer: Mérico Delta Print, Bozouls, France
This document may be reproduced free of charge on paper or online using our
No. 586 • February 2021 • Population & Societies
Monthly bulletin of the French Institute for Demographic Studies
Download Population & Societies free of charge and subscribe at:
www.ined.fr/en/publications/editions/population-and-societies