HAL Id: hal-01692723
https://hal.archives-ouvertes.fr/hal-01692723
Submitted on 25 Jan 2018
HAL is a multi-disciplinary open access
archive for the deposit and dissemination of
sci-entific research documents, whether they are
pub-lished or not. The documents may come from
teaching and research institutions in France or
abroad, or from public or private research centers.
L’archive ouverte pluridisciplinaire HAL, est
destinée au dépôt et à la diffusion de documents
scientifiques de niveau recherche, publiés ou non,
émanant des établissements d’enseignement et de
recherche français ou étrangers, des laboratoires
publics ou privés.
Awareness and Reflection in Virtual and Remote
Laboratories: the case of Computer Education
Julien Broisin, Rémi Venant, Philippe Vidal
To cite this version:
Julien Broisin, Rémi Venant, Philippe Vidal. Awareness and Reflection in Virtual and Remote
Lab-oratories: the case of Computer Education. International journal of technology enhanced learning,
2017, 9 (2/3), pp.254-276. �10.1504/IJTEL.2017.084503�. �hal-01692723�
To link to this article : DOI :
10.1504/IJTEL.2017.084503
URL :
https://doi.org/10.1504/IJTEL.2017.084503
To cite this version :
Broisin, Julien and Venant, Rémi and
Vidal, Philippe Awareness and Reflection in Virtual and Remote
Laboratories: the case of Computer Education. (2017)
International Journal of Technology Enhanced Learning, vol. 9
(n° 2/3). pp. 254-276. ISSN 1753-5255
O
pen
A
rchive
T
OULOUSE
A
rchive
O
uverte (
OATAO
)
OATAO is an open access repository that collects the work of Toulouse researchers and
makes it freely available over the web where possible.
This is an author-deposited version published in :
http://oatao.univ-toulouse.fr/
Eprints ID : 18811
Any correspondence concerning this service should be sent to the repository
administrator:
[email protected]
Awareness and reflection in virtual and remote
laboratories: the case of computer education
Julien Broisin*, Rémi Venant and
Philippe Vidal
Institut de Recherche en Informatique de Toulouse, Paul Sabatier University,
Toulouse, France
Email: [email protected] Email: [email protected] Email: [email protected] *Corresponding author
Abstract: Virtual and remote laboratories are of most importance when students
have to acquire professional skills and competencies. Also, educational sciences establish reflection as a central concern for learners’ engagement in deep learning. As research showed that self- and social awareness promote reflection, the present research investigates how the design of awareness tools could leverage reflective thinking and peer support during a practical activity. We designed a set of tools including social comparison, reflection-on- and -in-action tools. They have been integrated into the Lab4CE system, our remote laboratory environment for computer education. An experimentation showed that awareness and reflection tools had small but positive impact on students’ perception of learning and that learners significantly used these tools and highly rated the system. These results suggest additional studies to investigate tools are able to increase students’ perception of reflection, interactivity and peer support and to understand how technology can enhance refection.
Keywords: computer education; reflection; self-awareness; social awareness;
virtual and remote laboratory.
Reference to this paper should be made as follows: Broisin, J., Venant, R. and
Vidal, P. (2017) ‘Awareness and reflection in virtual and remote laboratories: the case of computer education’, Int. J. Technology Enhanced Learning, Vol. 9, Nos. 2/3, pp.254–276.
Biographical notes: Julien Broisin is an Associate Professor of Computer
Science at the University of Toulouse (France). His research interests include inquiry learning through the design and development of remote laboratories, personalised and adaptive learning as well as participatory learning through audience response systems.
Rémi Venant is a PhD Student in Computer Science at the University of Toulouse. His thesis relies on the design and development of solutions for remote and virtual laboratories to promote deep learning. His current work deals with the support of learning analytics and enhanced visualisation tools to provide teachers and learners with awareness and to increase interactivity, on demand help and collaboration.
Philippe Vidal is a Full Professor of computer science at the University of Toulouse (France). He led the Computer Science Department-Toulouse Institute
Awareness and reflection in virtual and remote laboratories
of Technology for 6 years before co-leading the Toulouse doctoral school of mathematics, computer science and telecommunications from 2013 to 2014.
This paper is a revised and expanded version of a paper entitled ‘How to leverage reflection in case of inquiry learning? The study of awareness tools in the context of virtual and remote laboratory’, presented at REV2017, New York, USA.
1 Introduction
The deep approach is a learning situation in which people try to go beyond the immediate knowledge they are studying (Webb, 1997). At the opposite of the surface approach, deep learning focuses on the signification of knowledge and tries to link previous and new knowledge, to identify relations between different theories, to relate theoretical concepts with everyday life or to distinguish evidence and argument (Ramsden, 1988).
Moon (1999) establishes reflection as a central concern for learners’ engagement in deep learning. She even states that “reflection appears to be the engine that shifts surface learning to deep learning” (Lockyer, Gondocz and Thivierge, 2004, p.50). Reflection has been widely defined in the literature. Dewey’s work of reference defines reflection as “the kind of thinking that consists in turning a subject over in the mind and giving it serious thought” (Dewey, 1933). A wide range of studies showed that technology-enhanced learning can be used to foster reflection in higher education (Strampel and Olivier, 2007) or high school (Shieh, 2012). This process may take several forms, including writing of web blogs (Xie et al., 2008; Yang, 2009) or journals (Hiemstra, 2001; Bourner, 2003), computer prompts encouraging learners to adapt their learning strategies (Chung, Chung and Severance, 1999), formative online self-assessment tests (Wang et al., 2006) or question prompts requiring learners to provide explanations about their work (Crippen and Earl, 2007) or to reflect on problem-based learning situations (Bixler, 2008). When properly taken into account within an online learning environment, reflective learning leverages learning outcomes (Means et al., 2009).
During the last decade, a significant number of researchers studied how awareness tools could be used to promote reflection: among the social competencies defined by Goleman (1996) that require self-reflection, self-awareness but also social awareness became a central preoccupation (Stedman and Andenoro, 2007). To support (self-) reflection, a wide variety of ideas and initiatives emerged, leading to the investigation of a significant number of awareness approaches. Among the increasing body of research exploring how to promote reflection through awareness, Govaerts et al. (2010) propose a dashboard exposing various statistical data about the usage of the learning environment by learners; Fessl, Wesiak and Luzhnica (2014) profile users to allow them to track their mood and to reflect on their mood development; or Feeler (Durall and Leinonen, 2015) uses biomarkers to monitor physiological data and visual reports to foster learners’ self-understanding.
In the context of inquiry learning that leads to knowledge building, deep learning and reflection (de Jong, Linn and Zacharia, 2013), virtual and remote laboratories (VRL) gain more and more interest from the research community, as the Go-Lab European project involving more than 15 partners demonstrates it. However, research in this area mainly focus on the technical and technological issues instead of emphasising the pedagogical expectations to enhance learning. Yet, some research conducted around remotely controlled track-based robots (Kist et al., 2011) showed that, among other benefits, reflection and metacognition could emerge (Maxwell et al., 2013). Our previous works introduced
Lab4CE, a remote laboratory for computer education (Broisin, Venant and Vidal, 2015). The main objective of this environment is to supply remote collaborative practical sessions in computer science to learners and educators. It provides them with a set of tools and services aiming at improving pedagogical capabilities while hiding the technical complexity of the whole system. In this paper, we design new awareness and reflection tools to investigate the following research question: how the design of both individual and group awareness tools could leverage reflective thinking and peer support during a practical activity? Indeed, on the basis of the research conducted by Moon (1999) to show that collaborative work can promote reflection, Boud (1999) went a step further and concluded that working with peers supports reflection in a more sustainable way than when the collaboration process occurs with someone presumably ‘superior’.
The awareness approach (Bodemer and Dehler, 2011; Buder, 2011; Janssen and Bodemer, 2013) builds on learning analytics (Schneider et al., 2012) to provide users with information, or feedback, about their learning process; such awareness information may be related to either the individual learners or the group as a whole. This approach is complex, as it requires to identify the data that must be collected, to set up a tracking system according to the data to collect, to compute these data in order to produce relevant indicators and to use appropriate visualisation techniques to return indicators back to (group of) learners and tutors at the right time. Thus, to tackle the above research question, our methodology consists in
i building a learning analytics framework that is able to infer meaningful indicators ii designing and integrating a set of awareness and reflection tools into our remote lab
environment
iii setting up an experimentation of the enhanced Lab4CE framework in an authentic learning context
iv analysing the experimental results.
These four steps constitute the remaining of the paper. They are preceded by a state of the art about awareness and reflection in the context of VRL and followed by a conclusion.
2 Awareness and VRLs
Virtual and remote labs are complex systems requiring to solve various hardware and software issues. Until now, research in this area mainly focused on architectural design (Harward et al., 2008; Lowe et al., 2009), queuing algorithms (Lowe, 2013), load balancing (Sancristobal et al., 2010) or standardisation (Salzmann et al., 2015). Since collaboration and group work are important features in the context of inquiry learning (Saab, van Joolingen and van Hout-Wolters, 2012), other studies embed awareness tools into VRL to support collaborative activities.
Several VRL stand on 3D virtual worlds such as Wonderland or Second Life to provide awareness about what partners are doing (Fayolle, Gravier and Jailly, 2010; Scheucher et al., 2009; Arango et al., 2007; Garcia-Zubia et al., 2010); these highly immersive environments offer learners the opportunity to observe how others interact with the VRL. Viewing others’ actions can also be achieved by screen sharing protocols (Tee, Greenberg and Gutwin, 2006), applets (de la Torre et al., 2013; Jara et al., 2012) or other ad hoc solutions (Scheucher et al., 2009). Other approaches that allow collaboration between peers
are based on event propagation across the various users’ interfaces (de la Torre et al., 2013): to share a resource of the lab between several participants (i.e. to offer them the opportunity to manipulate the same resource), the state of the virtual lab resulting from an action carried out by one of the participants is broadcasted to all users. Event propagation thus offers a common representation of the virtual or remote lab, but users are not aware of what others are doing, they are only aware of the results of their actions. Finally, audio and/or video feeds are sometimes used to provide a live stream of what is happening on the remote apparatus (Kostulski and Murray, 2011; Lowe, Newcombe and Stumpers, 2013; Nickerson et al., 2007), but this approach cannot be applied in our computer education context, where no physical or observable changes occur on the virtual resources.
To the knowledge of the authors, a very few VRL environments try to engage learners in the reflective process. FORGE, a European initiative for online learning and experimentation via interactive learning resources, proposes learning analytics to support awareness and reflection for teachers and learners (Mikroyannidis et al., 2015). Widgets inside ebooks and online courses track learners’ interactions with peers and learning contents using the xAPI (ADL, 2014) and learning analytics are then applied to these data to evaluate learners and provide them (as well as educators) with awareness about the detailed activities they carried out. In the case of virtual worlds that can be used to return feedback to learners and educators about the tasks that have been achieved during a practical activity, the feedback is limited to high-level information such as ‘started/not started’ or ‘completed/not completed’ (Callaghan et al., 2009) that can hardly engage learners in the reflection process.
The review of literature thus shows that existing VRL are poorly featured regarding awareness tools, especially when these artefacts come to engage students in a deep learning process. This trend may be due to the data recorded by such environments that are sometimes not detailed enough to further build relevant awareness tools (Odeh and Ketaneh, 2012). Our work tries to go beyond these limitations: starting from an existing remote lab dedicated to computer education, we introduce new awareness tools designed to foster reflective learning as well as peer support.
3 Lab4CE: a remote laboratory for computer education
Our previous research on computer-supported practical learning introduced Lab4CE (Broisin, Venant and Vidal, 2015), a remote laboratory for computer education. In this section, we focus on its main learning features and introduce new learning analytic capabilities that represent the basis for the tools exposed later in this article.
3.1 Functional learning features
The Lab4CE environment stands on existing virtualisation technologies to offer to users’ virtual machines hosted by a cloud manager (i.e. OpenStack). It exposes a set of scaffolding tools and services to support various educational process and has been designed according to the following guidelines:
i to allow learning of computer science at scale (i.e. to take into account a wide range of computer science topics, while supporting a large amount of users)
iii to promote collaboration between users
iv to design a system as easy-to-use as possible so as to require no extra competencies from users.
Learners and tutors are provided with a rich learning interface illustrated on Figure 1 and integrating the following artefacts:
i a web Terminal gives control on the remote virtual resources required to complete the practical activity
ii a social presence tool provides awareness about the individuals working on the same practical activity
iii an instant messaging system ensures exchanges of text messages between users iv an invitation mechanism allows users to initiate collaborative sessions and to work
on the same virtual resources; learners working on the same machine can observe each other’s Terminal thanks to a streaming system.
In addition, a management dashboard intended for tutors exposes information about the state of the remote laboratory hosting the virtual resources. Finally, the Lab4CE environment includes a learning analytics framework in which all interactions between users and the system are recorded.
3.2 Learning analytics features
The learning analytics framework manages data about interactions between users, between users and remote resources and between users and the Lab4CE learning interface. To represent these data, we adopted the ‘I did this’ paradigm (ADL, 2014).
3.2.1 Learning analytics data model
To describe any type of interactions, we designed a common data model composed of several attributes including, in addition to an identifier, the type of action that has been carried out, the practical context in which the action took place (i.e. the user laboratory and the practical activity’s identifier and name), the user that performed the action and a timestamp. This information model allows to express interactions occurring between users and most of the Lab4CE learning artefacts; for instance, the interaction “the user rvenant accessed its laboratory on 11 of November, 2015, within the activity Introducing Shell” can be easily represented by the common data model. However, it must be extended by two extra attributes to describe text messages exchanged between users: the chat room in which messages have been posted and their content.
Within the Lab4CE environment, interacting with a remote resource means executing a command through the web Terminal, or changing the state of the resource by activating the start/stop/resume buttons of the rich learning interface (Figure 1). The data model representing these interactions thus comprises, in addition to the information of the common data model, the arguments and options of the command, the output returned back by the resource on which the action has been executed and the identifier of this resource. Thus, if the user rvenant executes the command “rm -v script.sh” on one of his resources during the activity Introducing Shell, the matching data expressed using the JSON format that will be recorded into the learning analytics store could look something like the following code listing. These data structure and format are referred to as a learning analytics trace, or trace, in the remaining of the document.
{ "_id" : objectId("5364220addcb2"), "action" : "rm",
"labId" : "452f2dacqb7542", "activityId" : "64498c02c523bf", "activityName" : "Introducing Shell", "user" : "rvenant", "ts" : "2015-11-10T15:18:53.301Z", "args" : "-v script.sh", "output" : "rm: myfile: No such file or directory",
"resourceId" : "88b26213-5685-442a-847a-a07a48fa74d4"}
Traces enclosed within the learning record store (LRS) can be easily reused either by learning dashboards and awareness tools for visualisation purposes, or by other components to compute indicators that make sense from the educational point of view. However, starting from a trace, some low-level information is lost, and some indicators cannot be inferred anymore. For instance, when users enter commands in the web Terminal, they might hesitate and press the backspace key of the keyboard. User hesitation does not appear in a trace (as it contains only the final command executed by the user), but it can be inferred from low-level data (referred to as raw data in the remaining of the paper) such as the stream of characters going through the web Terminal.
Therefore, in the present work, we introduce the attribute indicators into the data model representing interactions between users and resources. This descriptor provides different valuable information such as the user hesitation that can be inferred from the raw data only. Our final learning analytics data model appears in Table 1. In the next section, we present how traces are built and focus on the new component able to compute indicators.
Table 1 The learning analytics data model of the Lab4CE environment
Types of interactions
User/Lab4CE GUI User/remote resource User/user
Action args Room
labId Output Message
expId resourceId
expName Indicators
userName timeStamp
3.2.2 Learning analytics framework
In order to collect the raw data and produce the learning analytics traces described above, we designed a tracking framework illustrated in Figure 2 and comprising four main components. Sensors extract raw data from both the web Terminal and the tools of the learning interface (as both sources of raw data are required to produce a trace in case of interactions between users and resources) and ensure the mapping with our data model (see 1 in Figure 2). A forger aggregates information (see 2 in Figure 2) coming from sensors into a fulfilled raw trace, i.e. a trace consistent with the model, but which includes the whole stream of characters typed by the user through the web Terminal, encoded using a standard computing code. Thanks to a routing table, the forger then routes the raw trace either to an enriching engine (see 3 in Figure 2) that infers values of one or several indicators before returning an enriched raw trace (see 4 in Figure 2), or to the LRS that records the final LA trace resulting from the transformation of the original raw trace (see
6
in Figure 2). The transformation process removes a black list of characters (e.g. the backspace) and then decodes the computing-encoded characters into human-readable texts (see 5 in Figure 2).
Compared to our previous work, one contribution of this paper relates on the enriching engine. To enrich a raw trace with valuable indicators, this new component relies on an inference model composed of a solver and of a set of rules: the solver applies rules that specify how a given indicator must be inferred. Basically, rules analyse attributes of a raw trace to find out specific patterns and/or compare attributes between them to identify meaningful information (Section 4.1). The enriching engine distinguishes two types of rules: match rules are low-level rules that determine if a raw trace matches specific conditions; indicator rules are high-level rules that combine an undefined number of match rules using a mathematical predicate to produce the value of an indicator. These two levels of rules bring flexible computational capabilities to the enriching engine and facilitate the specification of new indicators by reusing existing match rules.
On the basis of this tracking framework, a wide range of tools can be designed for various purposes. In the next section, we introduce (self-)awareness tools aiming at initiating reflective learning within the Lab4CE environment.
4 The awareness tools to boost reflection and peer support
Self-analysis of our actions and performance is part of some reflective practice models: within cognitive learning environments, requiring learners to analyse why and what they are doing supports metacognition (Jonassen, 1999). The first tool of this section gives attention to self-analysis of performances, whereas the two others focus on analysis of actions.
4.1 The social comparison tool
4.1.1 Theoretical basis and objectives
The analysis by learners of their own performance can be supported by self-awareness tools exposing to learners, on the basis of their learning paths within instructional units, various information about their level of knowledge. These learning analytics tools build dashboards to return feedback about students’ overall results (Prensky, 2011), their global level of performance (Arnold and Pistilli, 2012), strengths and weakness (Howlin and Lynch, 2014) or about precise concepts through computer-based assessments (Miller, 2009; Ricketts and Wilks, 2002). These tools all evaluate learners’ performance by addressing acquisition of theoretical concepts and knowledge. However, in the context of practical activities, such evaluation techniques become inappropriate as they do not evaluate how learners are able to reuse and apply their theoretical knowledge when they are faced with a concrete and practical situation; level of practice is used in the remaining of this document to denote the ability of being able to apply a theoretical knowledge during a concrete and practical situation.
In addition, recent research shows that learners should also become engaged in a social analysis process to enhance their reflection (Wilson and Jan, 2008). Comparative tools are designed to make each learner’s performance identifiable and therefore to allow individuals to compare their own and their partners’ activity. Such types of tools consist of social comparison feedback that allow group members to see how they are performing compared to their partners (Michinov and Primois, 2005). These social awareness tools present awareness information in various ways (Jermann, 2004) and bring students the feeling of being connected with and supported by their peers (Lowe et al., 2009).
4.1.2 Design and learning scenario
Evaluating learners’ level of practice implies the evaluation of the interactions between users and the learning artefacts of the Lab4CE environment. In the present study, we focus on the evaluation of interactions between users and remote resources, since this type of interaction is highly representative of the learners’ level of practice. As these interactions occur through the use of computational commands, at least two types of evaluation can be considered:
i syntactic, i.e. evaluation of the technical rightness of the command
ii semantic, i.e. evaluation of the relevancy of the command according to the objectives of the practical activity.
The semantic measurement of an action is very specific and strongly related to the practical activity being achieved; it is thus a time-consuming process requiring various competencies. We address here the syntactic facet, so as to identify whether a command carried out by a learner has been successfully executed on the target resource. The technical rightness indicator should be evaluated as right (respectively wrong), if it has been (respectively has not been) properly executed on the resource; in that case, the value of the indicator is set to 1 (respectively 0). In a Shell Terminal, the output of a command can be used to detect the success or failure of its execution; the implementation details are given in the next section.
The social comparison tool we designed thus reuses the technical rightness indicator to reflect to users their level of practice. Previous research showed that visualisation tools dealing with such data have to require very few attention to be understood and beneficial for learners (Sweller, 1994). We adopted a simple colour code (i.e. green, if the indicator is set to 1, red, if it is set to 0) to represent, as progress bars, learners’ performance. The tool distinguishes the learners’ level of practice during the session within the system (i.e. since they logged in the system - see progress bar My current session in Figure 3) and their level of practice taking into account the whole set of actions they carried out since they started working on the given practical activity (i.e. not only the current session, but also all previous sessions related to the given activity - see progress bar My practical activity in Figure 3). This tool also comprises a progress bar to reflect the level of practice of the whole group of learners enrolled in the practical activity (i.e. all the sessions of all users - see progress bar All participants in Figure 3). Each time a command is executed by a learner, the progress bars are automatically updated with a coloured item (see next section). Finally, the social presence tool (Section 3.1) exposing the users currently working on the same practical activity has been enhanced: the session level of practice of each user is displayed using a smaller progress bar (see bottom right corner of Figure 1).
Through the current and general progress bars, learners can get aware of the progression of their level of practice regarding a given activity; they are also able to compare their current level with their average level. In conjunction with the group progress bar, learners can position themselves in relation to peers and become more engaged in learning tasks (Kollöffel and de Jong, 2015). In addition, the progress bars included in the social presence tool allow learners to identify peers that perform better, and thus to get support from them using other social awareness tools (see further). Concerning the tutoring task, the group progress bar helps educators to adjust the difficulty and objectives of the practical activity, while the individual learners’ progress bars give them the opportunity to easily and quickly detect users facing with blocking situations and to bring them the support they need.
Figure 3 The social comparison tool exposing learners’ performance (see online version for colours)
Let us note that the indicator on which the social comparison tool stands on, i.e. the technical rightness, is not specific to computer science. In most of STEM disciplines, such an indicator may be captured: a given instruction is executed (respectively not executed) by an equipment, if it is (respectively is not) technically/semantically well formulated.
4.1.3 Implementation
To set up the social comparison tool, we first specified the attribute technical rightness into the data model as an indicator of a trace. Then, to infer this indicator, our approach consisted in identifying the various error messages that may occur within a Shell Terminal when a technically wrong command or program is executed. According to our findings, we specified four match rules (MR): the rule MR1 reveals errors arising when the argument(s) and/or option(s) of a command are incorrect; MR2 triggers the error occurring when a command entered by the user does not exist; MR3 and MR4 indicate if the manual of a command that does not exist has been invoked. Finally, we designed an indicator rule (IR) characterised by the following mathematical predicate and whose matching map score returns 0, if the predicate is evaluated as true, 1 if it is evaluated as false.
I R= M R1 ∨ M R2 ∨ (M R3 ∧ M R4)
In order to validate the accuracy of this indicator rule, we manually evaluated the technical rightness indicator on a sample of 300 commands produced by students: the evaluation performed by the enriching engine on this sample computed the same result than our manual evaluation for 298 out of the 300 cases (i.e. in 99.3% of all cases).
Once this indicator is inferred by the enriching engine, the enriched raw trace is decoded and stored into the LRS (Section 3.2). The social comparison tool then adopts the publish-subscribe messaging pattern to retrieve and deliver these information. The server side of the Lab4CE system produces messages composed of a pair timestamp-technical rightness as soon as a new trace is stored into the LRS and publishes these messages into various topics; the progress bars act as subscribers of these topics. The current and general progress bars are updated in near real time (i.e. just after a user executes a command), whereas the group artefact is updated on an hourly basis only.
As mentioned earlier, a command could also be evaluated from the semantic point of view, i.e. considering the context of the practical activity: a command might be executed
successfully while being irrelevant to the goal the learner has to achieve. However, to compute this instructional rightness, production of solutions to practical activities has to be ensured either automatically or manually by tutors and teachers. This process goes beyond the scope of this article and will be in the focus of future research.
The social comparison tool allows learners to self-analyse their levels of performance, as well as those of their peers, but the visualisation approach we adopted prevents them to deeply analyse their own and peers’ actions. While exposing performance, the tools presented below thus provide details about the actions carried out by users on resources.
4.2 The reflection-on-action tool
4.2.1 Theoretical basis and objectives
According to Boud, Keogh and Walker (1985), reflection is a complex process consisting of returning to experiences, re-evaluating the experiences and learning from the (re)evaluation process in order to adapt future behaviour. This model makes learners self-aware of their learning progress and capable of taking appropriate decisions to improve their learning (Davis et al., 2013). It is also very much in line with the research conducted by Wilson and Jan (2008), who found that analysing and making judgements about what has been learned and how learning took place are involved in the reflective process. These tasks can only be achieved by learners themselves, but their engagement in reflection can be initiated and fostered either by teachers and tutors through the creation of a classroom climate of trust and respect (Bringle and Hatcher, 1999), or by technology in the context of online learning environments (Wilson and Jan, 2008) through reflection-on-action scaffolding tools.
Reflection-on-action can be defined as the analysis of process after the actions are completed (Davis et al., 2013), or as “standing outside yourself and analysing your performance” (Jonassen, 1999). Collins and Brown (1988) recommend various strategies to engage learners in reflection-on-action such as imitation by learners of performance especially modelled for them, or replay of students’ activities and performance by teachers. Since some approaches consider that reflective thinking implies something other than own thinking (Wilson and Jan, 2008), the tool presented here acts at both the individual and social levels and aims at supporting reflection-on-action by offering users the opportunity to return to what they and their peers have learned and how.
4.2.2 Design and learning scenario
The tool is accessible through an item of the top main menu, or from the progress bars of the social comparison and presence tools (see Figure 3 and bottom right corner of Figure 1). It features visualisation and analysis of detailed information about interactions between users and remote resources. Users are able to consult the commands they carried out during a particular session of work, or since the beginning of a given practical activity. The tool has been designed to let users easily drill down into deeper and fine-grained analysis of their work, but also to let them discover how peers have solved a given issue. Figure 4 shows the graphical user interface of this tool: the top of the interface exposes a form to allow users to refine the information they want to visualise, whereas the main panel exposes the selected data. To facilitate the projection of the information, the filtering features include the possibility to select a given user, a particular session of work and, if applicable, one or several resources used during the selected session. The actions matching with the selected criteria are then exposed to users as timelines. Each node of a timeline
represents a command and is coloured according to its technical rightness. In addition, the details of a command (Table 1) can be visualised by putting the mouse over the matching node; in that case, the date the command has been carried out, the action and the output are displayed into the Terminal-like area appearing on Figure 4.
This reflection-on-action tool allows users to browse the history of the actions they carried out and thus brings learners into a reflective learning situation where they can analyse their practical work sessions in details. In addition, learners can easily focus, thanks to the coloured-coded artefact, on the difficulties they experienced. Also, combined with the social presence tool, learners are able to easily seek immediate help from peers by analysing the commands executed by users currently performing well into the system. This tool offers to tutors the opportunity to replay learners’ actions and to evaluate their performance. They are also able to highlight the commands learners have difficulties with and to adapt their teaching strategies accordingly. Finally, tutors can differentiate learners facing an occasional difficulty (i.e. the students whose red nodes appear on the same part of the timeline) from learners facing a failing situation for a longer period of time (i.e. the students whose red nodes are scattered all along the timeline) and who might need more support.
Figure 4 The reflection-on-action tool (see online version for colours)
4.2.3 Implementation
The reflection-on-action tool stands on the traditional client-server architecture. Based on the configuration of the data to analyse, the tool builds the matching query and sends a request to the Lab4CE server side. The set of commands comprised into the response,
encoded using the JSON format, is then parsed to display green or red nodes according to the value of the technical rightness indicator. At the time of the experimentation described in Section 5, no policy rules were applied to restrict access to the data: learners and tutors had the opportunity to investigate any session of any user. However, some work is in progress to integrate access rules according to the role of the connected user: a full access to any session of any user will still be granted to tutors, whereas the access granted to learners will be restricted to their own sessions and those of peers they collaborated with.
4.3 The reflection-in-action tool
4.3.1 Theoretical basis and objectives
In contrast with reflection-on-action, which occurs retrospectively (Matthew and Sternberg, 2009), reflection-in-action occurs in real time (Seibert, 2000). This concept has been originally introduced by Schön (1983): when practitioner fails, (s)he analyses own prior understandings and then “carries out an experiment which serves to generate both a new understanding of the phenomenon and a change in the situation” (Schön, 1983, p.68). Skilled practitioners often reflect-in-action while performing (Jonassen, 1999). Edwards (2004) successfully experimented a test-driven development approach to make computer science students move towards reflection-in-action. In our context, users can reflect-in-action thanks to (web) Terminals: they can scroll up and down the Terminal window to analyse what they have just done and then run a new command and investigate the changes, if any.
However, as stated earlier, research suggested that collaboration and more especially interaction with peers, supports reflection in a more sustainable way (Boud, 1999). The objective of the tool presented below is to strengthen reflection-in-action through peer support by letting users be aware of what others are doing. When students face difficulty, uncertainty or novelty, we intend to let them know how their peers complete tasks. Even if synchronous communication systems might contribute to this process, users need also a live view on both the actions being carried out by peers and the remote resources being operated, to correlate both information and make proper judgements and/or decisions.
4.3.2 Design and learning scenario
The reflection-in-action tool we designed is illustrated on Figure 5 and is accessible to users either through an item of the top main menu, or from the Review session red button available within the user interface of the previous tool (Figure 4). This tool acts as a Terminal player where interactions occurring between users and remote resources during a session and through the web Terminal can be watched as a video stream: both inputs from users and outputs returned back by resources are displayed character by character. The tool features play, pause, resume and stop capacities, while the filtering capabilities of the reflection-on-action tool are also available: users can replay any session of any user to visualise what happened within the web Terminal. When playing the current session stream of a given user, one can get aware, in near real time, of what the user is doing on the resources involved in the practical activity.
During a face-to-face computer education practical session, learners are used to look at the screen of their partners in order to get the exact syntax of source code, to compare results, or to find food for reflection. Our awareness tool aims to reproduce this process
in a remote setting. In Figure 5, the user connected to the system is watching the current session of the learner jbroisin. Since the stream of data played by the tool is updated just after an action is executed by a user through the web Terminal (see implementation details further), the user is provided with a near live view about what jbroisin is doing on the remote resource, and how it reacts to instructions. In addition, combined with the tools presented before, the reflection-in-action tool leverages peer support: learners can easily identify peers performing well and then look at their web Terminal to investigate how they are solving the issues of the practical activity. Lastly, tutors can monitor what learners are doing and even ask them to watch their own Terminal for explanation and demonstration purposes.
Figure 5 The reflection-in-action tool (see online version for colours)
4.3.3 Implementation
This awareness tool implements both the publish-subscribe messaging pattern and the client-server architecture, depending on the practical session to process: the former is used in case of current sessions (i.e. live video streams), whereas the latter is dedicated to completed sessions. When a live session is requested, the matching topic is dynamically created on the Lab4CE server side, and messages are published as soon as commands are carried out by the user being observed. The process suggested to retrieve a completed session that has been described in Section 4.2: a query is sent to the server side, and then results are parsed and interpreted by the tool.
The three tools presented in this section have been designed, coded and integrated into the existing Lab4CE environment. An experimentation based on the enhanced system has then been set up; the design, results and analysis of this study are exposed below.
5 Experimentation
The experimentation presented here investigates the impact of the awareness and reflection tools designed in the previous sections on students’ perception of learning during a practical activity, according to the five following scales: relevance, reflection, interactivity, peer support and interpretation. Our objective was to compare students’ perception of learning while using two different environments: the enhanced Lab4CE system and the traditional computers usually available to students to perform practical activities.
5.1 Design and protocol
The experiment took place in the Computer Science Institute of Technology (CSIT), University of Toulouse (France), and involved 80 first-year students (with a gender repartition of 9 women and 71 men, which reflects the distribution of CSIT students) enrolled in a learning unit about the Linux operating system and Shell programming. The experimentation was conducted for three face-to-face practical sessions that lasted 90 min. These sessions were all related to Shell programming: students had to test Shell commands into their Terminal, and then to write Shell scripts to build interactive programs. Students had also to submit two reports: one about the first session, and the other about the second and third sessions (the work assigned to students required two practical sessions to be completed). These reports had to be posted on a Moodle server 4 days after the matching session, so that students could work during weekends and have extra time to complete their tasks.
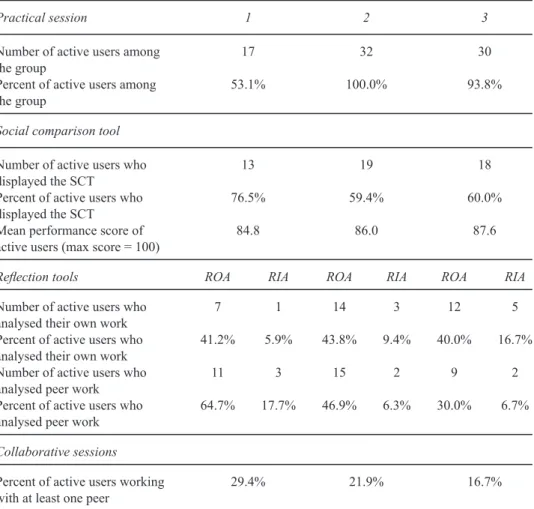
Two groups of students were randomly created. One group of students (i.e. the control group: N = 48, 6 women, 42 men, mean age = 18.8) had access, as usual, to the Debian-based computers of the institution to carry out the practical activities. The other group (i.e. the Lab4CE group: N = 32, 3 women, 29 men, mean age = 18.6) was provided with the enhanced Lab4CE environment; each student had access to a Debian-based virtual machine during each practical session, and their interactions with the remote lab were recorded into the LRS. Two different teachers made a live demo of the Lab4CE features to the Lab4CE group during the first 10 min of the first session. Let us note that, as shown in Table 2, the number of active users within the Lab4CE group during the first session (i.e. 17) is much lower than the number of students (i.e. 32); the fact that learners used a browser hosted by Linux-based computers to access Lab4CE may explain this statistic. During the two other sessions, students had to boot the Windows c system to access our environment.
At the end of the last practical session, both groups of students were asked to fill the constructivist online learning environment survey (COLLES). This questionnaire (Taylor and Maor, 2000) includes twenty-four items using a five-point Likert scale (i.e. almost never, seldom, sometimes, often, almost always) to measure students’ perception of their learning experience, and was applied in various studies (Sthapornnanon et al., 2009; Johnson, McHugo and Hall, 2006; Tierney and Palmer, 2013). The COLLES has been originally designed to compare the preferred learners’ experience (i.e. what they expect from the learning unit) with their actual experience (i.e. what they did receive from the learning unit). In our experimentation, learners actual experience of both groups has been compared: the control group evaluated the Linux computers, whereas the Lab4CE group had to evaluate our system. In addition, the system usability scale (SUS), recognised as a quick and reliable tool to measure how users perceive the usability of a system Brooke (2013), has been delivered to students.
5.2 Results and analysis
5.2.1 COLLES
Among the Lab4CE group, 22 students fulfilled the questionnaire, while 36 learners of the control group answered the survey. The whisker plot of Figure 6 shows the distribution of answers relative to five of the six scales evaluated through the COLLES; the tutor support scale has been removed from our analysis, since our experimentation settings (i.e. face-to-face learning sessions; no tutors connected to the Lab4CE system) did not allow to assess this criteria. Figure 6 also exposes, for each scale, the class mean scores, the first and third quartiles of each group of users.
Figure 6 COLLES survey summary (see online version for colours)
The first scale (i.e. relevance) expresses the learners’ interest in the learning unit regarding future professional practices. The Lab4CE group evaluated the system with a slightly higher mean score and a higher concentration of score distribution. Since this category deals more with the topic of the learning unit itself than the supporting environment, high differences were not expected. However, this scale shows that working on a remote platform featuring awareness tools does not negatively impact learners’ perception regarding the practical skills they have to acquire to success in their future professional practices.
The second scale relates to reflection and critical thinking. Even if the traditional environment assessed by the control group does not provide any awareness and/or reflection tools, the plots do not show a significant difference between both groups, but slightly higher mean score and median for the Lab4CE group only. We make here the hypothesis that learners did not realise they were engaged in the reflection process while consulting the Lab4CE awareness tools. Indeed, according to the system usage statistics shown in Table 2, a mean of almost 42% of the students of the Lab4CE group has used
the reflection-on-action tool to review each of their own sessions. On the other hand, we think that students of the control group have considered the reflection processes occurring within the classroom instead of considering the processes generated through the computer system only.
Feedback from both groups are quite equivalent regarding the interaction scale which measures the extent of learners’ educative dialogue and exchange of ideas. Here, results from the Lab4CE assessment were expected to be higher than those returned by the control group:
i Due to the face-to-face experimental setting, interaction and dialogue between students are independent from the computing environment used to perform the practical activity.
ii The Lab4CE system provides a chat where students can exchange instant text messages, and a total of 166 messages have been posted during the three sessions. In addition, usage statistics show that almost 30% of the Lab4CE students have worked at least once with a peer using the collaborative feature (Section 3.1). Again, we think that students are not aware of being involved in an interaction task when exchanging ideas with peers.
Results about the peer support are also quite the same for both groups, even slightly lower in the Lab4CE group. Besides our previous hypothesis that can explain such unexpected results (here again, 47% of the Lab4CE students have used the reflection-on-action tool to review peers sessions), this scale reveals a potential improvement of our platform. Learners have significantly used the reflection tools to analyse the work done by peers, but the system does not currently provide learners with such awareness information. The peer support scale is about the feeling of learners on how peers encourage their participation, or praise or value their contributions. We believe that providing students with awareness information about analysis performed by peers on their work would increase that perception.
Finally, the last scale aims at evaluating how messages exchanged between students, and between students and tutors, make sense. Scores from the Lab4CE group are characterised by a higher concentration of distribution and a little higher class mean. These results tend to confirm that providing students with reflection tools helps them to get a better comprehension of their interactions with each other.
In addition to the statistics commented in the previous paragraphs and appearing on Table 2, interesting data are the number of peers sessions analysis the day the first report had to be submitted: almost 43% of the Lab4CE students analysed at least one session of a peer using the reflection-on-action tool. We assume that these learners didn’t know how to achieve the objectives of the practical work, and thus sought for help from peers sessions. This hypothesis is supported by usage statistics: the mean level of performance of users whose the session has been analysed is 90 (for a highest score of 100). The table also highlights that the reflection-in-action tool has almost never been used. This trend can be explained by the fact that experimental sessions took place in a classroom where learners could move and watch screens of peers, but also because students seriously used the collaborative Lab4CE feature (as stated above, around 30% of the Lab4CE students have worked collaboratively). It seems that the collaborative tool is more accurate for learners than the reflection-in-action tool, as it allows them to observe the actions of their peers in real-time with the added bonus of letting them work together.
Table 2 Statistics about usage of awareness tools
Practical session 1 2 3
Number of active users among the group
17 32 30
Percent of active users among the group
53.1% 100.0% 93.8%
Social comparison tool
Number of active users who displayed the SCT
13 19 18
Percent of active users who displayed the SCT
76.5% 59.4% 60.0%
Mean performance score of active users (max score = 100)
84.8 86.0 87.6
Reflection tools ROA RIA ROA RIA ROA RIA
Number of active users who analysed their own work
7 1 14 3 12 5
Percent of active users who analysed their own work
41.2% 5.9% 43.8% 9.4% 40.0% 16.7%
Number of active users who analysed peer work
11 3 15 2 9 2
Percent of active users who analysed peer work
64.7% 17.7% 46.9% 6.3% 30.0% 6.7%
Collaborative sessions
Percent of active users working with at least one peer
29.4% 21.9% 16.7%
Finally, the social comparison tool which, by default, is hidden within the user interface (Figure 1), has been displayed by most of users at each session. As shown in Table 2, the percent of users displaying the tool decreases when the level of performance increases. This finding is in line with research about social comparison tools. Their impact on cognitive and academic performance has been thoroughly examined, and main results showed that informing learners of their own performance relative to others encourages learning efforts and increases task performance (Kollöffel and de Jong, 2015; Michinov and Primois, 2005).
5.2.2 System usability scale
The score of the SUS has been computed according to Brooke (1996). The SUS score was 62.4 for the control group, while a SUS score of a 73.6 was attributed to the Lab4CE system. According to Bangor, Kortum and Miller (2009), the Linux-based computers have been evaluated as below than acceptable systems in terms of usability, while Lab4CE has been qualified as good regarding this criteria.
6 Conclusion
We designed in this paper a set of awareness and reflection tools aiming at engaging learners in the deep learning process. These tools stand on a learning analytics framework integrating an enriching engine able to infer meaningful indicators from collected data, and include:
i A social awareness tool revealing to learners their current and general levels of performance, but also enabling the comparison between their own performance and the one of their peers.
ii A reflection-on-action tool, implemented as timelines, allowing learners to deeply analyse both their own completed work and the tasks achieved by peers.
iii A reflection-in-action tool acting as a live video player to let users easily see what others are doing.
These tools have been successfully integrated into the Lab4CE system, our existing remote lab environment dedicated to computer education, before being experimented in an authentic learning context. The objectives of this experimentation were to evaluate, in a face-to-face practical learning setting, students’ perception of learning when performing tasks using the enhanced Lab4CE system, and to compare these measures with their perception of learning when using traditional practical environments. Even if the face-to-face setting might have had a negative impact on the Lab4CE environment evaluation, students rated both environments at the same levels of relevance, reflection and interpretation. Also, students evaluated our remote lab environment as good in terms of usability.
From this experimentation, we also identified new awareness tools that might be of importance to leverage reflection, such as a notification system alerting learners that peers are analysing their work, or dashboards highlighting analysis of their works based on their level of performance. These artefacts will be in the focus of our near future research plans. Finally, the analysis of the experimentation results also emphasise the low levels of interactivity and peer support within our system. We will dive into these broader areas of investigation through the design and integration of scaffolding tools and services such as private message exchanges, recommendation of peers that may bring support or help seeking.
References
Advanced Distributed Learning. (2014) Experience API. Retrieved from https://github.com/adlnet/ xAPI-Spec/blob/master/xAPI-About.md (accessed date: Tuesday 3 January, 2017).
Arango, F., Chang, C., Esche, S.K. and Chassapis, C. (2007) ‘A scenario for collaborative learning in virtual engineering laboratories’, Proceedings of the 37th Annual Frontiers in Education Conference (FIE), IEEE, Milwaukee, pp.F3G-7–F3G-12.
Arnold, K.E. and Pistilli, M.D. (2012) ‘Course signals at purdue: using learning analytics to increase student success’, Proceedings of the 2nd International Conference on Learning Analytics and Knowledge (LAK), ACM, Vancouver, pp.267–270.
Bangor, A., Kortum, P.T. and Miller, J.T. (2009) ‘Determining what individual SUS scores mean: adding an adjective rating scale’, Journal of Usability Studies, Vol. 4, No. 3, pp.114–123.
Bixler, B.A. (2008) The Effects of Scaffolding Student’s Problem-Solving Process via Question Prompts on Problem Solving and Intrinsic Motivation in an Online Learning Environment, Doctoral Thesis, The Pennsylvania State University, State College, Penn.
Bodemer, D. and Dehler, J. (2011) ‘Group awareness in CSCL environments’, Computers in Human Behavior, Vol. 27, pp.1043–1045.
Boud, D. (1999). ‘Situating academic development in professional work: using peer learning’, International Journal for Academic Development, Vol. 4, No. 1, pp.3–10.
Boud, D., Keogh, R. and Walker, D. (1985) ‘What is reflection in learning?’ in Boud, D., Keogh, R. and Walker, D. (Eds.): Reflection: Turning Experience into Learning, RoutledgeFalmer, London and New York, pp.7–17.
Bourner, T. (2003) ‘Assessing reflective learning’, Education and Training, Vol. 45, No. 5, pp.267–272.
Bringle, R.G. and Hatcher, J.A. (1999) ‘Reflection in service learning: making meaning or experience’, Educational Horizons, pp.179–185.
Broisin, J., Venant, R. and Vidal, P. (2015) ‘Lab4CE: a remote laboratory for computer education’, International Journal of Artificial Intelligence in Education, Vol. 25, No. 4, pp.1–27.
Brooke, J. (1996) ‘SUS - a quick and dirty usability scale’, Usability Evaluation in Industry, Vol. 189, No. 194, pp.4–7.
Brooke, J. (2013) ‘SUS: a retrospective’, Journal of Usability Studies, Vol. 8, No. 2, pp.29–40. Buder, J. (2011) ‘Group awareness tools for learning: current and future directions’, Computers in
Human Behavior, Vol. 27, No. 3, pp.1114–1117.
Callaghan, M.J., McCusker, K., Lopez Losada, J., Harkin, J.G. and Wilson, S. (2009) ‘Engineering education island: teaching engineering in virtual worlds’, Innovation in Teaching and Learning in Information and Computer Sciences, Vol. 8, No. 3, pp.1–18.
Chung, S., Chung, M.J. and Severance, C. (1999) ‘Design of support tools and knowledge building in a virtual university course: effect of reflection and self-explanation prompts’, Proceedings of the World Conference on the WWW and Internet Proceedings (WebNet), ERIC, Honolulu, 7p. Collins, A. and Brown, J.S. (1988) ‘The computer as a tool for learning through reflection’, in Mandl,
H. and Lesgold, A. (Eds.): Learning Issues for Intelligent Tutoring Systems, Springer US, New York, pp.1–18.
Crippen, K.J. and Earl, B.L. (2007) ‘The impact of Web-based worked examples and self-explanation on performance, problem solving, and self-efficacy’, Computers & Education, Vol. 49, No. 3, pp.809–821.
Davis, D., Trevisan, M., Leiffer, P., McCormack, J., Beyerlein, S., Khan, M.J. and Brackin, P. (2013) ‘Reflection and metacognition in engineering practice’, in Kaplan, M., Silver, N., Lavaque-Manty, D. and Meizlish, D. (Eds.): Reflection and Metacognition to Improve Student Learning: Across the Disciplines, Across the Academy, Stylus, Sterling, pp.78–103.
de Jong, T., Linn, M.C. and Zacharia, Z.C. (2013) ‘Physical and virtual laboratories in science and engineering education’, Science, Vol. 340, No. 6130, pp.305–308.
de la Torre, L., Heradio, R., Jara, C., Sanchez, J., Dormido, S., Torres, F. and Candelas, F. (2013) ‘Providing collaborative support to virtual and remote laboratories’, IEEE Transactions on Learning Technologies, Vol. 6, No. 4, pp.312–323.
Dewey, J. (1933) How We Think: A Restatement of the Relation of Reflective Thinking to the Educative Process, Houghton Mifflin, Boston.
Durall, E. and Leinonen, T. (2015) ‘Feeler: supporting awareness and reflection about learning through EEG data’, Proceedings of the 5th Workshop on Awareness and Reflection in Technology-Enhanced Learning (ARTEL), CEUR, Toledo, pp.67–73.
Edwards, S.H. (2004) ‘Using software testing to move students from trial-and-error to reflection-in-action’, ACM SIGCSE Bulletin, Vol. 36, No. 1, pp.26–30.
Fayolle, J., Gravier, C. and Jailly, B. (2010) ‘Collaborative remote laboratory in virtual world’, Proceedings of the 10th International Conference on Applied Informatics and Communications (AIC), WSEAS, Taipei, pp.1–8.
Fessl, A., Wesiak, G. and Luzhnica, G. (2014) ‘Application overlapping user profiles to foster reflective learning at work’, Proceedings of the 4th Workshop on Awareness and Reflection in Technology-Enhanced Learning (ARTEL), CEUR, Graz, pp.51–64.
Garcia-Zubia, J., Irurzun, J., Angulo, I., Hernandez, U., Castro, M., Sancristobal, E., Orduña, P. and Ruiz-de-Garibay, J. (2010) ‘SecondLab: a remote laboratory under second life’, Proceedings of the 2010 IEEE Global Engineering Education Conference (EDUCON), IEEE, Madrid, pp.351–356.
Goleman, D. (1996) ‘Emotional intelligence. Why it can matter more than IQ’, Learning, Vol. 24, No. 6, pp.49–50.
Govaerts, S., Verbert, K., Klerkx, J. and Duval, E. (2010) ‘Visualizing activities for self-reflection and awareness’, Proceedings of the 9th International Conference on Web-Based Learning (ICWL), Springer, Shanghai, pp.91–100.
Harward, V.J., del Alamo, J.A., Lerman, S.R., Bailey, P.H., Carpenter, J., DeLong, K., Felknor, C., Hardison, J., Harrison, B., Jabbour, I., Long, P.D., Tingting, M., Naamani, L., Northridge, J., Schulz, M., Talavera, D., Varadharajan, C., Shaomin, W., Yehia, K., Rabih, Z. and Zych, D. (2008) ‘The iLab shared architecture: a web services infrastructure to build communities of internet accessible laboratories’, Proceedings of the IEEE, Vol. 96, No. 6, pp.931–950. Hiemstra, R. (2001) ‘Uses and benefits of journal writing’, New Directions for Adult and Continuing
Education, Vol. 2001, No. 90, pp.19–26.
Howlin, C. and Lynch, D. (2014) ‘Learning and academic analytics in the realizeit system’, Proceedings of the E-Learn: World Conference on E-Learning in Corporate, Government, Healthcare, and Higher Education (E-learn), AACE, New Orleans, pp.862–872.
Janssen, J. and Bodemer, D. (2013) ‘Coordinated computer-supported collaborative learning: awareness and awareness tools’, Educational Psychologist, Vol. 48, No. 1, pp.40–55.
Jara, C.A., Candelas, F.A., Torres, F., Dormido, S. and Esquembre, F. (2012) ‘Synchronous collaboration of virtual and remote laboratories’, Computer Applications in Engineering Education, Vol. 20, No. 1, pp.124–136.
Jermann, P. (2004) Computer Support for Interaction Regulation in Collaborative Problem-Solving, Unpublished Doctoral Thesis, University of Geneva, Switzerland.
Johnson, K., McHugo, C. and Hall, T. (2006) ‘Analysing the efficacy of blended learning using technology enhanced learning (TEL) and m-learning delivery technologies’, Proceedings of the 23rd ASCILITE Conference, Sydney University Press, Sydney, pp.3–6.
Jonassen, D.H. (1999) ‘Designing constructivist learning environments’, Instructional Design Theories and Models: A New Paradigm of Instructional Theory, Vol. 2, pp.215–239.
Kist, A.A., Maxwell, A., Gibbings, P., Fogarty, R., Midgley, W. and Noble, K. (2011) ‘Engineering for primary school children: learning with robots in a remote access laboratory’, Proceedings of the 39th SEFI Annual Conference: Global Engineering Recognition, Sustainability and Mobility (SEFI), University of Southern Queensland, Lisbon.
Kollöffel, B. and de Jong, T. (2015) ‘Can performance feedback during instruction boost knowledge acquisition? Contrasting criterion-based and social comparison feedback’, Interactive Learning Environments, pp.1–11.
Kostulski, T. and Murray, S. (2011) ‘Student feedback from the first national sharing trial of remote labs in Australia’, Proceedings of the 8th International Conference on Remote Engineering and Virtual Instrumentation (REV), International Association of Online Engineering, Brasov, pp.203–211.
Lockyer, J., Gondocz, S.T. and Thivierge, R.L. (2004) ‘Knowledge translation: the role and place of practice reflection’, Journal of Continuing Education in the Health Professions, Vol. 24, No. 1, pp.50–56.
Lowe, D. (2013) ‘Integrating reservations and queuing in remote laboratory scheduling’, IEEE Transactions on Learning Technologies, Vol. 6, No. 1, pp.73–83.
Lowe, D., Murray, S., Lindsay, E. and Liu, D. (2009) ‘Evolving remote laboratory architectures to leverage emerging internet technologies’, IEEE Transactions on Learning Technologies, Vol. 2, No. 4, pp.289–294.
Lowe, D., Newcombe, P. and Stumpers, B. (2013) ‘Evaluation of the use of remote laboratories for secondary school science education’, Research in Science Education, Vol. 43, No. 3, pp.1197–1219.
Matthew, C.T. and Sternberg, R.J. (2009) ‘Developing experience-based (tacit) knowledge through reflection’, Learning and Individual Differences, Vol. 19, No. 4, pp.530–540.
Maxwell, A., Fogarty, R., Gibbings, P., Noble, K., Kist, A. and Midgley, W. (2013) ‘Robot RAL-ly international-Promoting STEM in elementary school across international boundaries using remote access technology’, Proceedings of the 10th International Conference on Remote Engineering and Virtual Instrumentation (REV), International Association of Online Engineering, Sydney, pp.1–5.
Means, B., Toyama, Y., Murphy, R., Bakia, M. and Jones, K. (2009) Evaluation of Evidence-Based Practices in Online Learning: A Meta-Analysis and Review of Online Learning Studies, U.S. Department of Education. Retrieved 12 November 2015, from http://files.eric.ed.gov/fulltext/ED505824.pdf.
Michinov, N. and Primois, C. (2005) ‘Improving productivity and creativity in online groups through social comparison process: new evidence for asynchronous electronic brainstorming’, Computers in Human Behavior, Vol. 21, No. 1, pp.11–28.
Mikroyannidis, A., Gomez-Goiri, A., Domingue, J., Tranoris, C., Pareit, D., Vanhie-Van Gerwen, J. and Marquez-Barja, J. (2015) ‘Deploying learning analytics for awareness and reflection in online scientific experimentation’, Proceedings of the 5th Workshop on Awareness and Reflection in Technology Enhanced Learning (ARTEL), CEUR, Toledo, pp.105–111.
Miller, T. (2009) ‘Formative computer-based assessment in higher education: the effectiveness of feedback in supporting student learning’, Assessment & Evaluation in Higher Education, Vol. 34, No. 2, pp.181–192.
Moon, J.A. (1999) Reflection in Learning and Professional Development: Theory and Practice, Psychology Press, Kogan Page Limited, London.
Nickerson, J.V., Corter, J.E., Esche, S.K. and Chassapis, C. (2007) ‘A model for evaluating the effectiveness of remote engineering laboratories and simulations in education’, Computers & Education, Vol. 49, No. 3, pp.708–725.
Odeh, S. and Ketaneh, E. (2012) ‘E-collaborative remote engineering labs’, Proceedings of the 2012 IEEE Global Engineering Education Conference (EDUCON), IEEE, Marrakesh, pp.1–10. Prensky, M. (2011) ‘Khan academy’, Educational Technology, Vol. 51, No. 5, pp.64–66. Ramsden, P. (1988) Improving Learning: New Perspectives, Kogan Page, London.
Ricketts, C. and Wilks, S.J. (2002) ‘Improving student performance through computer-based assessment: insights from recent research’, Assessment & Evaluation in Higher Education, Vol. 27, No. 5, pp.475–479.
Saab, N., van Joolingen, W. and van Hout-Wolters, B. (2012) ‘Support of the collaborative inquiry learning process: influence of support on task and team regulation’, Metacognition and Learning, Vol. 7, No. 1, pp.7–23.
Salzmann, C., Govaerts, S., Halimi, W. and Gillet, D. (2015) ‘The smart device specification for remote labs’, Proceedings of the 12th International Conference on Remote Engineering and Virtual Instrumentation (REV), IEEE, Bangkok, pp.199–208.
Sancristobal, E., Castro, M., Harward, J., Baley, P., DeLong, K. and Hardison, J. (2010) ‘Integration view of web labs and learning management systems’, Proceedings of the 2010 IEEE Global Engineering Education Conference (EDUCON), IEEE, Madrid, pp.1409–1417.
Scheucher, B., Bailey, P.H., Gütl, C. and Harward, J.V. (2009) ‘Collaborative virtual 3D environment for internet-accessible physics experiments’, International Journal of Online Engineering, Vol. 5, No. S1, pp.65–71.
Schneider, D., Class, B., Benetos, K. and Lange, M. (2012) ‘Requirements for learning scenario and learning process analytics’, Proceedings of the World Conference on Educational Multimedia, Hypermedia and Telecommunications (EDMEDIA), AACE, Denver, pp.1632–1641.
Schön, D.A. (1983) The Reflective Practitioner: How Professionals Think in Action, Basic Books, New York, USA.
Seibert, K.W. (2000) ‘Reflection-in-action: tools for cultivating on-the-job learning conditions’, Organizational Dynamics, Vol. 27, No. 3, pp.54–65.
Shieh, R.S. (2012) ‘The impact of technology-enabled active learning (TEAL) implementation on student learning and teachers’ teaching in a high school context’, Computers & Education, Vol. 59, No. 2, pp.206–214.
Stedman, N.L. and Andenoro, A.C. (2007) ‘Identification of relationships between emotional intelligence skill and critical thinking disposition in undergraduate leadership students’, Journal of Leadership Education, Vol. 6, No. 1, pp.190–208.
Sthapornnanon, N., Sakulbumrungsil, R., Theeraroungchaisri, A. and Watcharadamrongkun, S. (2009) ‘Social constructivist learning environment in an online professional practice course’, American Journal of Pharmaceutical Education, Article number 10, Vol. 73, No. 1.
Strampel, K. and Olivier, R. (2007) ‘Using technology to foster reflection in higher education’, Proceedings of ICT: Providing Choices for Learners and Learning (ICT), Singapore.
Sweller, J. (1994) ‘Cognitive load theory, learning difficulty, and instructional design’, Learning and Instruction, Vol. 4, No. 4, pp.295–312.
Taylor, P. and Maor, D. (2000) ‘Assessing the efficacy of online teaching with the constructivist online learning environment survey’, Proceedings of the 9th Annual Teaching Learning Forum, Curtin University of Technology, Perth, 7p.
Tee, K., Greenberg, S. and Gutwin, C. (2006) ‘Providing artifact awareness to a distributed group through screen sharing’, Proceedings of the 20th Conference on Computer Supported Cooperative Work (CSCW), ACM, Banff, pp.99–108.
Tierney, R. and Palmer, M. (2013) ‘Participation interaction and learner satisfaction in a professional practice Wiki for teachers’, in Power, A. and Kirwan, G. (Eds.): Cyberpsychology and New Media: A Thematic Reader, Psychology Press, London and New York, pp.195–214.
Wang, K.H., Wang, T.H., Wang, W.L. and Huang, S.C. (2006) ‘Learning styles and formative assessment strategy: enhancing student achievement in web-based learning’, Journal of Computer Assisted Learning, Vol. 22, No. 3, pp.207–217.
Webb, G. (1997) ‘Deconstructing deep and surface: towards a critique of phenomenography’, Higher Education, Vol. 33, No. 2, pp.195–212.
Wilson, J. and Jan, L.W. (2008) Smart Thinking: Developing Reflection and Metacognition, Curriculum Corporation, Primary English Teaching Association, Marrickville.
Xie, Y., Ke, F. and Sharma, P. (2008) ‘The effect of peer feedback for blogging on college students’ reflective learning processes’, The Internet and Higher Education, Vol. 11, No. 1, pp.18–25. Yang, S.H. (2009) ‘Using blogs to enhance critical reflection and community of practice’, Journal of