Publisher’s version / Version de l'éditeur:
Journal of the Society of Petroleum Engineers, 9, 2, pp. 95-102, 1994-06-01
READ THESE TERMS AND CONDITIONS CAREFULLY BEFORE USING THIS WEBSITE. https://nrc-publications.canada.ca/eng/copyright
Vous avez des questions? Nous pouvons vous aider. Pour communiquer directement avec un auteur, consultez la
première page de la revue dans laquelle son article a été publié afin de trouver ses coordonnées. Si vous n’arrivez pas à les repérer, communiquez avec nous à [email protected].
Questions? Contact the NRC Publications Archive team at
[email protected]. If you wish to email the authors directly, please see the first page of the publication for their contact information.
NRC Publications Archive
Archives des publications du CNRC
This publication could be one of several versions: author’s original, accepted manuscript or the publisher’s version. / La version de cette publication peut être l’une des suivantes : la version prépublication de l’auteur, la version acceptée du manuscrit ou la version de l’éditeur.
For the publisher’s version, please access the DOI link below./ Pour consulter la version de l’éditeur, utilisez le lien DOI ci-dessous.
https://doi.org/10.2118/24224-PA
Access and use of this website and the material on it are subject to the Terms and Conditions set forth at
Fatigue testing of drillpipe
Grondin, G. Y.; Kulak, G. L.
https://publications-cnrc.canada.ca/fra/droits
L’accès à ce site Web et l’utilisation de son contenu sont assujettis aux conditions présentées dans le site
LISEZ CES CONDITIONS ATTENTIVEMENT AVANT D’UTILISER CE SITE WEB.
NRC Publications Record / Notice d'Archives des publications de CNRC:
https://nrc-publications.canada.ca/eng/view/object/?id=7eba31ef-6de6-4d03-8549-8d7a110a2078 https://publications-cnrc.canada.ca/fra/voir/objet/?id=7eba31ef-6de6-4d03-8549-8d7a110a2078
http://www.nrc-cnrc.gc.ca/irc
Fa t igue t e st ing of drillpipe
N R C C - 4 1 3 3 0
G r o n d i n , G . Y . ; K u l a k , G . L .
J u n e 1 9 9 4
A version of this document is published in / Une version de ce document se trouve dans:
Journal of the Society of Petroleum Engineers, 9, (2), pp. 95-102, June 01, 1994,
DOI:
10.2118/24224-PAThe material in this document is covered by the provisions of the Copyright Act, by Canadian laws, policies, regulations and international agreements. Such provisions serve to identify the information source and, in specific instances, to prohibit reproduction of materials without written permission. For more information visit http://laws.justice.gc.ca/en/showtdm/cs/C-42
Les renseignements dans ce document sont protégés par la Loi sur le droit d'auteur, par les lois, les politiques et les règlements du Canada et des accords internationaux. Ces dispositions permettent d'identifier la source de l'information et, dans certains cas, d'interdire la copie de documents sans permission écrite. Pour obtenir de plus amples renseignements : http://lois.justice.gc.ca/fr/showtdm/cs/C-42
••
Fatigue Testing of Drillpipe
G.V. Grondin' and G.L. Kulak'" NaIl. Research Council of CanadaSummary.Twenty-nine tests in air and 27 tests in a 3.5% NaCl solution were conducted to test the fatigue strength of Grade E 4.5-in.-OD, 16.6-lbmlft [114-J1U11-0D, 24.7-kg/rn] drillpipe. The effects of stress range, mean stress, corrosion, and upset geometry were tested on the drillpipe body alone and on specimens that included the tcoljoint, upset, and drillpipe body. Stress range and mean stress effects were
signif-icant in noncorrosive and corrosive environments. The effect of upset geometry wasminimalon an external upset comparedwiththat on
an internal/external upset. Among the specimens that failed, grinding marks on the drillpipe surface, which occurred during inspection at the mill, caused failure of about 60% of the specimens. Grinding created a notch effect and induced a detrimental residual-stress pattern on the pipe surface, which decreased drillpipe fatigue life. API guidelines for cumulative fatigue of Range 2 drillpipe were evaluated in light of these experimental test results and were found to be unsafe for drilling in noncorrosive conditions and possibly too conservative for corrosive conditions.
Introduction
Fatigue damage occurs when a drillpipe is subjected to sufficiently high alternating stresses, such as those created when the drillpipe ro-tates in the curve of a wellbore. Drillpipe fatigue failure has been a serious concern in the oil industry ever since sections of drillpipe were first joined to permit drilling at depths greater than one length
of drillpipe. l-4This prohlem was addressed by imposing dogleg
se-verity limitsS based on test results published in the early 1950IS.6
These tests were satisfactory for their intended use (Le., testing of tool-joint welds). However, these tests were not performed in a」ッイセ
rosive environment or under axial tension, two factors considered important in current API guidelines.5 DUring these tests, the effect of corrosion was addressed by use of simplifying assumptions with respect to the decrease in fatigue strength in a corrosive environ-ment. The effect of mean stress was dealt with by use of a modified Goodman 'equation for the endurance limit and a standard Goodman
equation for stresses above the endurance limit 7-9
Published fatigue-test data on full-sized drillpipe are limited. Tests perfonned by Hughes Tool Co. still represent a major con-tribution toward better understanding of drillpipe fatigue strength.6 More recently, the Chinese Petroleum Standardization Committee presented the results of an investigation on the effect of the geome-try of the transition zone between the drillpipe body and the upset. lO Full-sized drillpipes with transition zones of various lengths and ra-dii were tested in air as cantilever rotating beams under no axial load. Fatigue resistance improved as the length of the transition zone increased.
Tsukano et al. ll shed some light on the effect of upset/pipe-body transition-zone geometry in their investigation of the internal-upset drillpipe geometry using finite·element analysis and tests. They sought a combination of taper length and radius of ronout that would cause fatigue failure in the drillpipe body rather than in the pipe-body/upset transition ZOne. To verify the results of the finite-ele-ment investigation, full-sized specimens were tested in four-point
イッエ。イケセ「・ョ、ゥョァ arrangements in air at ahighstress range (location of crack initiation was the only factor investigated).
Recommenda-tions were made for suitable internal-upset geometryto prevent
drillpipe failure in the upset region.
The drilling industg recognizes corrosion as a main factor affect-ing fatigue life.3,8,12,1 The effect of corrosive environment on drill-pipe fatigue life has been investigated with small steel samples, but
this effect onヲオャャセウゥコ・、 drillpipe has not been compared with test
re-sults from similar drillpipes tested in air. Joostenet al.14tested 3-ft
[0.9-m] lengths of3'h-in. [89-mm] -diameter Grade G-105 drillpipe loaded in three-point bending. Tests were conducted in air and in KCVseawater solution. Only results of tests in a corrosive environ-ment were published. 14 Consequently, resistance in air and in a cor-rosive environment cannot be compared from their published data. Iu 1988; Dale tS presented the results of a test program on API drillpipe steels conducted to detennine the influence of drilling-fluid environment on fatigue-crack growth rate. Although the
pro-"Now at Memorial U. '''Now at U. of Alberta
Copyright 1994 Society of Petroleum Engineers
SPE Drilling & Completion, June 1994
gram mainly studied fatigue in a full-sized drill collar, it also in-cluded a series of fatigue tests on coupon specimens in drilling muds of various composition. The tests, conducted at a 5-Hz frequency, showed no significant effect of drilling mud corrosivity on crack growth rate.
Helbig and Vogtl6 presented the results of a study on drillpipe fa-tigue life in a corrosive environment that investigated the effect of heat treatment on Grades D, E, and S-135 drillpipe. Full-sized sec-tions of drillpipe bodies were fatigue tested in two corrosive envi-ronments: tap water and 20% NaCI solution. The test results did not indicate a significant difference between nonnalized and quenched-and-tempered specimens or between the two test environments. From their tests on coupon specimens, Helbig and Vogt demon-strated that the speed of testing is influential when tests are con-ducted in a corrosive environment. Fatigue life was reduced signifi-cantly when tbelesting frequency was decreased from 1,000 to 100 rev/min; the amount of reduction depended on the stress range at which the tests were conducted. All the tests of Helbig and Vogtl6 on full-sized drillpipe were performed in a corrosive environment. Consequently, fatigue life of full-sized drillpipe in air and in a
corro-sive environment cannotbe compared with their data. No
exper-ゥュ・ョセャ investigation to date has specifically addressed the problem of the effect of mean stress on the fatigue life of full-sized drillpipe operating in air or in a corrosive environment.
As the search for petroleum moves into more-hostile environ-ments that require drilling to greater depths and in more-corrosive media, the oil industry is again confronted with the problem of drill-pipe fatigue. One failure is estimated to occur for every 6,500 ft [1980 m] drilled, inclUding drillpipe separations and washouts. 17 Most drillpipe failures generally are agreed to result from metal fa-tigue. Recent publications show that drillpipe failure is still a serious concern of drilling contractors.3,14.17 More research is therefore re-quired to determine the effect of such parameters as mean stress and corrosion on drillpipe fatigue life.
Experimental Program
A preliminary test programt8 on full·sized drillpipe specimens that incorporated the tool joint, upset ends, and drillpipe hody showed that failures in the field could be duplicated in the laboratory. Pre-liminary testing was done under cyclic tension and bending.
A full program was then designed to investigate the effects of stress range, mean stress, and corrosion on drillpipe fatigue lifeオョセ
der rotational bending. Full·sized API Grade E 4V,-in.-OD, 16.6-lbmlft [114-mm-OD, 27.4-kglm] drillpipes with internallex. ternal upsets were tested. Test specimens were prepared so that the tool joint, upset region, and part of the pipe body could be incorpo-rated in the test section. Testing showed that failures in all speci-mens except one occurred in the drillpipe body, not the tool joint or upset region. For this reason and for reasons of economy, half the test specimens were sections taken from only the drillpipe body. Test Setup
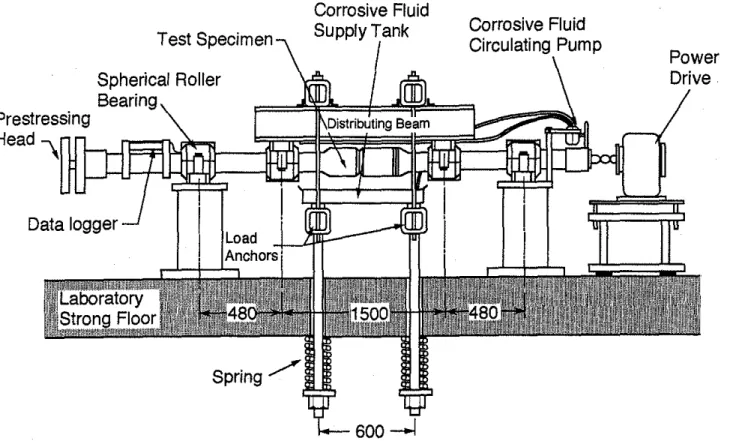
A rotatinglbending test frame that could test full-sized drillpipe un-der axial preload was designed to simulate field conditions. The test
•
•
---.
Test Specimen
Spherical Roller
Bearing
Prestressing
Head "\
Data logger
Corrosive Fluid
Supply Tank
Corrosive Fluid
Circulating Pump
Power
Drive
Fig. 1-Dlagram 01 rotatlnglbendlng test setup (all units ara given In millimeters).
frame, shown as a schematic in Fig. I. uses a simply supported rotat-ing beam under two-point loadrotat-ing to provide a region of constant moment 59 in. [1500 mm]long. The test frame was designed so that specimens np to 5.3 in. [135 mm) in diameter could be rotated
under a deflected configuration equivalent to a doglegwitha
severi-ty in excess of 100'/100 ft(98'/30 m] st up to 7 Hz. The tensile
axial load was introducedby a preloading apparatus. A prestressing
rod was inserted and centered in the drillpipe and put into」ッューイ・ウセ
sianbyspecial end fittings attached to the pipe. The configuration
was such that the pipe sustained an equal and opposite tensile force. and the whole arrangement allowed pipe rotation under the pre-loaded condition. The preload level was established and then moni-tored with strain gauges on both the prestressing rod and the pipe. These readings were taken off the rotating pipe with an electronic data logger. Ref. 19 gives full details of the prestressing arrange-ment, the test setup, and the testing procedure.
Three levels ofaxii11 load were investigated: zero axial preload, which is what has commonly been used in the past; 18 ksi [125 MPa](axial ioad of 79 kip [350 kN)), which corresponds to
the stress at the drillstring top if drilling is carried 5,000 ft
[1525 m] in a IS-Ibm/gal [L80-kglL) drilling mud, and 36 ksi [250 MPa](axialload ofl58 kip (700 kN)), which corresponds to
the stress at the drillstring top when drilling to 10,000 ft(3050 m].
For corrosion fatigue tests, 3.5% NaCI solution was sprayed on the test specimens at 0.53 gal/min (2.0 Umin] during testing.
Be-cause corrosion is time-dependent, testing frequency is anゥューッイセ
tant factor in a corrosive environment In the field, drillpipe is sub-jected to high and low stress cycles and, consequently, is expected to last longer than pipe tested at a constant high stress range. Thus, tests in a corrosive environment were run at 1.0 Hz, or lower than the 1.5 Hz commonly used in the field, Because of the lower testing frequency, drillpipes were exposed to the corrosive environment for a longer period. Consequently, test results should correlate better with field conditions.
The test program was complemented by microscopic examina· tion of the failed specimens to determine the origin of fatigue fail-ure, Because residual stresses may obliterate the effect of mean
stress on drillpipe fatigue life. extensiveイ・ウゥ、オ。ャセウエイ・ウウ ュ・。ウオイ・セ
ments were made,xセイ。ケ diffraction was used to measure local
resid-ual stresses, which are influential during the crack initiation stage
96
of fatigue life. Metallographic examination of the microstructures of drlUpipes from different sources was also performed.
Test Results
Noncorrosive Environment. Results from test in air are presented schematically in Fig. 2. In Fig. 20, the mean stress was kept at 18 ksi [125 MPa] and the stress range was varied from 26 to 51 ksi (180
to350 MPa]. The effects of mean stress are presented in Fig. 2b.
Mean stress was varied from 0 to 36 ksi (250 MPa], and the stress range was kept at 42 ksi [290 MPa]. Statistical analysis of test re-sults showed that the logarithm of fatigue life is directly
proportion-al to the square of mean stress.muャエゥーj・Mャゥョ・。イセイ・ァイ・ウウゥッョ analysis
of data from tests in air was performed to obtain an expression for the effect of stress range and mean stress on drillpipe fatigue life. For tests that were interrupted before specimen failure. the number of cycles applied to the specimen was conservatively used for the re-gression analysis. The relation between fatigue life and mean stress and stress range can be expressed as
10gN= 11.9-3.47 loga,-7.85 x 10⁻⁴(a)2 • ... (I)
In SI metric units. constants 11.9 and 7.85X10⁻⁴ are 14.8 and
1.65 x 10⁻⁵, respectively, This expression is applicable for the load-ing conditions used durload-ing the experimental investigation (Le., stress range between 26 and 51 ksi [180 and 350 MPa] and mean
stress between
o
and 36 ksi [250 MPa)). Standard deviation is 0.50for the data around the mean regression line. The stress range and the mean stress were both found to be statistically significant at a confidence level of 95%.19
Corrosive Environment. Fig. 3 shows results from tests in a 3.5% NaCI solution. Fig. 3a presents the effect of stress range, investi-gated at a mean stress of 18 ksi [125 MPa]. One specimen. tested at a stress range of 23 ksi [160 MPa). failed prematurely at 422.300 cycles. compared with an average of 1,699.100 cycles for two other specimens tested under the same conditions. The prema-ture failure was caused by a steel stencil mark on the drillpipe body. We did not include this specimen in the regression analysis because stencil marking is not generally used on the drillpipe body and the presence of the marking on the test specimen is considered excep-tional. Furthermore, such practice has long been recognized as
000 70 400 eo
"'"
70 50"'"
'"
400 50Lo
"
!
'o, 50 30r
I:
•
•
•
•
'"
!
r
•
!"
r
!"
I
••
•
,.
mT811 0.'.•
•
•
30 !J
'00 _oT881l'esut1lxdll4ldMalin Regre88lon UneIromI
•
I
•
T8lIIDIal•
..
"
MNn S1ten_125 MPatII8regrfllflllon analyll."
- - MNn RegrMlllonUne T88Ifイ・。Nオ・ョ」ケNQNPセ-
lelt Inlerrupladセ"
laIlUt801apeclmen セod•
,
MNnStre...18kel(125 MPa)
"
"
'00
"
Nun'll*' 01 Cyel.,,'
,,'
,,'
,,'
,,'
NU!Tlb«o1 CyclM (a) Effcct ofStressRange on Fatigue Ufe
(0) Effect ofSlreIsRansc on Fatigue Life
(b)Effect orMean StressonFatigue Life
,"'"
•
-!
\ 000I
i
"'"
..
-
! ! Ii 0,,'
,,'
• •
•
•
•
.. TllGi Oall - - m・。ョr・ァセuiャャゥャ . . Testlnlerrupted bIlore IaUuI1loIl1f)llClmen oセM]BBLBLBセBセNZ[B]BBBBLLLLLLLLLm]pGZAGZBB__NNNNQLM⦅セセNNNj
103 10· 10m 10· NumberofCyel. (b) EffCdofMeanStmsonFatigllcUfc "000 "000Fig. 2-SIN curv•••howlng r.sults of (a) str••o rong. ond (b) mean stress fatigue tests conducted in air.
Fig. 3-SIN curv.s ohowlng r.oulto of (a) otr.oo rang. ond (b) mean stress fatigue tests conducted In a 3.5% NaCI solution.
detrimental to drillpipe life, and the drilling industry has been cau-tioned against it.2Observe that the scatter in the test results is
signifi-cantly lower than theSCatterobserved in results from tests a
noncor-rosive environment. Fig. 3b presents the effect of mean stress on fatigue life at three different levels of stress range: the square of the mean stress is plotted vs. fatigue life. Because of the lower scatter observed in the corrosion fatigue-test results and the time-consum-ing nature of tests in a corrosive environment (a stime-consum-ingle test can take from 1 to 16 weeks), most tests were repeated only twice.
Multiple-linear-regression analysis of results from tests in a 3.5% NaCI solution yields the following expression for mean fatigue life,
N,as a function of the stress range,Ur,and the mean stress,
a
logN= 9.56-2.35 loga,-2.63x 10⁻⁴«(i)2. . (2)
In SI metric units. constants 9.56 and 2.63 x 10⁻⁴ are 11.53 and 5.54 x 10⁻⁶. respectively. Standard deviation is 0.12 for the data
around the mean regression line.Eq.2 is applicable in a 3.5% NaCI
solution for mean stresses from 0 to 36 ksi [0 to 250 MPal. a stress range between 13 and 42 ksi [90 and 290 MPal. and a testing
fre-quency of1.0Hz. Again, statistical analysis of the regression
coeffi-cients indicated that, at a confidence level of 95%, both the stress range and mean stress significantly affect fatigue life.
Fig. 4 compares the mean fatigue curve for a corrosive vs. a non-corrosive environment, with both curves at a mean stress level of 18
ksi [125 MPa].Itis evident from the curves that acorrosive
environ-ment negatively affects drillpipe fatigue life. It is also evident that fatigue life is reduced more at lower stress ranges, which is thought to be the consequence of the time dependence of the corrosion pro-cess; at lower stress ranges, the drillpipe is exposed to the corrosive environment for a longer period.
Origin of Fatigue Failures
Fatigue failures ofspecimens tested in corrosive or noncorrosive en-vironments were observed to originate on the outer surface of the drillpipe. These results contradict those of previous failures in the
field, which were reported to originate on the inner surface of the drillpipe.2,7,10 For the pipes we tested in a corrosive environment, fatigue cracks were expected to start on the outer surface because the, outer surface (not the inner surface) of the drillpipe was in con-tact with the corrosive environment. Drillpipes tested in air also are more likely to fail from cracks originating on the outer surface of the drillpipe, where bending stresses are larger. However, bending stresses on the inner pipe surface are not that much lower than on the outer surface because the drillpipe wall is relatively thin. Thus, such factors as drilling fluid velocity, amount of entrained oxygen, and presence of scale may overshadow the stress difference between the outer and inner surfaces of pipe used in the field. Furthermore, the cleansing action of the drillpipe outer surface rubbing against the borehole wall is thought to lessen the effects of corrosion on the
out-er surface vs. the innout-er surface.13Inthe laboratory, where
environ-mental conditions are either the same on the inner and outer surfaces (tests in air) or more severe on the outer surface (tests in a corrosive environment), the outer surface is prone to fatigue-crack initiation. All bot two specimens failed in the drillpipe body away from the upset ronout. The effect of upset geometry on stress concentration in tbe drillpipe body was investigated witb the finite-element
meth-od.19 As expected, this showed that a concentration of stresses
ex-ists in the pipe body next to the transition zone between the upset and the pipe body. The stress concentration factor (ratio of maximum stress calculated in the upset region to nominal pipe-body stress) for
standard intemal./extemal-upset geometry20 was1.17for axial
ten-sion and1.10for pure bending. Examination of the upset geometry
on the test specimens showed a wide variation in the length of the transition zone (from 1.0 to 3.0 in. [25 to 75 mm]). The lengtb of the transition zone varied not only among drillpipes but also around the drillpipe perimeters. We also found that the transition zone is gener-ally rounded, which results in a more gradual change in wall thick-ness and a less-severe stress concentration than for the straight-line
transition assumed in the analysis. Therefore, itis possible that
slight imperfections,on the outer surface of the drillpipe body can overshadow the effect of stress concentration at the transition zone.
400
l
!.300f
: 200i
" " " " , _ , /' Air ',oF "...
'" NaCI Solullon -ャPPlNNMMMMMセMBGBZ⦅MMMM ...セNNNNNNNZャ 10 5 10 6 Numb.ofCyclesFig. 4-SIN curve showing the effect of corrosIve environment on drillplpe fetlgue strength.
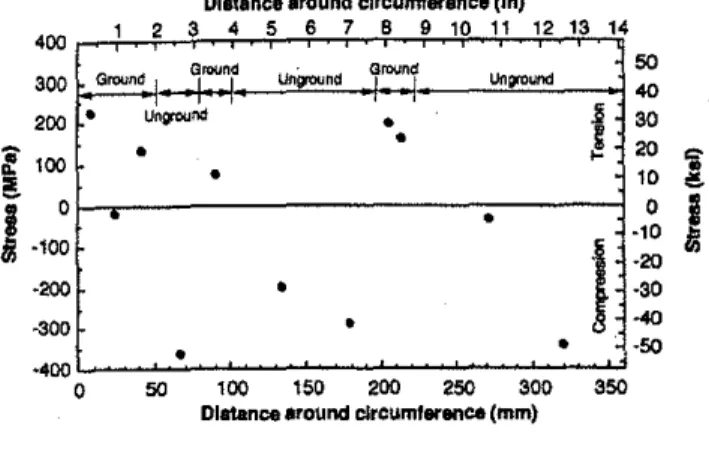
Fig. 5-Graph showing residual stresses on the outer surface of e drillplpe.
log N=13.31-4.5610gCl, • •. ; •••••••••••••.••••••••• (3)
Background: API Guidelines on Drillpipe Fatigue
Effect of Stress Range and Mean Stress in Noncorrosive Envi· ronments. Current guidelines for drillpipe fatigue evolved from the works of Lubinski7 and Hansford and Lubinski.8.9These analytical
studies used・クセ・イゥュ・ョエ。ャ fatigue data presented earlier by
Bach-man.6 Lubinski used a lower-boundary curve in the test data of Bachman to predict fatigue life. The experiments of Bachman were
satisfactory for their intended use, namely testing of theエッッャセェッゥョエャ
drillpipe connection. However, these experiments were not per-fonned in a corrosive environment or under axial tension. The SIN curve Lubinski7 and, later, Hansford and Lubinski8 used for their analytical work in a noncorrosive environment can be expressed as 5 shows the residual-stress distribution measured around the
cir-cumference of one section of drillpipe. Areas of grinding are identip
tied in this figure. Residual stresses measured in the upset region of the drillpipe were found to be comparable with those measured in the drillpipe body. Ref. 19 gives details about measured residual stresses in different sections of drillpipe.
Fatigue cracks also began at surface pits (25% of the test speci-mens) present before or formed during testing in a corrosive envi-ronment, at surface notches (10%), and at surface slag inclusions
(7%).Surface notches observed at the origin of fracture surfaces
ei-ther were incurred accidentally, were introduced during manufacp
turing or during subsequent handling, or were plaCed there、・ャゥ「・イセ
a!ely (i.e., numerals stamped on the drillpipe body).
Examination of the fracture surfaces of test specimens indicated that fatigue cracks propagate relatively quickly once the cracks have
propagated through the wall thickness. This observation wasウオ「セ
stantiated by fracture-mechanics analysis, which indicated that more than 95% oftotal fatigue life is expended by propagating a sur-face crack to a throughwthickness crack.19 Thus, by the time a wash-out is detected, most of the drillpipe fatigue life has been consumed.
20 140 120 100
BOi
80 セ c! 40I
Iii 10' Number 01 Cyel.. - - Om" 125 MPI (Lubinski4)•
UofA tNt mulls (0 m"'18 ksl (125 MPa))-
Test dlsconOnued before tiliureセ
•
•
•
-
-•
•
::.
..
100 10' 1000 TensileStren(k.l) 350 0 10 20 30 40 50 60 70 80 80 10050l300 - ' , Standard Goodman Diagram
40l
!. 250 -,
, /
u01 ADesign Curve In Airf200
--
Modified(US8d at the endliranat limll)Goodman Diagram 30 f•
I.
150 "- ;!DO: j ' 0 0 "-10j
セセセ ... 50 "-'-
...
0 0 0 100 200 300 400 500 600 700 Tenalle Strees (MPa)The stress concentration factors for the external upset are 1.19
and 1.13 for the axial tension and bending cases, respectively.cッュセ
parison of the stress concentration factors for the external upset vs. the internal-/external-upset drillpipe geometry show that the differ-ences are minimal. Therefore, the superior performance that some drilling contractors associate with 3V,-in. [98-mm] -OD (extemal-upset) drillpipe cannot be attributed to the upset geometry. Note, however, that the internalwupset drillpipe geometry appears to be difficult to control during manufacturing. Although 4Vz-in.-OD,
16.6-lbmlft [114-mm-OD,27.4-kg/m]drillpipe is by far the most
widely used in theゥョ、オウセL the length of the internal upset only
re-cently was standardized.2
The improved fatigue performance observed in small·diameter driUpipe can be attributed directly to pipe diameter rather than upset configuration. For a given dogleg severity, the stress range for a
small-diameter drill pipe asitrotates in the dogleg is lower than for
larger-diameter drillpipe. The maximum stress in a 3%-in. [89-mm] -OD driUpipe body is equal to only 78% of the maximum bending stress ina4V,-in. [114-mm] -OD driUpipe body when both drillpipes are bent in doglegs of the same severity.
The fatigue crack in manyHセUWE of the total) of the test
speci-mens was startedbylight grinding marks on the outer pipe surface,
which is ground to remove small superficial imperfections detected during the inspection phase of manufacturing. Two features are con-sidered important when assessing the effect of grinding on drillpipe fatigue resistance: surface roughness and residual stresses in the sur-face layer. Experimental work by Suhr 21 on specimens that were not under residual stress and that contained grinding marks showed that fatigue cracks almost invariably began at the root of the grooves introduced by grinding when these marks were oriented transverse to the direction of loading. Therefore, surfacing grinding was found to introduce a notch effect. Fractographic examination of our test specimens showed that fatigue cracks did begin at the root of trans-verse grooves left by grinding.
Surface grinding not only introduces surface roughness, but also modifies residual stresses in the surface layer,19 X-ray diffraction measurements of grinding marks showed that residual stresses var-ied from high tension to low compression. In contrast, residual stresses on unground surfaces were consistently compressive. Fig.
Fig. &-Chart showing the effect of mean stress on fatigue strength of Grade E drlllpipe.
Fig. 7-SlNourva showing the effect of stress range on drlllpipe fatigue life in a noncorrosive environment.
SPE Drilling&Completion. June 1994
Gf=G, [Gu/(Gu-a)j, ...•... (4)
Axial Tension onDrillPipe (kip)
300 50 '00 150 200 250
---
10"Dogleg (F.E.M.) "'-セ 10"Dogieg (LIlbInlkl (1961)) セE
--
5' Dogleg (F.E.M.)Z セ Ii' Dogleg(Lubinski(1961)
15
e.
セ'"
1
""""-
drIlp1p11arldWll(ofi
..
...
セ
/
m 10l5
.5 .51
,
j
0 0 0 200 400 500 800 1000 1200 Axial Tension on Drill Pipe (kN)99
whereCois curvature of the drillpipe body adjacent to the support
co=cd(KUtanb KL), (6)
logN=12.3Q-4.56logG,• • . . • . . • . . • . . . • . • . . . • . . . . (5)
Analytical Work of Lubinski
Lubinski' considered a length of drillpipe loaded axially in a curved
configuration. The configuration of the dogleg was assumedtobe
an arc of a circle (a gradual dogleg). To simulate'the relatively large bending stiffness of the tool joint, the end rotation of the section of drillpipe at the tool joint was fully restrained. By considering equi-librium of a unifonn section of drillpipe. Lubinski obtained
Fig. 9-Chert showing Ihe effecl01axielloed on Ihe maximum
bending momenlln a drlllpipe.
In SI metric units, the constant 12.20 is 16.12. Lubinski used a 22-ksi [l50·MPa] endurance limit in a severely corrosive environment.
Lubinski assumed that the effect of mean stress on fatigue life in a corrosive environment was the same as its effect in a noncorrosive environment. Therefore, the Goodman diagram expressed by Eq. 4 was also used for fatigue-life prediction in a corrosive environment Fig. 8 compares fatigue life predicted by Eq. 5 with fatigue life mo-dified for the effect of a mean stress of 18 ksi [125 MPa] and with test results reported here in a corrosive environment. As expected, the Lubinski fatigue curve is conservative at high values of stress. However. at lower stress ranges, some data points lie below the fa-tigue curve, indicating that the curve on which current guidelines are based is not conservative for low stress ranges. Although this ef-fect was expected when the work for the current guidelines was car-ried out, no provision was made to account for it.
To arrive at the API fatigue guidelines in their current fonn,itwas
necessary to evaluate the stresses in a drillpipe rotating in a dogleg
with a superimposed axial tension correspondingtothe weight of
drillpipe below the dogleg. Stress cycling in the drillpipe takes place because of bending stresses that occur in the rotating drillpipe. As
tension increases on the drillpipe, the middle portion of a pipe
be-tween two tool joints partially straightens and moves toward the borehole wall, thereby causing more bending near the tool joint. Un-der tension, the middle of the drillpipe may touch the borebole wall. From this point, the bending stresses are not expected to increase as rapidly with increasing tension. Lubinski's7 and Hansford and
Lu-binski's8,9 method to obtain bending stresses in a drillpipe under axM
ial tension in a dogleg is briefly described in the following section. endurance limit observed in a noncorrosive environment was also reduced by 40% for use in a corrosive environment. Lubinski recog.. nired that this method of obtaining a fatigue curve for a corrosive environment was conservative for high stress ranges. where failure occurs early in fatigue life, and was not conservative for low stress ranges, where failure occurs at stress-range levels below the
result-ing endurancelimit.Decreasing the fatigue stress in Eq. 3 by 40%
results in the following expression for fatigue life in a corrosive en· vironment: 80 70 80 50
i
40f
30&!
201
15 10' 10' Numbw of Cyel.. MMッュᄋQNRUmp。Hlオ「ャャQXォQセ ) 0 Uol AI.I resull8 (am- 125 MPa)•
PrenlatlJle lsllul'fl ollllfll specimen. 00 mlmerfll 8lsnclled on drlllplpe body00 00 O'
•
100 80 10'whereOris the stress range acting with mean stress
a;
aj,equivalentfully reversed fatigue-stress range (i.e.. stress range under zero
mean stress, which yields the same fatigue life asOracting with
a);
andau,tensile strength of the material. The fatigue life reduced by
the presence of axial tension is obtained by use of the equivalent ly reversed stress range in the fatigue life equation (Eq. 3) for the ful-ly reversed bending condition.
In a modified Goodman diagram used at the endurance level, Lu-binski7 assumed a reduction of the endurance limit at a low mean stress to allow for slip marks on the drillpipe body (Fig. 6). This
re-duction corresponds to
=
18% of the fatigue strength under zeromean stress. In addition, he assumed a cutoffon the mean stress
lev-el at 67 ksi [460 MPa]. At this cutoff,theendurance limit was
as-sumed to be II % larger than the fatigue strength predicted from the standard Goodman diagram. Lubinski then used a quadratic curve to interpolate between the point at zero mean stress and the point at a mean stress of67 ksi [460 MPa]. Fig. 6 compares the standard and modified Goodman curves with the results of regression analysis on
results of tests in air. Because the effect of mean stress wasゥョカ・ウエゥセ
gated experimentally10only 36 ksi [250 MPa], tbe U. of Alberta
de-sign curve in Fig. 6 should be used with caution for mean stresses >36 ksi [>250 MPaJ.
Fatigue curves for different mean stress levels can be obtained fromEq. 4. Fig. 7 compares tbe fatigue test U. of Alberta test results
with theSINcurve derived from Eqs. 3 and 4 for the appropriate test
conditions. Of the 20 test results presented in Fig. 7, eight are below the Lubinski SIN curve for a mean stress of 18 ksi [125 MPa]. This indicates that, despite the fact that the LUbinski7fatigue curve repre-sents a lower boundary to fatigue test results presented by
Bach-man6and a further reduction of the endurance limit to account for
the detrimental effect of slip marles, the Lubinski curve is not con-servative compared with recent test results.
The constant 13.31 becomes 17.13 when the stress range is ex-pressed in megapascals. The endurance limit was set at 36 ksi [248 MPa] for drillpipe in a noncorrosive environment,'
Hansford and Lubinski used a modified Goodman diagram to ac-count for the effect of the mean stress at the fatigue endurance level and a standard Goodman diagram at stress ranges above the
endur-ancelimit.'·9The standard Goodman diagram takes the fonn of a
straight line when the fatigue strength (stress range for a fixed
num-ber of loading cycles to failure) is plottedVS.the mean stress. The
interaction equation can be expressed as
Fig. B-SINcurve showing Ihe effecl olsl,ess ,enge on d'iIIplpe
fatigue life In a corrosive environment.
Effectof Stress Range andMeanStress in a Corrosive EnvironM
ment. When a well is drilled in a corrosive environment, a fatigue curve from tests in a noncorrosive environment cannot be used. To obtain a fatigue curve that is applicable to a severely corrosive envi-ronment. Lubinski? lowered the fatigue curve from tests in a non· corrosive environment by 40% throughout. As a consequence, the
600 500 セ 400
セ
3001200
1
---.
200aoo
o_..,....,-.-...
セLNNNNNNNNNLNNNNLMNMNNNNNNLNセLNNNNNNNNNLNNNNLNNNL 0 Rotary Speed .. 60rpm 20lBセ[Z[[[[セセセBBセiセiiBセYセBセLNセNセGセNGセBBGZイHセQNセGZュZNセイ
,. contact01plpe with hole 40
---- U of A 10G I3Om Dogleg 60 セ - - UofA"130mOogiog
ao
セ セ API10°/3Om Dogleg 100 " 120.§
140:!!
160セ
1aO 200 1000」NNNNNMlNセ...MGMセNNZZ^
...セGMGMMGM ...セMGM ... 220o
10 20 30 40 50 60 70ao
90 100Pereant Fallgue LRe Expended In 10 m
セ
§
400セ
600 200aoo
LセNNLNNNNNMNMNNNNLNNNNLNNNNLNセ ...,...,.-,-.-....,..., 0 ...- U 01 A 10°130m Dogie 20 -+-Uof A 5°I3OmDogleg 40 - 0 -AP110°!3Om Dogleg 60 - 0 -API5°I3Om Dogleg _セZZZZZZZ[ZZ[セZZZZZZZZZZZZ、。ッ
100 ...セ
120.9
---_J
140セ
1ao ..
セ -J1aORolaI'y speed .. 1QOrpm _
OrHilng rate .. 9.B Mlr (3mktf) 200
1000
0L...セLNNNNNMZGBZB ...:-'"":"'-'"-"-...セ
...-'-...;;J 220
10 20 30 40 50 60 70
eo
90 100Pereant Fatigue LRe Expended In 10m
i
- 400Fig. 1O-Chart showing predicted drlllpipelstigue damage In e gradual dogleg In a noncorrosive environment.
Fig. 11-Chsrt showing predicted drillplpe latigue dsmage in a gradual dogleg In a corrosive environment.
(near the tool joint);Cd, curvature of the dogleg; and L, half the
length of the drlllpipe. K Is given by
K=jT!EI,
(7)where Tis tension force in the drillpipe;E,modulus of elasticity of the pipe material; andI,moment of inertia of the cross section of the
drillpipe body. OnceCohas been evaluated for a givenCdandT,the
bending stress in the drillpipe body is obtained from7
ab=(coEd/2). . (8)
In his original work. Lubinski? did not consider the effect of、イゥャャセ
pipe-bodylborehole-wall contact as the axial load is increased. This
assumption, which is embodied in Figs. 6.4 and 6.5 of APIRP7G,5
leads to overestimation of the bending stresses in the drillpipe body. Later work by Lubinski22 addressed the effect of drlilpipelhole con-tact on the calculated stresses. This work was found to be relevant only for Range 3 drillpipe; the Lubinksi analysis did not predict con-tact for standard Range 2 drillpipe.
Eq. 6 represents a first-order analysis for the effect of tension
force on drillpipe curvature. Because application of tension force to the drillpipe tends to straighten the pipe, the moment induced at the critical section near the tool joint will be overestimated if the initial
eccentricity of the axial load is used to calculate the momentゥョセ
duced at the tool joint. A decrease in eccentricity (corresponding to the deflection at the middle of the drillpipe with respect to the tool joint) would reduce the calculated moment near the tool joint.
Because of the shortcomings identified in the Lubinski analysis, a more general analysis using the finite-element method has been
perfonned on a section of drillpipe.19The effect of increased
stiff-ness in the upset and tool-joint area and of drillpipe contact with the hole wall and the nonlinear behavior resulting from the second-or-der effects in the curved pipe unsecond-or-der tension were consisecond-or-dered in the analysis. A section consisting of two lengths of drillpipe was ana-lyzed. To simulate a gradual dogleg, the borehole wall w.s assumed to be rigid and the dogleg was assumed to be an arc of a circle. Ref. 19 presents details on the modeling and analysis of a section of drill-pipe in a dogleg.
Analysis of a Range 2 drillpipe under tension was perfonned for dogleg severities of5 and 10'/100 ft [5 and 10'/30 m), and the effect of axial load on bending moment adjacent to the tool joint was ob-tained. Fig. 9 presents moments calculated in the drillpipe body ad-jacent to the pipe upset for values of axial tension varying from 0 to 225 kip [0 to 1000 kN). For • dogleg severity of 5 '/100 ft. [5'/30 mJ, the drillpipe .nd borehole wall were not found to touch, given .xialloading up to 225 kip [1000 kN). However, for. dogleg severity of 10'/100 ft. [10'/30 mJ, the drlllpipe and borehole wall touch under an axial load > 11.2 kip [>50 kNJ. Fig. 9 also pre-sents the response predicted by the first-order analysis presented by Lubinski.7Under small axial loads, the Lubinski analysis underesti-mates the moment induced in a drillpipe. As the axial load increases,
the moment predicted from the work of Lubinski exceeds the one predicted with the finite-element method. This results mainly from the second-order effect, which was ignored in the work of Lubinski.
Cumulative Fatigue Damage
During a fatigue test on a drillpipe, load cycles of constant stress range are applied to the test specimen until the cumulative effect of all cycles produces failure (unless the test is conducted in air at a stress range below the endurance limit). When a test is conducted under variable amplitude loading (various stress ranges), a condi-tion that prevails in the field as a drlllpipe rotates through doglegs of various severities, the cumulative effect of these events may also lead to fatigue failure. Fatigue effects of loading events other than constant amplitude are called "cumulative damage." The Palmgren.. Miner rule is the simplest rule used to predict cumulative fatigue. 23 Despite this rule's inability to account for loading sequence, it is used extensively. mostly because it is simple and becauseュッイ・Mウッセ
phisticated rules have not proved to be generally applicable to all types of service loading. With the Palmgren-Miner rule. fatigue damage sustained under one cycle of loading can be expressed as
Dj=(I/NJ, (9)
where N is fatigue life under constant amplitude load cycling. Fa-tigue failure is expected to take place when the total damage sus-tained represents 100% of the fatigue life.
To develop equations for the allowable stress range, the mean fa-tigue curves of Eqs. 1 and 2 minus two standard deviations are used. The two standard deviations below the mean regression line approx-imately represent the lower 95% confidence limit of the test data and result in "safe" design curves with the same probability of failure. The resulting design equations become
log N=1O.9-3.46 log a,_7.94 x 10-4(a)2 , (10)
for a noncorrosive environment. (In 51 metric units, constants 10.9 and 7.94 x 10⁻⁴ are 13.8 and 1.67 X 10⁻⁵, respectively). The design for a corrosive environment can be expressed as
log N=9.33-2.35 log a,-2.63 X 10⁻⁴
(a
)2 (I I)In SI metric units, constants 9.33 and 2.63 X 10⁻⁴ are 11.3 and 5.54 X to..(;, respectively. A comparison ofEqs. 10 and II indicates that safe fatigue life is higher in a corrosive than in a noncorrosive environment. This apparent paradox is only an artifact arising from the large scatter observed in the test results obtained in air and from the necessity of keeping the same level of safety in both corrosive and noncorrosive environments.
Once fatigue life for a given stress range and mean stress is eval-uated from test results, the percent fatigue life expended for a num-ber of stress cycles can be evaluated from the Palmgren-Miner rule. To derive the present cumulative fatigue guidelines,7 Hansford and
Lubinsk.i9assumed a rotary speed of 100 rev/min and a drilling rate
of 9.8 fl/hr[3 m1h), which means that 20,000 cycles of loading are
put on a dnllpipe as 32.8 ft[1O m] of hole is drilled. In this paper,
we retain these assumptionswithrespect to drilling conditions so
that the cumulative fatigue curves derivedbythe method presented
can be compared directlywithexisting guidelines.
With the procedure outlined herein, cumulative fatigue curves
were obtained for drilling in air and in a corrosive environment. Fig.
10presents cumulative fatigue curves for drilling in a noncorrosive
environment, whereas Fig. 11 is applicable to a corrosive・ョカゥイッョセ
ment. In both figures, curves are presented for dogleg severities of
5 and10"/100 ft [5 and10'/30 m]. The curves corresponding to
API design guidelines are also shown for comparison. Note from Fig. 10 that the API design guidelines for cumulative fatigue dam-age in a noncorrosive environment do not provide conservative
pre-dictions for the drillpipes we tested. Also note, however. that for a
dogleg severity of 10'/100 ft[10"/30 m], the two design curves
presented in Fig. 10 are in better agreement than the curves for a
dogleg severity of 5 '/100 ft[5'/30 m]. This difference in behavior
between the two dogleg severities is a result of neglectin
r
the」ッョセtact between the drillpipe and the borehole in the Lubinski analysis, which leads to more-conservative predictions of bending stresses in
the drillpipe, thus compensating for the less-conservativeSINcurve
used to predict fatigue life.
In contrast, Fig. 11, for fatigue in a corrosive environment, indi-cates that the API cumulative fatigue design curves for drilling in a corrosive environment are more conservative than the predictions resulting from our work. Again, however, the API curves give an un-conservative estimate offatigue damage at low axial load, probably as a result of the lower driUpipe bending stresses calculated at low levels of axial load by use of the Lubinski analysis.
Conclusions and Recommendations
The effect of stress range and mean stress were both found to be sig-nificant to drillpipe fatigue life.
Grinding the drillpipe surface during inspection can shorten the drillpipe fatigue life. Of29 specimens tested in air, 13 failed because a fatigue crack developed at grinding marks. Of 27 specimens tested in a corrosive environment, 13 failed because cracks developed at grinding marks. Fractographic examinations showed evidence of a notch effect at the grinding marks. In addition, residual..stress mea-surements using X-ray diffraction showed that grinding removes beneficial compressive surface stresses. Therefore, grinding should be kept to a minimum during inspection, especially near the upset region, where bending stresses are high owing to the secondary ef-fect of axial tension on a curved drillpipe. Stress-relief heat treat-ment of the drillpipe after the inspection stage would reduce the high-tensile residual stresses sometimes introduced by grinding.
We found that only a small portion of the total fatigue life remains once a surface crack propagates through the pipe-wall thickness. Therefore, we recommend replacing drillpipe as soon as a washout is detected because twistoff is likely to occur shortly thereafter. This practice is consistent with current drilling practices.
The effect of upset geometry was found to be minimal in・クエ・イョ。ャセ
upset compared with anゥョエ・ュ。ャMO・クエ・イョ。ャセオーウ・エ drillpipe. Because
the internal protective coating in the internal-upset region has been found to be damaged in specimens that failed in the field, we recom-mend use of external-upset drillpipes with a flush inner wall when available. Geometry of pipes with flush inner walls is less suscepti-hie to damage by tools run down the drillpipe.
The superior perfonnance of 3V,-in. [98-rnmJ -OD (external-up-set) drillpipe observed by some drilling contractors is likely to be a direct consequence of small drillpipe diameter. For a given dogleg severity, the stress range of a driBpipe as it rotates in the dogleg is directly proportional to pipe diameter. For this reason, smaller diam-eter drillpipes should be used when practical. However, to prevent rupture of drillpipe before a leak is detected, drillpipe wall thickness should be kept to a minimum. Therefore, to deter fatigue, drillpipe design must represent a compromise between a small diameter to re-duce the stress range and a thin wall to allow for leak before break. Because an endurance limit does not exist in the corrosive envi-ronments common in the field, use of the API recommended dogleg severity below which no fatigue damage is sustained should be
dis-SPE Drilling & Completion, June 1994
continued. In a corrosive environment, fatigue damage occurs for any dogleg severity. Therefore, fatigue should be controlled through cumulative damage calculations. Because field environments are generally corrosive, cumulative fatigue curves for a corrosive envi-ronment should be used.
Existing cumulative fatigue curves for noncorrosive
environ-ments are unconservative compared with results we obtained.hッキセ
ever, for a corrosive environment, the existing API cumulative fa-' tigue curves were found to be generally very conservative.
Current knowledge of corrosion fatigue is insufficienttoallow
prediction of fatigue life in a given corrosive environment with re-sults from tests in a different environment. It is premature to replace existing API guidelines for cumulative fatigue damage. Further re-search is needed to determine the effects of a wider variety of corro-sive environments, the detrimental effect of slip marks on the pipe body, and applicahility ofEq. 9 for cumulalive damage calculations.
Nomenclature
Cd =dogleg curvature, L-l. in.-I[mm-I]
Co =drillpipe curvature, L-I, in.-I [mm-I ]
d =diameter, L, in. [mm]
Df =fatigue damage
E=Young's modulus of elasticity, m1Ll2,ksi [mPa]
I =moment of inertia, L4, in.4 [mm4]
K=constant given by Eq. 7
L =half length of drillpipe, L, in. [rnm]
N =number of cycles ofloading (fatigue life)
T=axial load, kips[N]
ab =bending stress in drillpipe body,m1Lil,ksi セュp。}
Of=equivalent fully-reversed stress range, mILt • ksi
[mPa]
a, =stress range, ksi [MPa]
(j ;:;mean stress, mlLt2,ksi [MFa]
au =tensile strength of material, m1Lt2,ksi [MPa]
Acknowledgments
We thank the Natural Sciences&Engineering Research Council of
Canada for financial assistance for this research, Natl.-Oilwell
Can-ada Ltd. for supplying drillpipegratisfor part of the test program
and for donating equipment used for the power drive of the rotating-beam test series, and Lee Oilfield Service Ltd. for helping to prepare the specimens containing a tool joint.
References
1.Gensmer, R.P.: "A Contractor's View of Drillpipe Life," paper SPE 14790 presented at the 1986 IADe/SPE Drilling Conference, Dallas.
Feb. 10-12.
2. Grant, R.S. and Texter, H.G.: "Causes and Prevention of Drill Pipe and Tool-Joint Troubles,"Drill.&Prod. Prac.,API, New York City (1941)
9-48.
3.Marion,T.L.:"IADC Tackles Drill Pipe Failures,"Drilling Contractor
(1987) 42, No. 1,25.
4. Shutts, W.C.: "Recent Developments in Joint Designs of Tubular Goods,"Drill. & Prod. Prac.,API, New York City, 132-139.
5.APIRP7G, Recommended Practice for Drillstem Design and Operat-ing Limits,14th edition, API.Washington, DC (Aug. I).
6. Bachman, W.S.: "Fatigue Testing and Development of Orin Pipe to Tool Joint Connections,"World Oil(1951) 132, No.1, 104.
7. Lubinski, A.: "Maximum Permissible Dog-Legs'in Rotary Boreholes,"
JPT(Feb.1961)175;Tmn'"AIME, 222.
8. Hansford. J.E. and Lubinski,A:"Effects ofDrilling Vessel Pitch or Roll on Kelly and Drill Pipe Fatigue," JPT (Jan. 1964)WWセ Trans" AIME,
231.
9. Hansford, J.E. and Lubinski, A.: "Cumulative Fatigue Damage of Drill
Pipe InDog-Legs,"JPT(1966)359;T,"n,..AIME, 237,
10. Chinese Petroleum Standardization Committee: "Drill Pipe Life Could be Drastically Increased," Drilling Contractor(1987) 43. No.5, 33. 11. Tsukano, Y.et ai.:"Appropriate Design of Drillpipe Internal Upset
Ge-ometry Focusing on Fatigue Property," paper SPE 17206 presented at the 1988 IADC/SPE Drilling Conference, Dallas. Feb. 28.;,.March 2. 12. Vingoe, R.L.: "Corrosion Fatigue and Bending Still Plague Drill
Strings,"Oil & GasJ.(1972) 70, No. 15, 108.
---.
G;Y. Grondin Is an assistant professor of civil engineering at Me· morlal U., Newt., Canada. Previously he was8consulting struc-tural engineer speclaUzl og In fatigue, corrosion, and durability of structure•. He we. Involved With Inve.tlgatlng drlllpipe fetlgue life, design and fatigue assessment of highway bridges. and du.. reblllty of building•• Grondin hold. BS end MS degree. from the U. of New Brun.wlck and a PhD degree from the U. of Alberta, ell In civil engineering.G.LKulak Is a professor In the Dept. of Civil Engineering at the U. of Alberta, Edmonton. Previously he worked for the Natl. Research Council of Alberta as a structural engineer specializing In the behaVior and design of structural steel members, connections, and frames. He Is a recognized au-thority on member stability, behavior of welded and bolted con-nections, and fatigue of steel components. His work Includes in-vestigations Into the fallgue life of drillpipe, cables, end rellway bridge girders taken from service. He has long been Involved with Canadian and International codeMwrltlng authorities for steel structure•• Kulak hold. a BS degree from the U. of Alberta, an MS degree from the U. of 11IInol., end a PhD degree from Le· highU" all In civil engineering.
13. Patton, C.C.: "Corrosion Fatigue Causes Bulk of Drill-String Failures."
Oil&aasJ. (1974) 72, No. 30. 163.
14. Joosten, M.W.• Shute, J., and Ferguson, RA.: "New Study Shows How to Predict Accumulated Drill Pipe Fatigue," World Oil(1985)201, No. 5,65.
15.Dale, B.A.: "An Experimental Investigation of Fatigue Crack Growth in Drillstring Tubulars,"SPEDE(Dec.1988)356; Trans., AIME,285. 16. Helbig, R. and Vogt, G.H.: "Reversed Bending Fatigue Strength of Drill Strings Subjecttothe Attack of Drilling Fluids;" Oil&Gas European
Magazine,intl. edition of £rd(jJ ErdgasKoh/e (1987)No.2, 16. 17. Moyer, M.C., Dale, B.A., and Kusenberger, EN.: "An Automated Tool
Joint Inspection Device for the Drillstring," JPT (June 1984)982.
18. Grondin, G.Y. and Kulak, G.L.: "Fatigue of Drill Pipe," paper89-47,
CADFJCAODC 1989 Spring Drilling Conference, Calgary, April
26-28.
19. Grondin, G.Y. and KUlak,G.L.: "Fatigue of Drill Pipe," Structural Engi-neering Report 171, Dept. of Civil EngiEngi-neering,U.of Alberta (1991).
20. Spec. 3D, Specification for Dril/pipe. second edition, API, Dallas
(March I).
21. Suhr, R.W.: "The Effect of Surface Finish on High Cycle Fatigue of a Low Alloy Steel: The Behaviour of Short Fatigue Cracks," EGF
Publi-cation1, K.J. Miller and E.R de losRiDS(oos.), Mechanicaleョァゥョ・・イセ
ing Publications, London (1986)69-86.
22. Lubinski, A.: "Fatigue of Range 3 Drill Pipe," Revue L'lnst. Franfais
du Ntrol.(March-April 1977) 32, No.2, 209.
23. Bannatine, J.A., Comer, J.1.• and Handrock, J.L.: Fundamenralso/Met·
alFatigueAnalysis.Prentice·Halllnc., Englewood Cliffs, NJ (1990).
81 Metric Conversion Factors
fl X3.048* E-OI=m
in. X2.54* E+01=mm
in.4 X4.162 314 E-07=m4
kip X4.448 222 E+03= N
ksi X6.894 757 E+03
=
kPaGrondin Kulak
·Converslon factor Is exact SPEDC
Original SPE manuscript received for review Nov. 5, 1991. Revised manuscript received Nov. 22,1993. Paper (SPE 24224) accepted for publication Jan. 7, 1994.