Publisher’s version / Version de l'éditeur:
Building and Environment, 29, October 4, pp. 511-521, 1994-10-01
READ THESE TERMS AND CONDITIONS CAREFULLY BEFORE USING THIS WEBSITE. https://nrc-publications.canada.ca/eng/copyright
Vous avez des questions? Nous pouvons vous aider. Pour communiquer directement avec un auteur, consultez la première page de la revue dans laquelle son article a été publié afin de trouver ses coordonnées. Si vous n’arrivez pas à les repérer, communiquez avec nous à PublicationsArchive-ArchivesPublications@nrc-cnrc.gc.ca.
Questions? Contact the NRC Publications Archive team at
PublicationsArchive-ArchivesPublications@nrc-cnrc.gc.ca. If you wish to email the authors directly, please see the first page of the publication for their contact information.
NRC Publications Archive
Archives des publications du CNRC
This publication could be one of several versions: author’s original, accepted manuscript or the publisher’s version. / La version de cette publication peut être l’une des suivantes : la version prépublication de l’auteur, la version acceptée du manuscrit ou la version de l’éditeur.
For the publisher’s version, please access the DOI link below./ Pour consulter la version de l’éditeur, utilisez le lien DOI ci-dessous.
https://doi.org/10.1016/0360-1323(94)90010-8
Access and use of this website and the material on it are subject to the Terms and Conditions set forth at
Measurements of room air distribution in a ventilated office
environment
Jouini, D. B.; Said, M. N.; Plett, E. G.
https://publications-cnrc.canada.ca/fra/droits
L’accès à ce site Web et l’utilisation de son contenu sont assujettis aux conditions présentées dans le site LISEZ CES CONDITIONS ATTENTIVEMENT AVANT D’UTILISER CE SITE WEB.
NRC Publications Record / Notice d'Archives des publications de CNRC:
https://nrc-publications.canada.ca/eng/view/object/?id=e2f69e54-8dc6-4ab5-9861-a96ea94ca3e6 https://publications-cnrc.canada.ca/fra/voir/objet/?id=e2f69e54-8dc6-4ab5-9861-a96ea94ca3e63LDG
t o .
3 5 1 1
,Cyiq
---
--Institute for lnstitut de Research in recherche en Construction construction
- -. - - .-
Measurements of Room Air
Distribution in
a
Ventilated
Office Environment
by D.B. Jouini, M.N. Sald and E.G. Plett
Reprinted from:
Building and Environment (Pergamon)
Vol. 29, NO. 4, pp. 51 1-521, 1994
IRC Paper No. P-3511
NRCC 36965
I R C
S e r
R e c e i v e d
o n :
1 2 - 0 6 - 9 4I R C
p a p e r
I R C
p a p e r
--
Bev
C r e i g h t o n
ANALYSE
Pergamon
Buikhrlg and Enrrr-onrncnl. Vol. 29. NO 4, pp. 5 11-521. 1994 Elsevler Sclence Ltd
Pr~nted ~n Great Britain 036&1323/94 $7.00+0.00
Measurements of Room Air Distribution
in a Ventilated Office Environment*
Results of measurements of rhe room air .potv properties in un @ce space mrirr~nrnent (4.74
m ~ 4 . 8 7 nr x 2.87 rn) with and u.i/horir parritions (ucousricnl srreens) ore presmred. 7Re
meumrements inclttdrd air flnrr* porrern, air g e e d , und rurbuI~nce inrensiry. The prqfiles o f /he
mpon speed md rhe rurb111~nr~ kinetic energ? r-11 rhc supplv sir 0penin.g are dvo presented. The
tioru .rho~v f h ~ r:flLcr y/'rrsir~g ucn~rs/ica/ strrotrs (~r'irlr f.ario1i.P /rriqlr/.r urtd it qrrp ~ P I ~ P P ~ / h ~ . f l o o r
und rhe borrom uf the screen) on rhr airflnw purrern and rhe air Jow properries within {he room. These data are inrended,for use in the enolzmrion qf rhe exisring ntrmerical and scrilr modelr, and to aid in furthering the understanding of the behaviour of room ventilation airJlows.
NOMENCLATURE I,, turbulence intensity
k turbulence kinetic energy P pressure
U , mean speed at the air supply diffuser
u' air speed fluctuation
Greek symbol iJ correction factor Subscripts amb ambient d diffuser std standard INTRODUCTION
ROOM air flow is a complex phenomenon. It is turbulent and three dimensional with both low and high turbulence levels. It also involves flow regimes with forced con- vection where high speeds play a major role, and natural convection where low speeds are predominant. Under- standing such flows is essential to the design of ventilation systems capable of providing acceptable indoor air qual- ity and thermal conditions. Measured data are also needed for evaluating and improving the existing numeri- cal models that are used to compute room air dis- tribution.
The assumptions used in existing numerical models do not fully account for all the complexity of the physics of room air flows. Currently available data are insufficient for the purpose of evaluating numerical models because
* Copyright 0 Government of Canada.
t Dept. of Mech. and Aero. Eng., Carleton University, Ottawa, Ontario, Canada.
$ Institute for Research in Construction, National Research Council of Canada, Ottawa, Ontario, Canada.
Q:Dept. of Mech. and Aero. Eng., Carleton University, Ottawa, Ontario, Canada.
of the variety of parameters involved in such flows. Since the 1950s, detailed measurements of the mean speeds and temperatures [e.g. Kostel and Tuve (1955)l in occupied spaces have been available to the designers of ventilation systems. These data are valuable for the evaluation of the performance of room air distribution systems, and provide guidelines for setting acceptable indoor air quality criteria.
Measurements of air speeds and temperatures in reduced scale model rooms were conducted by Nielsen et al. (1978), Timmons (1979), Gosman et al. (1980), Zhang
et al. (1989), Murakami and Kato (1989), and others. Isothermal and non-isothermal conditions were used in these measurements. The turbulence characteristics were not measured in most of these studies. Moreover, con- tradictory results were obtained from the scale model studies, especially under non-isothermal test conditions [Zhang et al. (1989)l. Sandberg (1989) and Zhang (1991) measured air speeds and turbulence characteristics in full scale rooms. Their data are valuable for understanding the behaviour of room air flows, especially the turbulence characteristics of such flows. However, these measure- ments were focused on the occupied zone only. Zhang's (1991) experiments involved high air change rates (19 ach). Hart and Int-Hout (1981) studied, experimentally, the effect of 1.5 m (5 ft) high acoustical screens on the Air Diffusion Performance Index (ADPI) in a large open office equipped with a commercial continuous slot-type diffuser mounted in the ceiling. The gap between the floor and the bottom of the screen was not reported. The acoustical screens were set parallel to the vertical plane containing the air inlet (slot) diffuser at several horizontal positions relative to the diffuser. Results of this study indicated that the presence of 1.5 m high acoustical screens slightly reduced the ADPI. Hart and Int-Hout recommended that the effect of using high acoustical screens on room air motion should be further evaluated experimentally.
Observation Port
Plane of Measurements
Fig. 1. Test room facility and dimensions. L = 4.75 m, H = 2.87m, W = 4.87 m, w = 1.016 m, h = 0.0127 m, y1 = 2.141 m, y2 = 0.806 m, w1 = 2.435 m.
In most of the experiments conducted to date (both in scale models and in full scale rooms), the supply air jet was assumed normal to the flow domain. Under the auspices of the International Energy Agency (IEA) Annex 20, measurements of the characteristics of room airflows in full scale test chambers (size 3.6 x 4.2 x 2.5 m) have been carried out in several countries [Lemaire (1992)l. The main purpose of these measurements has been for evaluating existing numerical models. Test cases included isothermal forced convection (no heat load), non-isothermal mixed convection (summer cooling) and free convection (winter heating). The air flow rates were typical of residential and office rooms (1.5, 3.0, 6.0 ach). However, internal obstructions were not included, and the room configuration and diffuser arrangement used in these studies are not common in North America.
It is apparent that more detailed full scale measure- ments of the characteristics of room air flows is needed, in order to provide comparative data to be used for the further advancement of numerical models used in the simulation of room air flows.
The main objective of this study was to provide detailed experimental data of the air flow characteristics in a typical office with and without internal partitions (acoustical screens), in sufficient detail for use in the evaluation of numerical models. Also studied is the effect of the height of the acoustical screen and the gap between the floor and the bottom of the screen, on room air distribution.
DESCRIPTION OF EXPERIMENTS The experiments reported herein were conducted in the ventilation test room facility, in a laboratory office type building (Fig. 1) of the National Research Council of Canada. The test room measures 2.87 m (9.4 ft) high, 4.75 m (15.6 ft) long, and 4.87 m (16 ft) wide. All walls of the test room are interior walls. The room was equipped with two commercial air-light fixture type slot diffusers which are fitted along the side of fluorescent light fixtures, of dimensions 1.016 m (40 in.) long by 0.0127 m (0.5 in.) wide for each of the supply and the return air. Figure 1 shows the locations of these diffusers in the test room. A dedicated ventilation system provides a range of air flow conditions to the room. Pressure
differentials between the test room and its surrounding spaces were monitored to check for air leakage from, or to the room.
The mean air speed, temperature and turbulence inten- sity of the air within the room were measured by means of omni-directional anemometers (type DANTEC 54R10) and a DANTEC multiflow analyser. Nine omni probes spanning the height of the room were mounted in vertical alignment, on a traversing framework. This enabled man- ual adjustment of the position of the instruments throughout the selected plane of interest. The positional adjustment was made by means of a pulley system oper- ated from outside the test room. A total of 21 positions were used for each test. On each of the 21 horizontal positions of the probe tree, measurements of the 9 vertical omni probes were taken over a 20 minute time period defined as the integration time (IT). This time period was determined in preliminary tests such that steady values of the mean speed were obtained.
The omnidirectional anemometers were calibrated by the manufacturer shortly prior to the experiments. The accuracy of the anemometer was estimated to be around 2.5% for the speed range 0.05-1.0 m/s, and around 5% for the speed range 1-5 m/s, and the absolute accuracy of temperature measurements was around 0.5"C.
Helium-filled bubbles were used to visualize the flow pattern in the mid-plane of the test room.
These bubbles were approximately 3 mm ($ in.) in diameter, and on average neutrally buoyant (Sage Action Inc.). Due to limitations of space and photographic equipment, photography of the mid-plane was taken in two frames. The technique of flow visualization as well as the photography are described in detail by Jouini (1 992).
Table 1. Experimental test parameters Flow obstacles Test
number Height Floor gap
1 none
2 6.5 ft (1.981 m) 0.0 in.
Measurements of Room Air Distribution
0.00
L x
Y . Y Y. x 3! r . Y ! x+ 0.00 0.20 0.40 0.60 0.80 1.00zlw
+
UQ.
+
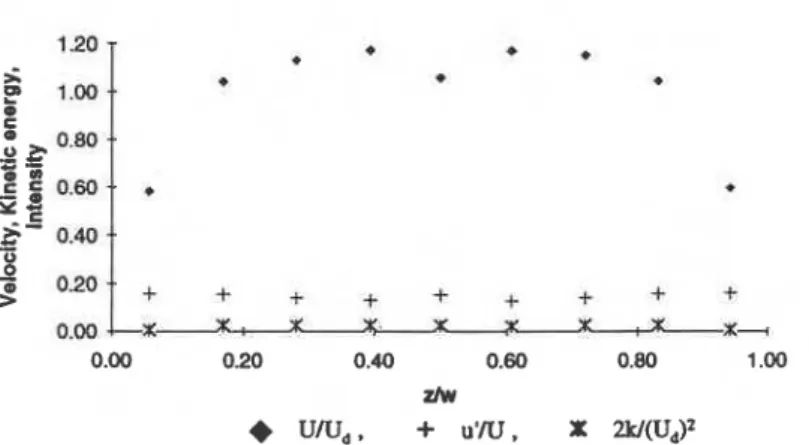
u 8 N . X 2kl(Ud)2Fig. 2. Velocity (U,,), turbulence kinet~c energy (2k/(U,,)2), and turbulence intensity (TI = (u'/U)) along the supply d~ffuser for 3 ach.
Fig. 3. Velocity (U,,), turbulence kinetic energy (2k/(Uc,)z), and turbulence intensity (TI = ( u ' / U ) ) across the supply diffuser for 3 ach.
umd
+
u'/U a) uw = 0.75 mechanb=d mornx
2k/(Ud)' 1 2-
'Y 1--
2T
rn rnL--
rn I m 3- 0.6 a 5 0.4 3 3 0 2 .. .. ..+
+
+
+
+
+
+
0-
Y . Y Y . Y! Y ' -X 0 0 2 0 A 0.6 0 8 1 ~h b) U W = 0.50b) Frame A Frame B
-
Supply Diffuser R e t u r--
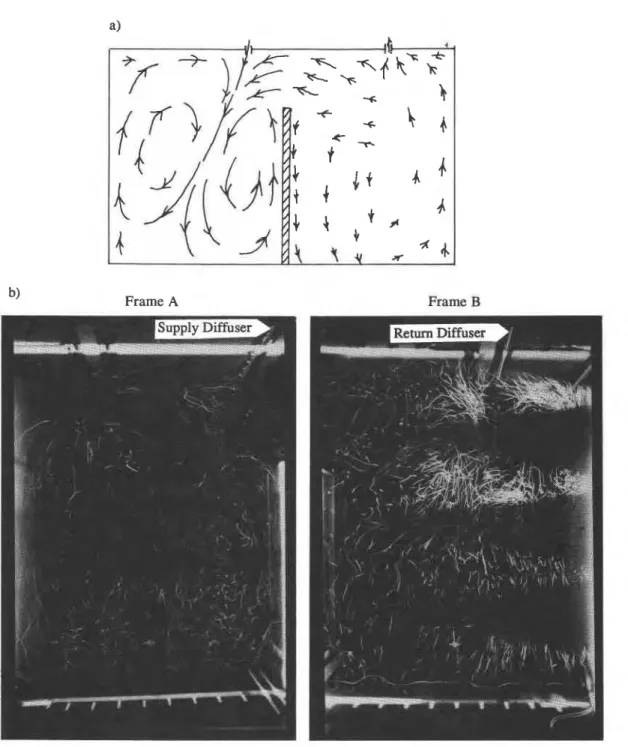
nDiffuserFig. 4. (a) Qualitative sketches and (b) flow visualization using bubbles in the mid-plane of the test room,
test (1).
The flow characteristics (mean speed and turbulence are typical office partitions (acoustical screens) and were intensity) at the supply air opening were measured using placed in the centre of the test room.
a hot-wire anemometer, along the length and across the width of the supply air diffuser. The measurements across the diffuser width were taken at three locations along the
length of the diffuser. RESULTS AND DISCUSSION A total of seven tests were conducted using air supply
flow rates of 1.5 and 3.0 ach. Isothermal conditions were A correction factor
<
[equation (I)] is used to adjust assumed to prevail for all tests. The room air temperature the experimental results to the standard atmospheric con- was maintained at about 2 2 , 5 0 ~ , Results of three rep- ditions (20°C and 101.3 kPa). The results presented here resentative tests are presented in this paper. Jouini (1992) are by the average air 'peed.describes all tests in detail. Table 1 lists the key par- ameters of these tests. The air supply flow rate was 3 ach for the three tests. The flow obstacles used in this study
Measurements of Room Air Distribution
b) Frame A
Frame
B
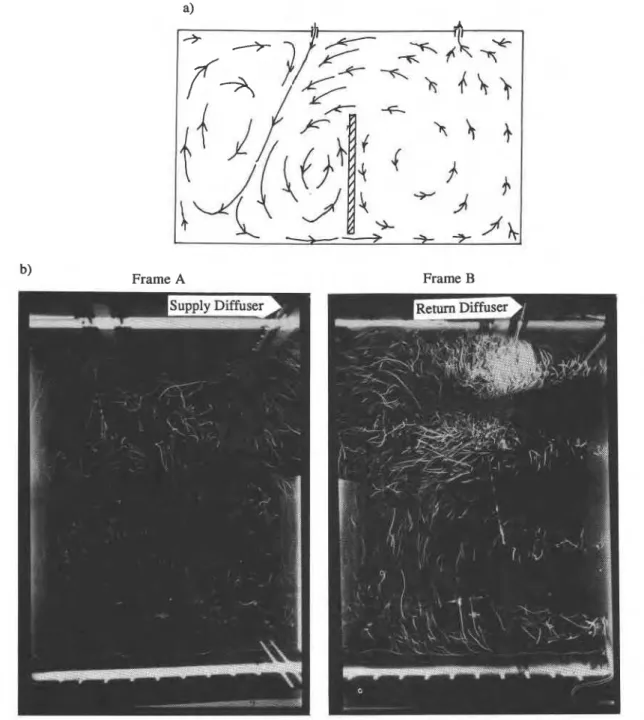
Fig. 5. (a) Qualitative sketches and (b) flow visualization using bubbles in the mid-plane of the test room, test (2), partition height = 1.981 m (6.5 ft), gap = 0.0 m (0.0 in.), partition located in the centre of the
room.
Measurements of supply air conditions
Figures 2 and 3 show mean speed and fluctuating air speed and the turbulence kinetic energy distributions at the supply diffuser. The distributions of the speed and turbulence intensity are almost uniform along and across the supply diffuser. The turbulence kinetic energy was
calculated by :
-
k =
iU'2
( 2 )The turbulence intensity is defined as the ratio of the air speed fluctuations (u') to the mean speed (U,). It rep-
resents the degree of turbulence at a local point. For equation (3), numerical modellers usually assume a uni- form distribution of the turbulence intensity at the supply air diffuser with values of between 4% and 14% [e.g. Awbi (1989), Nielsen (1990)l. Zhang (1992) measured an average value of the turbulence intensity of 14%. In the present study, the average value of the supply air turbulence intensity (I,) was measured to be approxi- mately 9%. The average supply air speed was 4.302 m/s (846 ft/min.), and the supply air jet orientation (air inlet flow angle) with respect to the vertical direction (x axis) was 16".
b)
Frame A Frame B
Fig. 6. (a) Qualitative sketches and (b) flow visualization using bubbles in the mid-plane of the test room, test (3), partition height = 1.676 m (5.5 ft), gap = 0.152 m (6.0 in.), partition located in the centre of the
room.
A i r j o w pattern
Figures 4 to 6 show the air flow pattern in the mid- plane of the test room for tests 1, 2 and 3 respectively. The air flow pattern in the mid-plane of the test room appears to be predominantly two-dimensional except at .the corners where flow in the third direction appears to be significant. In the case of the empty room (Test 1, Fig. 4), the incoming air from the air supply diffuser divides at the floor producing two recirculating eddies, a small one with high speeds located in frame A (containing the supply diffuser), and a large one with low speeds located in frame B (containing the return diffuser).
The presence of the partitions in the test room (Figs 5 and 6) seems to create two zones in the mid-plane of the test room, one zone with high recirculating flows and high speeds, and another zone with hardly any air flow circulation and with low speeds. For the 6.5 ft height partition with no gap between the floor and the bottom of the partition, Fig. 5, the supply air jet separates into two streams forming two recirculating eddies on each side of the supply air jet (frame A), and hardly any flow in the second half of the plane (frame B). The recirculating eddy on the right of the jet extends from the floor to the top of the partition. When using the partition of 5.5 ft
Measurements of'Room Air Distribution Level Wud F 0.19 E 0.18 D 0.17 C 0.15 B 0.14 A 0.13 9 0.12 8 0.10 7 0.09 6 0.08 5 0.07 4 0.06 3 0.04 2 0.03 1 0.02
Fig. 7. Spatial distribution of the air speed in the mid-plane of the test room, test (l), U, = 4.302 m/s,
5 = 1.082. Level WUd F 0.10 E 0.18 D 0.17 C 0.15 B 0.14 A 0.13 9 0.12 8 0.10 7 0.00 6 0.08 5 0.07 4 0.06 3 0.04 2 0.03 1 0.02
Fig. 8. Spatial distribution ofthe air speed in the mid-plane of the test room, test (2), partition height = 1.981 m (6.5 ft), gap = 0.0 m (0.0 in.), U<, = 4.302 m/s,
<
= 1.086.Level W W F 0.19 E 0.18 D 0.17 C 0.15 B 0.14 A 0.13 9 0.12 8 0.10 7 0.09 6 0.08 5 0.07 4 0.06 3 0.04 2 0.03 1 0.02
Fig. 9. Spatial distribution of the air speed in the mid-plane of the test room, test (3), partition height = 1.676 m (5.5 ft), gap = 0.152 m (6.0 in.), U<, = 4.302 m/s, 5 = 1.049.
5 48.71
4 40.48
3 32.27
2 24.05
1 15.83
Fig. 10. Spatial distribution of the turbulence intensity in the mid-plane of the test room, test (I), U, = 4.302 m/s, 5 = 1.082.
Fig. 11. Spatial distribution of the turbulence intensity in the mid-plane of the test room, test (2), partition height = 1.981 m (6.5 ft), gap = 0.0 m (0.0 in.), U,, = 4.302 m/s, ( = 1.086.
Level u'IU
Fig. 12. Spatial distribution of the turbulence intensity in the mid-plane of the test room, test (3), partition height = 1.676 m (5.5 ft), gap = 0.152 m (6.0 in.), U,, = 4.302 m/s, ( = 1.049.
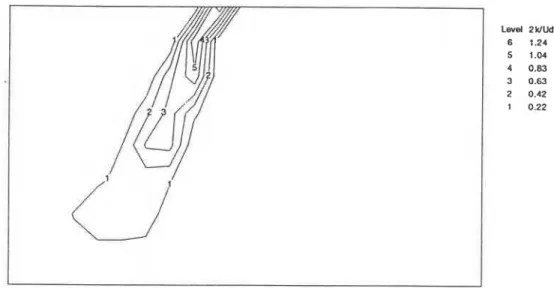
Measurements of Room Air Distribution Level 2WUd 6 1.24 5 1.04 4 0.83 3 0.63 2 0.42 1 0.22
Fig. 13. Spatial distribution of the turbulence kinetic energy in the mid-plane of the test room, test (I),
U, = 4.302 m/s, = 1.082. Level 2WUd 6 1 2 4 5 1.04 4 0.83 3 0.63 2 0.42 1 0.22
Fig. 14. Spatial distribution of the turbulence kinetic energy in the mid-plane of the test room, test (2), partition height = 1.981 m (6.5 ft), gap = 0.0 m (0.0 in.), U', = 4.302 m/s, [ = 1.086.
Level 2wUd 6 1.24 5 1.04 4 0.83 3 0.63 2 0.42 1 0.22
Fig. 15. Spatial distribution of the turbulence kinetic energy in the mid-plane of the test room, test (3), partition height = 1.676 m (5.5 ft), gap = 0.152 m (6.0 in.), U<, = 4.302 m/s, ( = 1.049.
of the supply air jet, and one stream travelling through the gap. The presence of the gap between the floor and the bottom of the partition seems to increase the circu- lation in the part of the mid-plane containing the return air opening.
Spatial distribution of the mean speed
Figures 7 to 9 show the spatial distribution of the mean speed in the mid-plane of the test room. The spatial distributions of the mean speed are consistent with observed air flow patterns (Figs 4 to 6). The results show that the supply air jet penetrates a long distance in the room without being dispersed by the room air. The aver- - .
age measured mean air speed in the occupied zone was 0.123 m/s and the maximum air speed was 0.430 m/s. The presence of partitions in the mid-plane of the test room, Figs 8 and 9, seems to reduce the speed magnitudes in the part of the plane containing the return air outlet. In this part of the plane the average air speed was found to be 0.063 m/s for test 2, and 0.073 m/s for test 3.
Spatial distribution of the turbulence intensity
Using the Low Speed Omnidirectional Transducers, the speed fluctuations are measured correctly at fre- quencies of up to 0.1 Hz (approximately f 5%). Figures 10 to 12 show the distribution pattern of the measured turbulence intensity in the mid-plane of the test room. In all test cases, relatively high values of the turbulence intensity were observed at the central regions of the recir- culation eddies, and at regions with low air speeds, with values ranging from 20% to 60%. These high turbulence levels were the results of the local air speed fluctuations, which were comparable in magnitudes with the local air
energy in the test room is almost negligible everywhere except in the diffuser jet region. The turbulence kinetic energy is mainly generated in the diffuser jet region, due to the strong interaction between the incoming air and the room air. This turbulence is then transported to the other regions of the room contributing to the turbulence kinetic energy generated locally within each region. Dur- ing the transport process, the speed fluctuations are damped out by the viscous effects resulting in low values of the turbulence kinetic energy elsewhere in the test room. Similar findings were noted by Zhang (1991).
SUMMARY AND CONCLUSIONS
Detailed experimental data of the air flow properties in a typical office space with and without obstructions (acoustical screens) under isothermal conditions have been presented. The main conclusions of the present study could be summarized as follows.
For the test configuration studied, the air flow pattern at the mid-plane of the test room appears to be pre- dominantly two dimensional.
Relatively high values of the turbulence intensity (20% to 60%) were measured in the test room at the central regions of the recirculation eddies.
The turbulence kinetic energy in the test room was found to be largest in the vicinity of the supply diffuser air jet, and negligibly small in the other parts of the room.
The measured mean speed and turbulence kinetic energy profiles at the supply air opening are uniform. The measured average value of the turbulence intensity is found to be around 9%.
speeds. The turbulence intensity at the intermittent region These data are intended for use in the evaluation of at the edge of the diffuser air jet, where high air speeds the existing numerical and scale models, and to aid in are present, was found to be in the range of 14% to 32%. extending the understanding of the behaviour of ven-
tilation air flows in rooms or offices.
Spatial distribution of the turbulence kinetic energy Acknowledgements-The work leading to this paper was sup- Figures 13 to 15 show the distribution pattern of the ported in part by NSERC Grant No. OGP0006602. The authors turbulence kinetic energy (k) in the mid-plane of the test wish to acknowledge the assistance of ~r C. ~ r o u ~ h t o n in
setting up the test facility and flow visualization equipment for room' In this case, k, defined equation i2), is a measurements. The authors also thank the Building Per- convenient term than the turbulence intensity to charac- formance section (NRC, ottawa, canada) for the terize the significance of turbulence effect on room air facilities and the instruments needed in this study.
REFERENCES
1. A. Koestel and G . L. Tuve, Performance and Evaluation of Room Air Distribution Systems, ASH- RAE Research Report No. 1553, ASHRAE Trans. 61, 533-550 (1955).
2. P. V. Nielsen, A . Restivo and J. H. Whitelaw, The Speed Characteristics of Ventilated Rooms, J. Fluids Engineering, ASME Trans. 100, 291-298 (1978).
3. M. B. Timmons, Experimental and Numerical Study of Air Movement in Slot-Ventilated Enclosures, Unpublished Ph.D. thesis, Cornell University Libraries, Ithaca, N Y (1979).
4. A. D. Gosman, P. V. Nielsen, A. Restivo and J. H. Whitelaw, The Flow Properties of Rooms with Small Ventilation Openings, J. Fluids Engineering, ASME Trans. 102, 316-323 (1980).
5. J. S. Zhang, L. L. Christianson and G . L. Riskowski, Regional Airflow Characteristics in a Mech- anically Ventilated Room Under Non-Isothermal Conditions, Preprint, ASHRAE Trans. 95 (1989). 6. S. Murakami and S. Kato, Numerical and Experimental Study o n Room Airflow-3D Predictions
Using the k-E Turbulence Model, Bldg Envir. 24, 85-97 (1989).
7 . M. Sandberg, Speed Characteristics in Mechanically Ventilated Office Rooms, Room Vent 87, Session 2A. 10-12 June, Stockholm, Sweden (1989).
Measurements
of
Room Air Distribution8. J. S. Zhang. Fundamental Study of Two Dimensional Room Ventilation Flows Under Isothermal and Non-[sothermal Conditions. Ph.D. thesis. University of lllinoisat Urbana-Champaign, 1L (1 991). 9. G. M. Hart and D, Tnr-Hout 111. The Performancc of a Continuous Linear Diffuser in the Interior
Zone of an Open Office Environment. ASHR.4E Trans. 87. Part 2.3 11-320 (19111).
10. D. Jouini, An Experimental Investigation of the Air Flow Properties in ari Office Space, Unpublished Master's thesis. Carleton University at Ottawa, Canada (1992).
11. H. B. Awbi, Application of Computational Fluid Dynamics in Room Ventilation, Bkfq Enuir. 24, 7 3 8 4 (1989).
12. P. V. Nielsen, Specification of a Two-Dimensional Test Case, Energy Conservation in Buildings and Community Systems, International Energy Agency, Annex 20, Research Item No. 1.45, ISSN 0902- 7513 R9040 (1990).
13. Sage Action Inc., Ithaca, NY, Bubble Generator Manual.
14. A. D. Lemaire (Editor), Room Air Contaminant Flow-Evaluation of Computational Methods, Energy Conservation in Buildings and Community System Programme, International Energy Agency, Annex 20, Subtask-I, Summary Report (1992).