Publisher’s version / Version de l'éditeur:
Vous avez des questions? Nous pouvons vous aider. Pour communiquer directement avec un auteur, consultez la
première page de la revue dans laquelle son article a été publié afin de trouver ses coordonnées. Si vous n’arrivez pas à les repérer, communiquez avec nous à [email protected].
Questions? Contact the NRC Publications Archive team at
[email protected]. If you wish to email the authors directly, please see the first page of the publication for their contact information.
https://publications-cnrc.canada.ca/fra/droits
L’accès à ce site Web et l’utilisation de son contenu sont assujettis aux conditions présentées dans le site
LISEZ CES CONDITIONS ATTENTIVEMENT AVANT D’UTILISER CE SITE WEB.
Research Report (National Research Council of Canada. Institute for Research in
Construction), 2008-09-22
READ THESE TERMS AND CONDITIONS CAREFULLY BEFORE USING THIS WEBSITE. https://nrc-publications.canada.ca/eng/copyright
NRC Publications Archive Record / Notice des Archives des publications du CNRC :
https://nrc-publications.canada.ca/eng/view/object/?id=25d04d1b-280a-49d4-a21d-2855a20272f0 https://publications-cnrc.canada.ca/fra/voir/objet/?id=25d04d1b-280a-49d4-a21d-2855a20272f0
NRC Publications Archive
Archives des publications du CNRC
For the publisher’s version, please access the DOI link below./ Pour consulter la version de l’éditeur, utilisez le lien DOI ci-dessous.
https://doi.org/10.4224/20374028
Access and use of this website and the material on it are subject to the Terms and Conditions set forth at
Smoke movement tests in a dwelling unit with a secondary suite
Gibbs, E.; Taber, B. C.; Lougheed, G. D.
http://www.nrc-cnrc.gc.ca/irc
Sm ok e m ove m e nt t e st s in a dw e lling unit w it h a se c onda ry suit e
I R C - R R - 2 9 7
G i b b s , E . ; T a b e r , B . C . ; L o u g h e e d , G . D .
S e p t e m b e r 2 2 , 2 0 0 8
The material in this document is covered by the provisions of the Copyright Act, by Canadian laws, policies, regulations and international agreements. Such provisions serve to identify the information source and, in specific instances, to prohibit reproduction of materials without written permission. For more information visit http://laws.justice.gc.ca/en/showtdm/cs/C-42
Les renseignements dans ce document sont protégés par la Loi sur le droit d'auteur, par les lois, les politiques et les règlements du Canada et des accords internationaux. Ces dispositions permettent d'identifier la source de l'information et, dans certains cas, d'interdire la copie de documents sans permission écrite. Pour obtenir de plus amples renseignements : http://lois.justice.gc.ca/fr/showtdm/cs/C-42
ACKNOWLEDGEMENTS
The initial concept for the project arose from various groups in Alberta who conducted the Ghost Lake Tests. Barry Colledge and Sandy Mackenzie from Morrison Hershfield in Calgray proposed the project to NRC. They also provided support in locating a suitable house and in the logistics for the tests. Particular acknowledgement go to the City of Red Deer, Alberta who provided the house, as well as to Dale Kelly and his colleagues at the Red Deer Fire Department who constructed the secondary suite and provided fire protection services during the tests. The project was
conducted with the support of Canada Mortgage and Housing Corporation (CMHC)
B4191.1 1
Smoke Movement Tests in a Dwelling Unit with a Secondary Suite. by
E. Gibbs, B.C. Taber and G. D. Lougheed
INTRODUCTION
There is an ongoing need to provide affordable housing throughout Canada. One option is the use of secondary suites. However, such accommodation may result in an increase in fire risk to occupants.
In 2004, a series of fire tests were undertaken in houses in the Ghost Lake area of Alberta prior to their demolition. Participants in these tests included the City of Calgary and other local fire departments, the Alberta Government and Morrison Hershfield Limited. These tests investigated smoke movement and detection in residential dwelling units. The tests also provided training opportunities for the fire services.
The results of the tests conducted at Ghost Lake indicated that smoke and fire separations in the building were very effective in controlling the heat and smoke in a closed environment. However, the mechanical ventilation system used for heating and air-conditioning could result in smoke movement between compartments within a
building. In particular, the heating, ventilation and air-conditioning (HVAC) system could circulate smoke from the fire area to other parts of the building. It was recommended that further tests be conducted to investigate this issue [1].
In 2007, NRC-IRC undertook a joint project with various stakeholders including Canada Mortgage and Housing Corporation (CMHC) and the Calgary office of Morrison Hershfield to investigate smoke movement in a residential building with a secondary suite located in the basement. Seven full-scale experiments were conducted in a house provided by the City of Red Deer, Alberta. An area in the basement of the house was set up to represent a room in a secondary suite. The fire tests were used to investigate smoke movement to the main floor of the house as well as to a common exit serving both the main dwelling and the secondary suite. A particular focus of the tests was the potential for smoke transport by an HVAC system that served both the primary and secondary suites. This report provides the results of the project.
REQUIREMENTS FOR SECONDARY SUITES
A secondary suite is a second self-contained living unit located within a primary dwelling unit, where both dwelling units are registered under the same land title [2]. These suites include a kitchen, bathroom and a separate entrance.
A broad range of requirements has been developed in Canada for secondary suites by municipal and provincial jurisdictions. Morrison Hershfield documented these requirements in a report prepared on behalf of CMHC [3].
B4191.1 2
Since this project was conducted in Red Deer, the Alberta requirements for safety standards for secondary suites were used as a reference [2]. Selected requirements from this standard are as follows:
1. The minimum height of rooms and spaces is 1.95 m.
2. Each bedroom must have at least one outside window that can be opened from the inside and would allow emergency exit/access in the bedroom.
3. Windows are not required in any other room.
4. Walls and ceilings must be protected with 12.5 mm thick regular gypsum board. 5. Interconnected smoke alarms between the secondary and main suite must be
provided.
6. The furnace must be in a separate room protected with 12.5 mm thick gypsum board.
7. There must be a separate exit from the secondary suite. This could include a common exit with the main dwelling unit in which a vestibule is separated from the main dwelling unit by a door. Alternatively, there can be a direct exit to the exterior from the secondary suite.
8. For homes with a pre-existing secondary suite, a single heating and ventilation system is permitted. For new construction, each dwelling unit must have an independent heating and ventilation system.
The test house was not modified to meet all the Alberta requirements for secondary suites. For example, the smoke alarms were not interconnected. The results of the project were used to investigate items 2, 4, 5, 7 and 8.
TEST HOUSE
The house used for the tests was located in Red Deer, Alberta and was owned by the City of Red Deer. The dwelling was a one-storey ranch style bungalow with a full basement (Figures 1 and 2). It was located on land that was being used for agriculture purposes. However, the city had purchased the land for eventual use in expanding its landfill site.
Exterior photographs for the house are shown in Figures 1 and 2. A sketch of the main floor is shown in Figure 3. The house is oriented with its major axis in the North-South direction. Figure 1 shows a photograph of the front of the house, which faced towards the driveway leading from the highway. The living room and two
bedrooms were located on this side of the house (Figure 3). There was also an exterior doorway in the living room.
Figure 2 shows the East side of the house. Rooms on this side of the house included the kitchen/dining area, entranceway, bathroom and a bedroom (Figure 3). There were two exits on this side of the house including the patio doors in the
kitchen/dining area, which exited onto a deck (Figure 2).
The main doorway was also located on the East side of the house. The exterior door connected to a large entryway. From this entryway, stairs led to both the main floor of the house and the basement (Figures 3). The entryway was typical of that found in a farmhouse. The landing area was approximately 3.1 m x 2.9 m wide with a 3.2 m ceiling height. The entranceway was separated from the main floor of the house by a doorway located at the top of the stairs. This door was closed for all the tests.
B4191.1 3
Figure 1. View from driveway showing West side of house.
B4191.1 4 Figure 3. Plan for main floor (not to scale).
Kitchen
Living Room Bedroom 2 Master Bedroom
Bedroom 1
Bathroom Entryway Dining Area (5.8 x 4.1 m) (3.0 x 3.0 m) (3.9 m x 3.0 m) (3.4 x 3.5 m) (2.2 x 3.3 m) (3.3 x 3.3 m) North LEGEND Video camera Smoke alarm Thermocouple Smoke density meter Sampling smoke meter PressureCO/CO2 Supply Return
B4191.1 5 Figure 4. Plan for basement (not to scale).
INSTRUMENTATION
Video camera Smoke alarm Thermocouple Thermocouple tree Sampling smoke meter Pressure North Family Room Storage Bedroom Bathroom Furnace Fire HVAC Supply outlet Return basement Return duct Main supply duct Supply ducts
B4191.1 6
The house included a full basement, which had been previously finished to include a family room, a bedroom and a bathroom as well as storage areas and furnace room. A sketch for the basement as modified for the tests is shown in Figure 4.
For the experiments conducted for this project, a wall was constructed to divide the existing L-shaped family room into two rooms with one room along the South end of the house and a second room at the center of the basement outlined in green in
Figure 4. The room along the South end of the house was not modified. The walls and ceiling of the fire compartment formed in the central section of the basement was lined with 12.5 mm thick regular gypsum board. This room was used to represent a living area in a secondary suite and was the location of the fire for all the experiments.
Doorways connected the fire compartment to the family room on the South end of the dwelling, a storage area, the basement bedroom and the furnace room. For the experiments, these doorways were covered with 12.5 mm thick regular gypsum board to minimize the risk of fire spread to other areas in the basement.
The fire compartment connected through a doorway to the exit stairway to the main entryway for the house (Figure 4). A hollow core door from one of the bedrooms in the house was mounted in the doorway and was closed for all the tests. The same hollow core door was used for the first six tests. The door used on the doorway between the entryway and the main floor of the house was moved to this location for the seventh test.
A sprinkler system was installed in the basement as a safety measure. The fire department could, if necessary, connect to the system and provide sprinkler suppression to a fire in the basement area. Two sprinklers were located in the fire compartment. HEATING AND VENTILATION SYSTEM
Heating and ventilation was provided by a central forced air system located in the furnace room in the basement. The existing furnace and ductwork were used for the experiments. However, the original motor and fan had been removed from the dwelling unit. A contractor installed new systems for the tests.
Two main supply ducts were connected to the furnace plenum. The locations of the main, secondary ducts and outlets in the basement are shown in Figure 4. The North duct was rectangular with dimensions of 205 mm by 250 mm. It supplied air to the two bedrooms on the main floor at the North end of the house as well as the bedroom and bathroom in the basement through 125 mm diameter round ducts. (The locations of the supply outlets on the main floor are shown in Figure 3.)
The South duct was rectangular with dimensions of 180 mm by 360 mm. It supplied air to the kitchen/dining area with outlets located at the base of the cupboards and near the patio doors, living room (outlets located at the South and North ends of the window), upstairs bathroom, Bedroom 2, the entryway, the family room (outlets located at the East and West ends of the room), the fire compartment and the furnace room through 112 mm inner diameter round ducts.
A main duct mounted to the bottom side of the joists was used for return air. This duct was connected through duct sections formed in the joist spaces using sheet metal
B4191.1 7
to the return air inlets. The locations of the return air inlets on the main floor are shown in Figure 3.
Table 1. Furnace supply ducts.
Duct Velocity Airflow
(m/s) (m3/s)
Main Duct (South) 3.40 0.220
Main Floor (South Duct)
Kitchen 2.24 0.014
Dining Area 1.45 0.022
Living Room (North) 1.62 0.016
Living Room (South) 1.87 0.018
Bedroom 2* 1.50 0.026
Bathroom 0.85 0.008
Entryway 1.40 0.014
Total South Duct Main Floor 0.118
Basement (South Duct)
Family Room (East) 2.90 0.029
Family Room (Northwest) 1.62 0.016
Family Room (Southwest) 2.40 0.024
Fire Compartment 2.40 0.024
Furnace Room# 0.72 0.017
Total South Duct Basement 0.110
Main Duct (North) 2.05 0.108
Main Floor (North Duct)
Master Bedroom 1.75 0.017
Bedroom 1 4.00 0.039
Total North Duct Main Floor 0.056
Basement (North Duct)
Bathroom 3.20 0.032
Bedroom 1.75 0.017
Total North Duct Basement 0.049
*The airflow velocity into the furnace room was measured at the 250 mm by 95 mm outlet. #The airflow velocity into Bedroom 1 was measured at the 310 mm by 55 mm outlet.
All except one of the return air inlets were located on the main floor of the house. In the original layout of the system, there was one return air inlet in the basement at the
B4191.1 8
location shown in Figure 4. This inlet was located in the fire compartment and
connected to the main return duct through a duct formed in the joist space. The inlet in the basement was located directly below the return air inlet in Bedroom 2 and the corresponding inlet in the corridor. This inlet was closed (covered with 12.5 mm thick gypsum board) for all tests except Tests 4 and 5.
A hot wire anemometer was used to measure the airflow velocity at the center of the two main supply ducts and the supply ducts servicing each area in the house. The supply ducts to the outlets in Bedroom 1 and the furnace room were not accessible. An
average velocity was measured at the outlet. There were no measurements taken in the return air duct. (Note: no changes were made to the ducts or the outlets to balance the airflow in the system.)
The results of the airflow measurements for the supply air system are summarized in Table 1. The velocities were used to estimate the volumetric airflow through each duct.
The estimated volumetric airflow through the main ducts is comparable to the total estimated based on the volumetric flow rates through the branch ducts
(within 3%). The total volumetric airflow produced by the furnace fan was approximately 0.328 m3/s (694 cfm). The results shown in Table 1 indicate that approximately 0.174 m3/s was supplied to the main floor and 0.159 m3/s to the basement.
FIRE SCENARIO
The primary objective of the tests was to investigate smoke movement within the dwelling unit. The parameter was the configuration of the heating and ventilation
system. Tests were conducted with the furnace fan on or off and with the return inlet open or closed in the fire compartment. The furnace configuration for each test is summarized in Table 2.
Table 2. Furnace configuration.
Test Furnace Fan Basement Return Air Inlet
1 On Closed 2 On Closed 3 Off Closed 4 On Open 5 Off Open 6 On Closed 7 Off Closed
Test 1 was a preliminary test to ensure all equipment and instrumentation were operational and to determine the fuel load that should be used in tests. Tests 2-6 were conducted with the same fuel load and were used to investigate the effect of the heating and ventilation system on smoke movement. The fuel load was increased for Test 7 and
B4191.1 9
this test was used to investigate the performance of the exit door from the fire compartment.
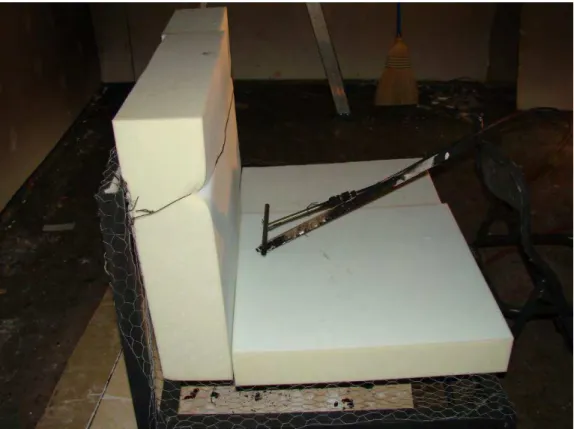
A mock-up sofa was used in each of the tests. The mock-up sofa was constructed with blocks of flexible polyurethane foam (with a density of 32.8 kg/m3) placed on a metal frame. The metal frame was similar in construction to that specified in ASTM 1537 [4].
Each polyurethane block was 610 mm long x 610 mm wide and 100 mm or 150 mm thick. The 150-mm-thick foam blocks were used for the backrest and the
100-mm-thick foam blocks for the seat cushion. The polyurethane foam blocks were the same as those used in the Fire Performance of Houses project. Further information on the polyurethane foam including the results of bench- and full-scale tests is provided in References [5, 6].
For Test 1, two blocks of polyurethane foam with a total weight of 3.05 kg were used (one seat and one backrest). For Tests 2-7, the mock-up sofa consisted of 1 ½ blocks of polyurethane foam with a total weight of 4.57 kg used as the seat and the back (Figure 5).
The mock-up sofa used for the majority of the tests in this project had 50% of the polyurethane used in the tests for the Fire Performance of Houses. The amount of polyurethane was limited to minimize the size of the fire and thus the potential for fire spread to other areas of the house.
The mock-up sofa was located at the center of the fire compartment. This was done to minimize the potential damage to the gypsum board on the walls of the room by the tests. The fire did affect the gypsum joints on the ceiling of the room directly above the fire. A second layer of gypsum board was used to cover these joints prior to Test 5 to ensure the fire did not penetrate into the joist space.
For Test 7, a wood crib was located under the sofa. The wood crib consisted of nominal 2 x 4 SPF wood studs purchased locally. The studs were cut into 1.2 m lengths and stacked to form 4 layers with 6 of the 1.2 m long wood studs per layer (Figure 6).
For Test 1, no openings other than the gaps around the doorway and gaps in the wall and ceiling construction were provided between the fire compartment and the remainder of the house. For Tests 2-6, a 500 mm high by 1.1 m long opening was located in the wall between the fire compartment and the basement family room. For tests 1-5, all windows in the house including those in the basement were closed during the test. For Test 6, one window in the South wall of the basement family room was open and for Test 7 both windows were open. The window openings were
approximately 460 mm high by 750 mm in length.
For Test 7, the ventilation opening between the fire compartment and the family room was increased to 1.6 m in length. The height was maintained the same. The size of the opening was a bit larger than but comparable to the size of the two open windows.
In all tests, the mock-up sofa was ignited using a propane T-burner located at the center of the seat (Figure 5). The burner is described in ASTM 1590 [7]. The propane was provided from a barbeque tank purchased locally. The flow rate to the propane
B4191.1 10 Figure 5. Mockup sofa arrangement for Tests 2-6.
B4191.1 11
burner was controlled using a flow meter in accordance with ASTM 1537 [4] and provided heat output of approximately 17.8 kW.
A pilot flame was used to ignite the ignition burner. The pilot consisted of a 6 mm diameter copper tube located above the ignition source. Propane was provided to the pilot using a small propane tank of the type typically used for soldering. The propane flow was adjusted to give an approximately 75 mm long flame.
INSTRUMENTATION
Since the experiments were conducted in the field, the instrumentation was limited with the objective of being able to install the equipment within 1 ½ days onsite. The instrumentation used in the tests was as follows:
1. Thermocouples. A thermocouple tree was located in the Northwest corner of the fire compartment. The tree was located approximately 300 mm from the two walls (Figure 4). The thermocouples were 30 mm, 445 mm, 930 mm and
1420 mm below the ceiling. A thermocouple was also located approximately 30 mm below the ceiling at the center of the fire compartment. In addition, a thermocouple was used to measure the temperature in the return air opening in the corridor adjacent to Bedroom 1 for Tests 3 – 5 (Figure 3). This return air opening was directly above the return air inlet in the ceiling of the fire
compartment (Note: prior to Test 4, the wood joists, sub floor and carpet in the corridor and Bedroom 1 were sprayed with No-Burn to limit the potential for the fire to spread into the joist space or to the main floor. This material was also sprayed on the thermocouple resulting in high temperature measurements.) This thermocouple was used to determine if the fire was spreading from the fire compartment to the upper floor of the house. In Test 5 and 6, this thermocouple was used to measure the temperature at the top of the hollow core door at the exit of the fire compartment. The thermocouple was located at the center of the door approximately 25 mm from the top of the door with the bead in contact with the door.
2. Airflow. A bi-directional probe and thermocouple was located at the center of the South branch duct from the furnace to measure airflow velocity. The devices were located at the center of the duct mid-way between the furnace plenum and the first branch duct, which supplied air to the furnace room.
3. Smoke optical density. The optical density of the smoke was measured using LED transmitter-detector systems located in the main entryway and the upstairs corridor. The devices were located at the 1.5 m height at locations shown in Figures 3. A similar device was used to measure the smoke optical density in the main supply plenum on the furnace. A sampling smoke measurement system was used to measure the smoke optical density in the fire compartment for Tests 1 - 4. A 125 mm diameter flexible metal duct was inserted through the return air inlet in Bedroom 1 and in the ceiling of the fire compartment. Its inlet was 1.5 m above the basement floor at the location shown in Figure 4. A small fan was used to sample the smoke from the test area. The smoke was pulled through the measurement device and exhausted outside through the window in Bedroom 1. The smoke measurements were repeatable in the fire compartment and the device was used to measure the smoke optical density at the 1.5 m height in Bedroom 1 (Figure 3) in Tests 5 - 7. Further information on the smoke measurement systems are provided in Reference 8.
B4191.1 12
4. Pressure difference. A pressure tap (copper tube) was inserted through the floor from Bedroom 1 into the fire compartment. The end of the copper tube was 40 mm below the ceiling of the fire compartment. This pressure tap was
connected to a manometer and was used to measure the pressure difference between the fire compartment and the main floor of the house (Bedroom 1). 5. Smoke detectors. Residential ionization smoke detectors were located in the
kitchen/dining area and the fire compartment (Figure 3 and 4). The device in the kitchen/dining area was centered in the alcove near the main exit door to the entryway (Figure 3). The device in the fire compartment was located
approximately 450 mm from the doorway (Figure 4). The smoke detectors were not interconnected. The response times of the smoke detectors were monitored using the data acquisition system. The response times were also monitored using the audio portion of the video recordings. The response of the smoke detector in the fire compartment was repeatable in Tests 1 – 3. It was moved to the furnace room for Tests 4 – 7.
6. Gas analyzer. A gas analyzer was used to measure carbon monoxide and carbon dioxide concentrations in the entryway. The inlet for the gas sampling tube was located at the 1.5 m height at the same location as the smoke optical density measurement (Figure 3).
7. Video cameras. Video cameras were located in the main entryway to view the exit stairs from the fire compartment and the main floor and in the living room to view the corridor from the bedrooms (Figure 3). A third camera was located in the basement family room to record the fire event through a window located in the South wall of the fire compartment (Figure 4).
8. Firefighter’s gas analyzer. A gas analyzer provided by the Red Deer fire department was used in Tests 2 - 7. Fire department personnel use this type of analyzer to check air quality in rooms for safety purposes. It measured oxygen, CO, H2S and Cl2 concentrations in ppm. It also measured the lower explosion
limit (LEL) of the smoke as a percentage. The inlet for the device was located in the fire compartment at 1 m height above the floor. The device includes a small fan to sample the air. The system does not include provisions for data output to a data acquisition system. However, it retains in memory the maximum levels of each gas measured until it is reset.
9. Sprinkler activation. An air compressor was used to fill the sprinkler piping with compressed air and a pressure gauge mounted outside the house used to monitor the pressure. Based on the pressure drop in the piping system, the activation time of the first sprinkler in the fire compartment was determined. Three data loggers with 8 channels each were used for data acquisition. Data was acquired at 1 s intervals.
TEST PROCEDURE
Prior to each test, the heating and ventilation system was configured and the house set-up as required for the test. This included closing window and doorways on the main floor.
The pilot flame was lit and adjusted to the required length and the three video cameras in the house were started. Once all personnel were clear of the house, the data acquisition was started. At the same time, an air horn was sounded to provide an audio signal for the video cameras.
B4191.1 13
One minute after starting the data acquisition, the propane valve for the main ignition source was opened.
For all tests except Test 4, data was acquired for 900 s. After 900 s, the
firefighters entered the house and checked the fire area and opened doors and windows in the basement. A portable fan was used to provide positive pressure to ventilate the fire area.
The doors and windows on the main floor were opened to clear any smoke that had migrated to this level.
In Test 4, the thermocouple monitoring the temperature in the corridor on the main floor at the return air inlet indicated a high temperature. The test was terminated and the firefighters sent in to check for fire spread.
RESULTS
Seven tests were conducted over a 2 ½ day period. The complete results of the tests are provided in Appendix A. Plots are provided showing the temperatures
measured in the fire compartment, smoke optical densities, pressure measurements, CO and CO2 concentrations and velocity in the duct.
In this section, composite plots for selected parameters for Tests 2-7 are provided and discussed. This includes:
1. the temperature measured at the ceiling directly above the fire;
2. the temperature at the 2.4 m height at the thermocouple tree in the corner of the compartment;
3. the smoke optical densities measured in the fire compartment, in the furnace duct, in the entryway and on the main floor;
4. the pressure difference between the fire compartment and the main floor level; 5. the carbon monoxide and carbon dioxide concentrations in the entryway; 6. the smoke alarm response in the fire compartment (Tests 1 - 3), the first floor
and in the furnace room (Tests 4 - 7). Temperatures
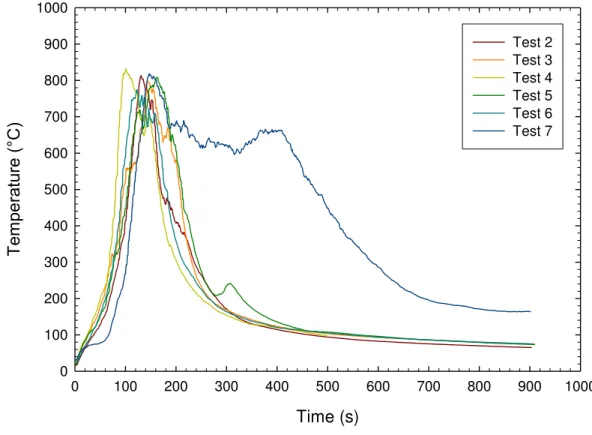
The temperatures measured at the ceiling directly above the fire are shown in Figure 7. For Tests 2 – 6, the temperature profiles were similar with an initial growth to a peak temperature followed by a decreasing temperature once the polyurethane foam was consumed.
The initial temperature profile for Test 7 was similar to the other tests including an initial decrease in temperature as the polyurethane foam was consumed. However, with the burning of the wood crib located beneath the sofa mock-up, a high temperature was maintained until approximately 450 s followed by a slow decrease in temperature. Some of the wood was still burning at the end of the test resulting in the higher
B4191.1 14 Time (s) 0 100 200 300 400 500 600 700 800 900 1000 Tem pe rat ure (°C) 0 100 200 300 400 500 600 700 800 900 1000 Test 2 Test 3 Test 4 Test 5 Test 6 Test 7
Figure 7. Temperatures at ceiling directly above the fire.
Time (s) 0 100 200 300 400 500 600 700 800 900 1000 Tem pe rat ure (°C) 0 100 200 300 400 500 Test 2 Test 3 Test 4 Test 5 Test 6 Test 7
B4191.1 15
Table 3. Peak temperatures measured in the fire compartment. Peak Temperature ( C) Test Time Peak Centre 2.4 m 1.9 m 1.4 m 0.9 m 0.4 m (s) 1 152 498 269 282 235 189 109 2 131 813 445 476 358 292 238 3 193
798
469
493
382
306
245
4 101 832 436 477 428 343 275 5 161 808 414 447 405 302 198 6 123 775 413 441 384 304 246 7 147 819 358 384 350 293 204The temperatures measured 30 mm below the ceiling (2.4 m height) at the thermocouple tree location in the corner of the fire compartment are shown in Figure 8. The temperatures at this location were similar to those measured directly above the fire. However, the peak temperature was lower as shown in Table 3. The maximum
temperature directly above the fire was approximately 775 - 832 C compared with the highest temperature at the thermocouple tree, 441 – 493 C, which were measured at the 1.9 m height.
The time at which the peak temperature at the ceiling directly above the fire occurred is also provided in Table 3. There was a variation in the time to peak temperature. This variation corresponded to whether or not the furnace fan was
operating. The shortest times occurred in Tests 2, 4 and 6 with the fan on. These were also the tests with the highest peak temperatures. These results suggest that the additional air supplied by the fan affected the fire dynamics in the fire compartment.
The time at which the peak temperatures were measured at the other locations in the fire compartment were typically within 0 - 20 s after the peak temperature directly above the fire. The longest time was for the temperature measured at the 0.4 m height.
The temperature profiles shown in Figures 7 and 8 as well as the peak temperatures shown in Table 3 indicate there was limited test-to-test variation in the conditions in the fire compartment. Other than the effect of the furnace fan observed in Tests 2 – 6, the other differences were due to the change in ventilation conditions and fuel load.
In Test 1, the mock-up sofa consisted of only two sections of foam. Also, ventilation was limited to airflow through gaps and openings in the doors and the wall and floor assemblies as well as the air supplied by the furnace fan. The lowest peak temperatures were measured in this test.
For Test 7, the size of the ventilation opening was enlarged to provide more airflow into the fire compartment. Also, two basement windows were opened on the windward (South) side of the building. The effect of the wind may account for the decrease in the temperatures measured at the thermocouple tree location in the fire
B4191.1 16
compartment. The additional fuel load (wood cribs) extended the time duration with high temperatures.
Smoke Alarm Activation
Two smoke alarms were installed in the house for each test. For Tests 1 - 3, the smoke alarms were installed in the fire compartment and the entryway in the
kitchen/dining area on the main floor of the house. For Tests 4 - 7, the smoke alarm in the fire compartment was relocated to the furnace room.
The response times for the smoke alarms are provided in Table 4. The smoke alarm in the fire compartment was very close to the fire and responded early in the fire event (17-18 s). Since the smoke alarm response in the fire compartment was
consistent, this device was moved to the furnace room to obtain data for another area in the basement, which was separated from the fire compartment. The response time for this location varied from 78 – 120 s. The two sets of results give an indication of the potential variation in alarm time depending on whether the smoke alarm is located in the same room as the fire or in a separate room.
Table 4. Response time for the smoke alarms.
Test Kitchen Entryway Fire Compartment Furnace Room
(s) (s) (s) 1 NA 18 NU 2 176 18 NU 3 306 17 NU 4 156 NU 106 5 195 NU 97 6 NA NU 78 7 244 NU 120
NA – not activated NU – not used in test
For the smoke alarm located on the main floor of the house, the response time varied from 156 – 306 s. There were also two cases in which the smoke alarm did not activate: Tests 1 and 6. The non-activation in Test 1 was most likely due to the reduced size of the fire load and the limited openings between the fire compartment and the rest of the building.
The results indicate the response of the smoke alarm in the kitchen entryway was dependent on the configuration used for the furnace system. The response time was earlier in Test 2 with the furnace fan operating than in Test 3 without the furnace fan operating. The earliest response time was in Test 4 with the return air inlet open in the fire compartment and the furnace fan on. The response time in Test 5 with the return air inlet open in the basement but with the furnace fan off was longer than in Test 4.
B4191.1 17
There was no activation of the smoke alarm in the kitchen/dining room in Test 6. Other tests indicated that the smoke alarm would typically operate for this scenario. The reason for the detector not operating is not known.
The above results indicate that the smoke alarm response on the main floor could take a relatively long time for the fire scenario used in the experiments. The response time was dependent on the furnace operation. Both the operation of the furnace fan and the opening of the return air inlet in the basement resulted in more smoke propagating to the main floor and an earlier activation of the smoke alarm.
The results would suggest that for life safety purposes that the smoke alarms in secondary suites should be interconnected to the alarms in the main dwelling unit. This would be particularly important if separate heating and ventilation systems are used for the two areas. As such, the results support the requirement in the Alberta code for interconnected smoke alarms.
Pressure Measurements
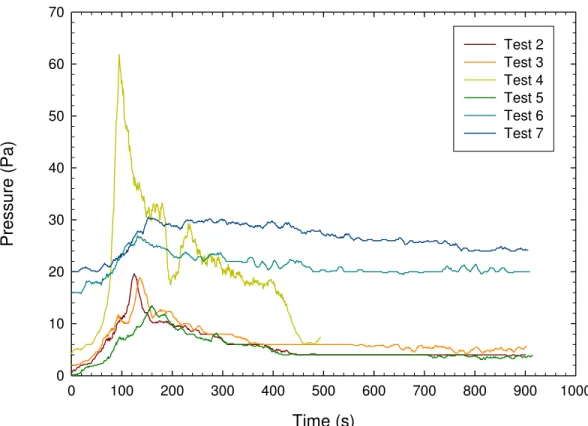
The pressure difference between the fire compartment in the basement and Bedroom 1 on the main floor directly above was measured. The results are shown in Figure 9 for Tests 2-7.
For low-rise buildings, the main phenomena that affect pressure differences are: 1. the expansion of the air in the fire room due to the initial heating of air;
2. buoyancy; 3. wind effect.
The increase in pressure difference (10 – 20 Pa) in Tests 2, 3, 5-7 is typical of the change in pressure between a fire compartment and adjacent areas produced by the initial expansion of the air and the buoyancy effect [9].
The high pressure difference indicated for Test 4 is not typical of the pressure differences produced by the effects of the fire. The reason for the high peak levels is not known. This was the test with the furnace fan operating and return inlet in the fire
compartment open, which may have affected the pressure differences.
Comparable pressure differences were measured in Tests 2 and 3. The only difference between these two tests was the operation of the furnace with the furnace operating in Test 2 and shut off in Test 3.
The pressure difference measured in Test 5 was similar to but slightly lower than measured in Tests 2 and 3. In Test 5, the furnace was shut off and the return air inlet in the fire compartment was open. The open return air inlet provided a direct leakage path between the fire compartment and the main floor, which would reduce the pressure difference.
In Tests 6 and 7, windows in the south end of the basement were open during the test. These open windows were on the windward side of the building resulting in the initial pressure difference of 15 - 20 Pa between the fire compartment and the main floor.
B4191.1 18
The increased pressure difference produced by air expansion and buoyancy was 10 – 12 Pa and was comparable to that measured in Tests 2, 3 and 5.
Time (s) 0 100 200 300 400 500 600 700 800 900 1000 P ress ure (P a) 0 10 20 30 40 50 60 70 Test 2 Test 3 Test 4 Test 5 Test 6 Test 7
Figure 9. Pressure difference between fire compartment and main floor. Smoke Optical Density
Smoke measurements were made at five locations in the building (Figures 3 and 4):
1. The fire compartment (Tests 1-4). 2. The main furnace supply plenum. 3. Main entryway.
4. Main floor corridor.
5. Bedroom 1 on the main floor (Tests 5-7).
The results of the smoke measurements are shown in Figures 10 – 14.
In this report, the smoke obscuration is expressed as the optical density per meter (OD in m-1):
I
I
L
OD
0 10log
1
(1)where
I
0 is the intensity of the incident light, I is the intensity of the light transmittedthrough the path length, L (m), of the smoke. The optical density is related to the extinction coefficient (k in m-1) by OD = k/2.303.
B4191.1 19
A relationship between the optical density per meter and visibility was developed by Jin [10]. For front illuminated objects,
Visibility (m) = 1/(OD/m) (2)
For back illuminated objects such as exit signs, visibility is 2.5 times that of objects with front illumination.
For this project, the visibility for front illuminated objects is the one of interest. A plot of visibility versus the smoke optical density is provided in Figure 15.
Various threshold OD values related to the loss of visibility have been suggested for small buildings with occupants familiar with the egress route. The limiting OD value was suggested to be 0.5 m-1 for non-irritating smoke and 0.2 m-1 for irritating smoke [11]. Babrauskas also set a limiting OD value of 0.5 m-1 as a result of full-scale burns of
upholstered chairs and mattresses [12, 13]. A recent home smoke alarm study used an OD of 0.25 m-1 as the tenability limit for smoke obscuration [14]. In ISO 13571[15], the minimum visible brightness difference between an object and a background is used to estimate the smoke obscuration limit at which occupants cannot see their hands in front of their faces (a distance of 0.5 m or less). It is estimated that occupants cannot see their hands in front of their faces and become disoriented at an optical density of 3.4 m-1. For an occupant whose vision is less precise, this can happen at an optical density of 2 m-1 or less.
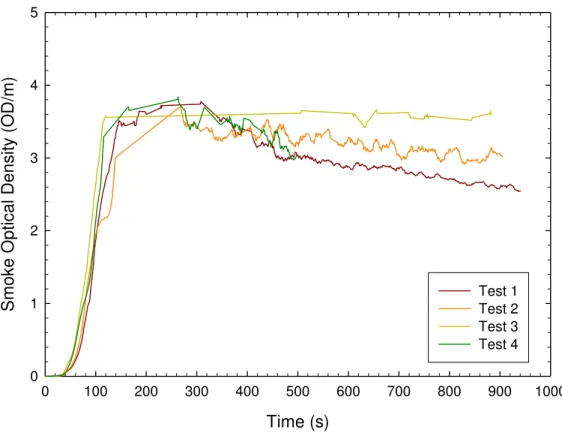
The smoke optical densities measured at the 1.5 m height in the fire compartment are shown in Figure 10 for Tests 1-4. The device used for this measurement becomes saturated at approximately 3.5 OD/m. The results shown between 100 and 300 s are minimum values. The smoke optical densities in the fire compartment were likely higher during this time. The higher smoke optical densities measured in the furnace duct also supports this assumption. For example, peak smoke optical densities of approximately 7 OD/m (Figure 11) were measured in the furnace duct during Tests 3 and 5. These smoke densities are consistent with the 4 – 10 OD/m expected in a compartment with a fully developed fire [9].
The results for the smoke optical density measurements indicate that an optical density of 2 OD/m was exceeded at 90 – 100 s in the fire compartment . At this level, the visibility range is approximately 0.5 m.
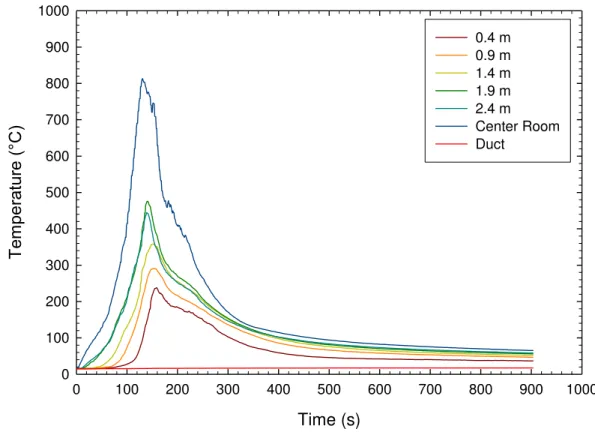
The smoke levels were not measured at lower heights inside the fire
compartment. However, the temperature data measured at the thermocouple tree in the corner room indicated that peak temperatures were measured at the 0.4 and 0.9 m height at approximately 150 s in Test 2 (Figure 16).
Based on the smoke optical density measurements and the smoke alarm times shown in Table 4, occupants would have at most 120 s to escape the basement area through the fire compartment with the smoke alarm located in the same room as the fire. Less time would be available if the smoke alarm was located in a separate room (<70 s). Both of these times are short compared with the typical response time for occupants [16]. This study suggested that a minimum of 120 s was required for occupants to reach safety for fires in a single-family dwelling unit.
B4191.1 20
The analysis indicates that an occupant could become trapped in a room
adjacent to the fire compartment in the case where access to the main exit is through the fire compartment. These results emphasize the need for secondary exits as is provided by the bedroom window required by the Alberta code [2].
The smoke optical densities measured in the furnace duct are shown in Figure 11. The results are dependent on whether or not the furnace was operating during the test. For Tests 3, 5 and 7 with the furnace off, there was smoke flow into the supply inlet in the fire compartment and subsequently into duct on the furnace where the smoke measurement was made.
The airflow velocity in the south section of the main supply duct is shown in Figure 17. With the furnace fan not operating, an airflow velocity of between -1 and -3 m/s was produced in the South supply duct. The negative velocity indicates that the airflow was towards the furnace.
The supply duct for the fire compartment connected to the main south supply duct downstream of the supply ducts to the furnace room and the main entryway. It connected to the main supply duct upstream of the ducts supplying the south section of the basement and the living room and kitchen areas on the upper floor. (Upstream and downstream are relative to the normal airflow in the duct produced by the furnace fan.) The airflow velocity was measured on the upstream end of the main supply duct prior to any connections to branch ducts. In addition to the smoke flow towards the furnace, it can also be assumed that there was smoke flow towards the downstream end of the duct and the supply outlets in the south end of the basement, the living room and the kitchen.
The main supply duct was 180 mm by 360 mm giving an area of 0.065 m2. Assuming the fire induces an airflow of 3 m/s in both directions in the south supply duct, the smoke flow rate through the HVAC system would be approximately 0.39 m3/s for the scenarios used in these tests. This flow rate is comparable to the total airflow produced by the furnace fan (0.33 m3/s). This smoke would be distributed to both the basement and the main floor of the dwelling unit.
The total volume of the test house including the basement was approximately 635 m3. Both the furnace system and the smoke flow produced by the fire are equivalent to approximately 2 ACH for the total building.
With the furnace fan operating, the smoke optical density measured in the furnace supply plenum increased at a slower rate. The velocities measured in the south section of the main supply duct did not vary during the test (Figure 17) indicating there was no backflow of smoke through the supply duct to the furnace. In Tests 2 and 5, the smoke optical density measured in the furnace supply plenum did reach 1 OD/m in 500 – 600 s. This increase in the smoke optical density was most likely due to re-circulation of smoke into HVAC system through the return air system.
In Test 4, there was a more rapid increase in smoke optical density in the furnace supply plenum. In this test, the furnace was operating and the return air inlet in the fire compartment was open. With the return air inlet open, there was direct flow of smoke into the furnace system through the return air duct.
B4191.1 21
The smoke optical densities measured at the 1.5 m height in the main entryway is shown in Figure 12. There was an increase in the measured optical density starting at 150 s. For Tests 2-6, the smoke optical density reached 0.25 – 0.5 OD/m at
approximately 200 s. It subsequently increased slowly during the remainder of the test. Based on observations most of the smoke accumulation in the main entryway was due to smoke leakage around the door to the fire compartment. The gap around this door was consistent with that for normal interior doors.
The duration of smoke flow through the gap around the door was limited by the duration of the fire. With the short fire duration in Tests 2-6, there was limited increase in smoke accumulation after 200 s. This is consistent with the assumption that the primary smoke accumulation in the entryway between 150 and 200 s was due to smoke flow through the gap around the door. The subsequent accumulation of smoke was most likely due to smoke circulation produced by the furnace fan.
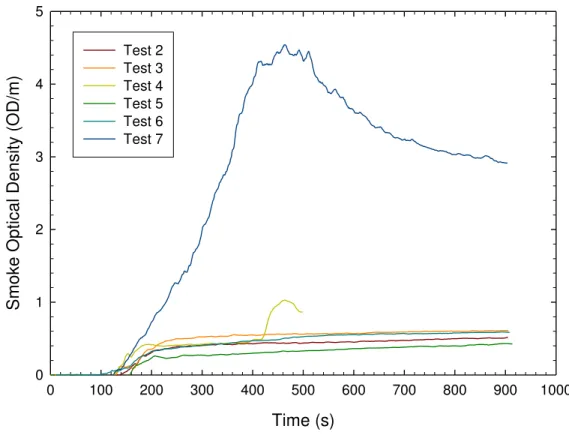
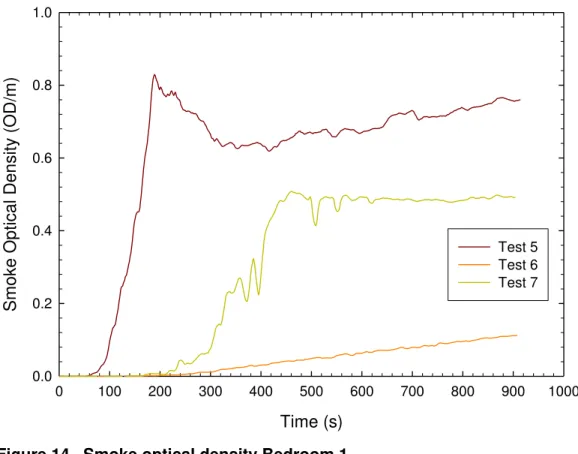
In Test 7, the fire duration was longer resulting in additional smoke flow into the entryway. The smoke optical density reached 2 OD/m at 300 s, which would make it very difficult for occupants to exit the dwelling unit. As with the smoke analysis for the fire compartment, this result indicates that occupants could become trapped in the basement unless a secondary exit is provided as required by the Alberta code [2]. Figures 13 and 14 show the smoke optical densities measured at the 1.5 m height in the corridor on the main floor and the Southwest bedroom, respectively. The results for Tests 4 and 5 with the return air inlet open in the fire compartment are of particular note. In these tests, the base of the smoke layer beneath the ceiling was down to the 1.5 m height at approximately 60 s in the bedroom and 100 s in the corridor. The smoke optical densities increased to a maximum of 0.7 – 0.85 OD/m within 300 s with the lower level measured in Test 4 with the furnace operating. In this case, more of the smoke entering the return air inlet would be diverted to the furnace rather than to the main floor.
The smoke accumulation in the bedroom and the corridor on the main floor was for a short duration fire. A longer duration fire such as that in Test 7 would likely have resulted in higher smoke optical densities making it difficult for occupants to exit the main floor via the corridor. The smoke could also produce low visibility in rooms with return air inlets that are directly connected to the return air duct at the same location as the inlet in the basement as was the case for the main floor corridor and Bedroom 1.
For the tests without the return air inlet open in the basement, smoke was not measured at the 1.5 m height until approximately 200 s in Bedroom 1 and approximately 450 s in the corridor on the main floor. The increase in smoke optical density was relatively slow in the tests with a short duration fire with maximum levels of
approximately 0.1 OD/m at the end of the test (900 s).
There was a more rapid increase in the smoke optical density in Test 7 with the longer duration fire. In this test, a maximum smoke optical density of approximately 0.5 OD/m was measured in the Bedroom 1 at approximately 450 s. The smoke buildup in the corridor was slower with a maximum smoke optical density of approximately 0.35 OD/m at 900 s.
B4191.1 22
The results of the smoke measurements on the main floor indicate that the primary concern with using the same HVAC system for both a secondary suite in the basement and the main floor is the scenario in which there is a return air inlet in the basement area. In this case, there can be direct smoke movement into the upper floor resulting in an early buildup of smoke in both rooms and egress routes. With larger fires than those used in this project, there is also the possibility of fire spread into the joist space and into the upper floor producing a further hazard for occupants on the main floor.
The accumulation of smoke on the main floor in the tests with the return air inlet in the basement closed was slower. However, the results of Test 7 did indicate that a larger fire might result in accumulation of smoke in both rooms and egress routes in the main floor within 450 – 900 s that could be a concern for occupant safety if early warning is not provided.
There may also have been leakage of smoke from the fire compartment into the main floor. The walls and ceilings of the fire compartment used regular gypsum board and wood studs and joists and would have had leakage consistent with such
construction. There was also smoke flow from the fire compartment through the
ventilation opening into the South section of the basement. The floor/ceiling assembly in this area was not altered for the tests and did have some leakage openings to the living room and kitchen on the main floor. How much this contributed to the smoke
accumulation on the main floor is not known. However, the earlier smoke accumulation and higher smoke optical densities measured in Bedroom 1 would suggest that the dominant mechanism for smoke movement was the furnace fan.
The tests in this project were conducted using the duct arrangement present in the test house. The arrangement was typical of that found in single family dwelling units with the duct work located in the basement on the underside of the joists. With such systems the supply air outlets and return air inlets on the main floor are at floor level. However, for the basement, they are typically located at ceiling level as in the test house. This is not the ideal situation for a fire event as smoke will accumulate at the ceiling and enter the ductwork early in the fire incident. An alternative solution that was not explored in the experiments in Red Deer would to locate the return inlets and supply outlets for combined system at floor level. In principle, this option should reduce smoke movement through the furnace system. Such a system should be evaluated particularly for the situations in which the code allows a singly heating and ventilating system be used both the main dwelling unit and the secondary suite.
The above results would suggest that the following precautions could be taken to minimize the effects of a fire in a basement secondary suite on occupants on the main floor:
1. If a common forced air HVAC system is used for both areas, care should be taken in locating any return air inlets in the basement. It would be preferable if the supply outlets and return inlets were located near the floor to minimize smoke movement through the HVAC ductwork. However, the preferable solution would be to use separate HVAC systems for the primary and secondary dwelling units. 2. The smoke alarms in the two areas should be interconnected to maximize the
B4191.1 23 Time (s) 0 100 200 300 400 500 600 700 800 900 1000 S m oke O pt ical Den sit y (OD/ m ) 0 1 2 3 4 5 Test 1 Test 2 Test 3 Test 4
Figure 10. Smoke optical density in fire compartment.
Time (s) 0 100 200 300 400 500 600 700 800 900 1000 S m oke Opt ic al Dens it y ( OD/ m ) 0 1 2 3 4 5 6 7 8 9 10 Test 2 Test 3 Test 4 Test 5 Test 6 Test 7
B4191.1 24 Time (s) 0 100 200 300 400 500 600 700 800 900 1000 S m oke O pt ical Den sit y (OD/ m ) 0 1 2 3 4 5 Test 2 Test 3 Test 4 Test 5 Test 6 Test 7
Figure 12. Smoke optical density entryway.
Time (s) 0 100 200 300 400 500 600 700 800 900 1000 S m oke Op tical Densit y ( OD/ m ) 0.0 0.2 0.4 0.6 0.8 1.0 Test 2 Test 3 Test 4 Test 5 Test 6 Test 7
B4191.1 25 Time (s) 0 100 200 300 400 500 600 700 800 900 1000 S m oke Op tical Densit y ( OD/ m ) 0.0 0.2 0.4 0.6 0.8 1.0 Test 5 Test 6 Test 7
Figure 14. Smoke optical density Bedroom 1.
Optical Density/m 0.01 0.1 1 10 V isibil it y (m ) 0.1 1.0 10.0 100.0
B4191.1 26 Time (s) 0 100 200 300 400 500 600 700 800 900 1000 Tem pe rat ure (°C) 0 100 200 300 400 500 600 700 800 900 1000 0.4 m 0.9 m 1.4 m 1.9 m 2.4 m Center Room Duct
Figure 16. Temperaturesin fire compartment for Test 2.
Time (s) 0 100 200 300 400 500 600 700 800 900 1000 V elo c it y ( m /s ) -5 -4 -3 -2 -1 0 1 2 3 4 5 Test 2 Test 3 Test 4 Test 5 Test 6 Test 7
B4191.1 27 CO and CO2 Measurements
A gas analyzer was used to measure carbon monoxide (CO) and carbon dioxide (CO2) concentrations in the entryway. The inlet for the gas sampling tube was located at
the 1.5 m height at the same location as the smoke optical density measurement (Figure 3). The CO and CO2 concentrations over the duration of the tests are shown in
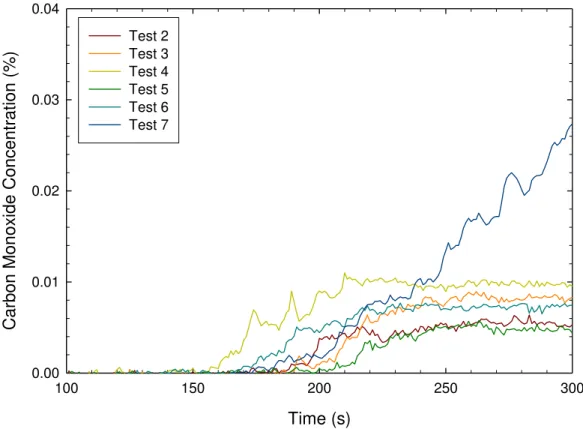
Figures 18 and 19, respectively. The CO concentrations in the 100 - 300 s time interval are shown in Figure 20.
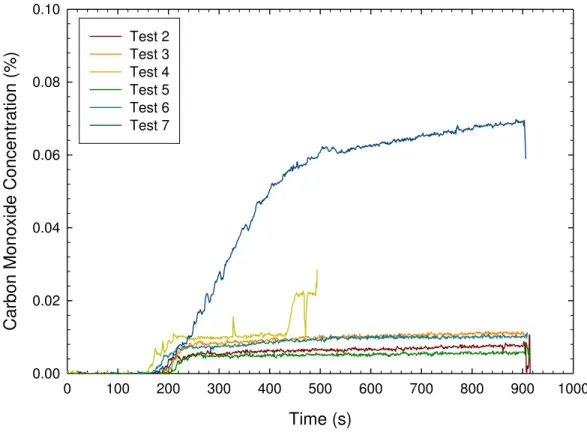
In Tests 2-6, the buildup of CO and CO2 in the entryway followed the same
general pattern. There was limited or no increase in concentrations until approximately 150 s. This was followed by an increase in concentrations until approximately 250 s. Subsequently, there was a plateau phase during which there was minimal increase in concentrations.
For Test 7 with the increased fuel load, the CO and CO2 concentrations
continued to increase until approximately 500 s. Subsequently, there was a plateau phase in which there was a slow increase in concentrations.
The initial time interval during which the predominant increase in gas
concentrations in the entryway occurred corresponds to the time during which the fire was burning in the fire compartment as indicated by the temperature profiles in Figures 7 and 8. These results would suggest that most of the smoke spread into the entryway was due to the pressure difference produced by the fire, which resulted in smoke flow through the gaps around the door between the basement stairs and the fire
compartment. The subsequent slow buildup in smoke was probably due to continued smoke leakage through the gap around the door and circulation of smoke through the supply outlet in the entryway.
Tests 2, 4 and 6 had the earliest increase in gas concentrations in the entryway. These were the tests with the earliest increase in smoke optical density (Figures 12 and 20). In these tests, the furnace fan was operating producing a more rapid fire
development and higher peak temperatures (Figure 8 and Table 3). The results indicate that the operation of the furnace fan will have an effect on fire development for under ventilated fires. As a result, there was an increase in smoke movement through gaps around the doors.
The CO concentrations measured in the entryway during the tests were relatively low even in Test 7 with concentrations of approximately 0.06% (600 ppm) during the steady plateau stage. These concentrations would not be of concern for occupants trying to evacuate through the entryway for the test scenarios. However, the CO concentrations measured in the entryway were considerably lower than the peak concentrations measured in the fire compartment (see Table 6). Also, the fire size and duration was limited by the ventilation conditions for the fire compartment and fuel load. An increase in ventilation for the fire compartment could result in faster accumulations of smoke in the entryway as well as higher gas concentrations, which could be a concern.
B4191.1 28 Time (s) 0 100 200 300 400 500 600 700 800 900 1000 Carbon M on ox id e Conce nt rat io n (%) 0.00 0.02 0.04 0.06 0.08 0.10 Test 2 Test 3 Test 4 Test 5 Test 6 Test 7
Figure 18. Carbon monoxide concentration in entryway.
Time (s) 0 100 200 300 400 500 600 700 800 900 1000 Carbon Diox id e Conce nt rat io n (%) 0.0 0.2 0.4 0.6 0.8 1.0 1.2 1.4 1.6 1.8 2.0 Test 2 Test 3 Test 4 Test 5 Test 6 Test 7
B4191.1 29 Time (s) 100 150 200 250 300 Carbon M on ox id e Conce nt rat io n (%) 0.00 0.01 0.02 0.03 0.04 Test 2 Test 3 Test 4 Test 5 Test 6 Test 7
Figure 20. Carbon monoxide concentration in entryway (100 – 300 s). Sprinkler Activation
A sprinkler system was installed in the basement of the house used for the tests. It was installed for use by the fire department in case the fire got out of control. If
needed, the fire department could have connected to the main sprinkler pipe and supplied water to areas in the basement including the fire compartment. The sprinkler system was not needed for emergency purposes during the test series.
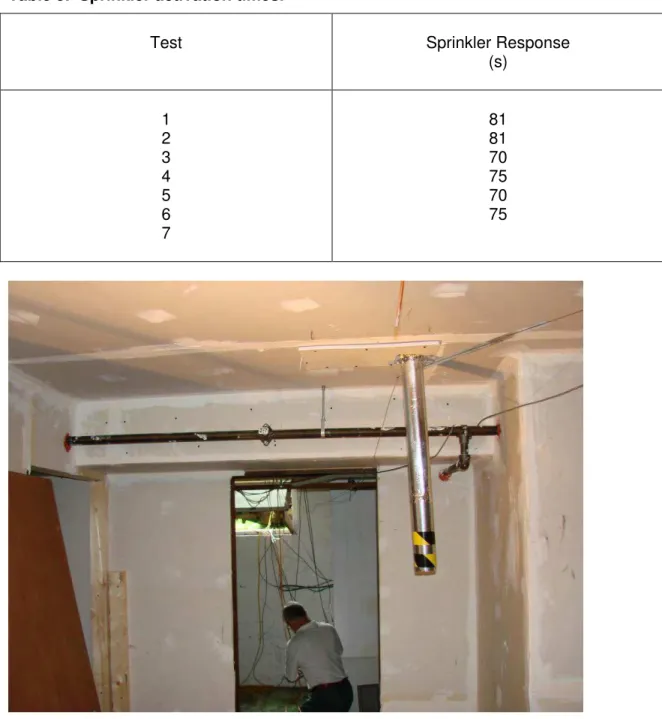
The main sprinkler pipe was installed adjacent to the return air duct located near the North-South centerline of the basement (Figure 21). In the fire compartment, sprinklers were installed on both sides of the exit door (see Figure 4). The centerline of the sprinkler was approximately 220 mm below the ceiling.
The response time of the sprinklers in the fire compartment was monitored. Prior to the test, the sprinkler system was pressurized using an air compressor. The time at which the pressure decreased in the system was used as the activation of the first sprinkler in the fire compartment. The response times are summarized in Table 5.
B4191.1 30 Table 5. Sprinkler activation times.
Test Sprinkler Response
(s) 1 81 2 81 3 70 4 75 5 70 6 75 7
Figure 21. Location of North sprinkler in fire compartment. Gas Measurements in the Fire Compartment
A hand-held gas analyzer typical of those used by fire departments to assess air quality in a structure during fire incidents was used in Tests 2-7. An air sample was taken at the 1 m height near the door to the furnace room (see Figure 4). The sample was drawn through a 6 mm diameter Tygon tube using the internal fan of the device, which was located outside the house with the data acquisition system.
B4191.1 31
The gas analyzer measures the concentrations of selected gases in ppm: O2,
CO, H2S and Cl2. It also measures the lower explosive limit (LEL) as a percent. The
device did not include data output capabilities and could not be connected to the data acquisition system. It did retain in memory the maximum/minimum value during a measurement period. These values were recorded and are summarized in Table 6.
There were limited amounts of H2S and Cl2 measured in the tests (10 ppm or
less). The most likely source for the Cl2 was the smoke alarm and/or the cable that
connected it to the data acquisition system to measure the response time.
The LEL measured in the tests was high particularly in Test 7 in which the LEL approached the explosive limit. The results indicated there were large quantities of unburnt hydrocarbons produced, which is consistent with an under-ventilated fire scenario.
Table 6. Peak measurements with hand-held analyzer.
Test
CO
O2 H2S Cl2LEL
(%)
(%) (ppm) (ppm)(%)
1
NA
NA
NA
NA
NA
2
1.0
5.6
NA
10.2
46
3
1.7
4.0
9
7.0
77
4
2.0
3.8
NA
2.8
74
5
2.0
2.6
10
4.9
74
6
1.6
5.2
9
4.2
70
7
2.5
3.5
11
5.6
98
NA – not availableThe analyzer had recently been calibrated by the fire department. There is no information on how accurate the device is for the high CO and low oxygen levels
measured in the tests. However, the measured concentrations are consistent with those expected in a compartment with an under-ventilated fire. The peak concentrations were used for a tenability analysis to provide an estimate for the incapacitation time for occupants exposed to the extreme conditions.
Past human experiments in an oxygen-depleted atmosphere indicated that most people could tolerate a 15% O
2 atmosphere [17]. Healthy individuals could also tolerate
a 12% O
2 level for a short period (<5 min) [18]. When oxygen diminished to below 10%,
however, unconsciousness could occur rapidly.
The fractional effective dose approach can be used to determine the effect of gases on occupants. The incapacitation dose for oxygen vitiation can be expressed in terms of (20.9 - %O
2) ×tin,O where tin,O is the time for incapacitation due to oxygen
B4191.1 32
exposure dose (20.9 - %O2) × Δt and the incapacitation dose at each discrete increment
of time:
(2) where Δt (minute) is the discrete increment of time.
The fractional effective dose for incapacitation due to CO can be calculated using the approach given in ISO TS 13571 for short exposure to CO at high concentrations [15]:
(3) where the incapacitation dose is 35000 ppm.min, which is consistent with the tenability limits of 6000 to 8000 ppm for incapacitation for a 5-min exposure given in the SFPE Handbook of Fire Protection Engineering [17]. In concentrations > 2%, CO
2 can
stimulate breathing resulting in an increase intake of toxic gases. A CO
2-induced
hyperventilation factor for breathing has been estimated [17] and is included in Equation 3.
The measurements using the hand-held gas analyzer did not provide time dependent estimates for the gas concentrations in the fire compartment. However, the peak results shown in Table 6 can be used to estimate the time to incapacitation for an average adult in the fire room environment at the peak concentrations. Since CO2 was
not measured in the tests, an estimate is required for use in the calculations. With the low oxygen levels and high CO concentrations, the CO2 concentration in the range of 10
to 15% would be expected. For the calculations shown in Table 7, a CO2 concentration
of 10% was used.
For the estimates for the incapacitation time in Table 6, it was assumed that the effects of the oxygen vitiation and the CO were additive. The calculations were for an average healthy adult with the time to incapacitation determined as the time at which the combined fractional effective dosage determined using Equations 2 and 3 reached a value of 1.
The results of the tenability analysis indicate that occupants could be
incapacitated in approximately 10 s or less at the peak concentrations. These results combined with the limited visibility indicate that it would be difficult for occupants to evacuate through the fire area.
The time at which the maximum conditions occurred was not determined. However, assuming that the peak gas concentrations at the 1 m height would
correspond to the time at which the peak temperature was measured at this height, the approximate time was 150 s. These results indicate that an occupant in the secondary suite would have less than 150 s to evacuate through the main exit.
B4191.1 33
The results of the tenability analysis combined with the smoke optical density analysis support the need for the secondary exit as required in the Alberta code. Table 7. Estimated time for incapacitation.
Test
CO
O2 CO2 Time Incapacitation(%)
(%) (%) (s)2
1.0
5.6
10
18.5
3
1.7
4.0
10
9.5
4
2.0
3.8
10
8.3
5
2.0
2.6
10
6.0
6
1.6
5.2
10
12.5
7
2.5
3.5
10
6.8
Smoke Flow through Return Air Inlet
In Tests 4 and 5, the temperature was measured at the return air inlet in the corridor on the main floor (Figure 3). For Test 4, the thermocouple may have been covered with No Burn, which was sprayed into the joist space and on the carpets on the main floor to limit the potential for fire spread through the open plenum. As a result, the temperatures were very high (>1000 C) even though there was no indication of burning in the area when the firefighters investigated.
Figure 22 shows the temperature measured in Test 5. The peak temperature of the smoke flow into the upper floor was approximately 280 C. This is lower than the peak temperatures >400 C measured near the ceiling in this test (Table 3) indicating that there was cooling of the smoke.
The temperatures are high enough that they could ignite combustible materials on the main floor. Although not confirmed by observation, the temperature spikes that occur between 200 and 300 s may be due to limited burning of materials on the main floor.
These results do illustrate the potential for fire spread through a return air system with a direct link between a return air inlet in a secondary suite and one on the main floor. Regulations may be required to limit this scenario.
The other concern with the return air inlet in the ceiling of the fire compartment was the potential for smoke flow into the main floor of the house. The return air inlet was 150 mm by 350 mm. It connected to a 280 mm high by 350 mm wide duct in the joist space, which was connected to the main return air duct. Directly above the return air inlet was a 150 mm by 350 mm hole in the subfloor that connected the return air system to the return inlets in Bedroom 1 and at the mid-length of the corridor (Figure 3). With
B4191.1 34
this arrangement, smoke flow could flow directly from the fire compartment through the openings directly above as well as through the main return air system to the other return inlets on main floor.
Based on the dimensions of the return air system in the immediate area of the return inlet, the equivalent opening between the fire compartment and the main floor was approximately 221 mm by 221 mm. The estimated smoke flow rate through this size of opening is given in Table 8.
The results indicate that at 15 Pa the smoke flow through the return air system directly to the main floor would be equivalent to that produced by the furnace fan. Higher smoke flow rates would be expected with higher pressures.
The smoke flow through the return air system is of particular concern as it directly connects to the bedrooms and the main exit route (Figure 3). This smoke flow resulted in high smoke optical density measurements in the corridor (Figure 13).
The results in this section indicate that there should be no interconnection of return air inlets in the basement ceiling with those on the main floor. The concerns are the potential for both fire and smoke spread through the return air system to the main floor. Time (s) 0 100 200 300 400 500 600 700 800 900 1000 Tem pe rat ure (°C) 0 100 200 300 400 500 Test 5
B4191.1 35 Table 8. Smoke through return air system.
Pressure Flow Rate
(Pa) (m3/s) 15 0.175 30 0.256 45 0.319 60 0.374 75 0.423 90 0.468
Fire Compartment Door
The temperatures at the top of the door on the fire compartment were measured in Tests 6 and 7. The results are shown in Figure 23.
In Test 6, a peak temperature of approximately 350 C was measured. With the limited fuel load used in this test, the temperature duration was limited and there was minimal damage to the door.
With the additional fuel load provided by the wood crib in Test 7, the temperature on the door remained above 350 C for an extended time. The door did not ignite. This may be due to the limited oxygen in the fire compartment (Table 6).
There was some damage to the door during Test 7. The fire did penetrate through the inner layer of the door (Figure 23). However, the outer layer was still intact.
In a test conducted by Underwriter’s Laboratories of Canada for the Ontario Fire Marshal [19] with a hollow core door using a standard furnace in accordance with CAN/ULC S104 [20], the unexposed side was discolored at 170 s. At 180 s, the door was completely engulfed in flames.
The test results indicate that for the under ventilated conditions in the test a hollow core door provided protection. However, the oxygen concentration in the fire compartment was well below the levels needed for combustion. Based on the tests using the standard furnace, a hollow core would provide limited protection for a well-ventilated fire scenario.
The tests conducted in this project only considered the entry door for the basement suite. However, the door to the main dwelling unit would also be of concern as early breeching of this door by a fire on the main floor could allow the entryway to be filled with smoke.
B4191.1 36 Time (s) 0 100 200 300 400 500 600 700 800 900 1000 Tem pe rat ure (°C) 0 100 200 300 400 500 Test 6 Test 7
Figure 23. Temperatures on fire compartment door.