Cost Benefit Analysis of Process Change Implementation: Alternate Wet Cleaning Technology in the
Semiconductor Manufacturing Industry By
Raj A. Vazirani
Submitted to the Department of Materials Science and Engineering in Partial Fulfillment of the Requirements for the
Degree of Bachelor of Science
At the
Massachusetts Institute of Technology June 2001
Copyright @ 2001 Raj A. Vazirani All Rights Reserved
The author hereby grants to MIT permission to reproduce publicly paper and electronic copies of this thesis document
Signature of Author...
C ertified by...
SI
A ccepted by...
The author hereby grants to MIT permission to reproduce and to distribute publicly paper and crectronic copies of thNs thesi3 document in
MASSACHUSETTS INSTITUTE OF TECHNOLOGY
JUL 10
2017
LIBRARIES
ARCHIVES
and to distribute in whole or in part.Signature redacted
Departinmi of Nfaterials Science and EngineeringMay 2001
ignature redacted
()
/
Joel P. Clark Professor of Materials Systems Thesis Supervisor r-%
ignature redacted
...
Ron Latanision Professor of Materials Science and Engineering Chairman, Undergraduate Thesis CommitteeCost Benefit Analysis of Process Change Implementation: Alternate Wet Cleaning Technology in the
Semiconductor Manufacturing Industry by
Raj A. Vazirani
Submitted to the Department of Materials Science and Engineering in partial fulfillment of the requirements for the Degree of Bachelor of Science, June 2001
ABSTRACT
Maintaining wafer surfaces free of contamination is an essential requirement for the successful fabrication of semiconductor devices. With the growing trend of increased device complexity and reduction of device feature sizes, the area of wet cleaning of
substrate surfaces has gained importance. The existence of organic and metallic contaminant particles and thin films on a wafer surface can drastically reduce line yield. Recent improvements in wet cleaning technology have presented alternate wafer cleaning techniques. The J.T. Baker clean process is a two step replacement for the four step RCA clean which is the current industry standard. The J.T. Baker clean process involves a significant reduction in chemical costs, process time, volume of disposed effluent, and parts usage. Furthermore, the J.T. Baker clean process eliminates the use of environmentally hazardous chemicals such as hydrochloric acid and ammonium hydroxide. However, process change in high volume semiconductor manufacturing facilities presents high levels of risk. A cost benefit model can be used to clearly outline the potential cost benefits and risks associated with implementing a process change in the semiconductor manufacturing facility. Only after understanding the risks involved and having a clear sense of the potential for financial gain can an informed decision on process change be made. This study used the Intel Fab 12 fabrication facility in Chandler, Arizona as a case study to model cost benefits and risk factors associated with implementing the J.T. Baker clean process. It was found that an expected value of cost savings of $285,000 per year could be achieved by replacing the RCA clean method with the J.T. Baker clean process.
Thesis Supervisor: Joel P. Clark Title: Professor of Materials Systems
Table of Contents
A B S T R A C T ...---... 2
C hapter 1: Problem O verview ... 5
1.1 Introdu ction ...-... 5
1.2 B ackground ... .... ...---...-- - - - - 7
Chapter 2: M ethodology... ... ---... 14
2.1 C hem ical C osts... ...---... 14
2.2 Production Levels... ... ... 15
2.3 Other Considerations... 15
2.4 Total Cost Benefit and Risk Measure Methodology... 16
2.4.1 Risk Inherent To An Impact On Line Yield... 16
Chapter 3: Analysis And Discussion... 19
3.1 Chemical Cost Analysis ... 19
3.2 Process Im plications... ... 23
3 .3 R isk F actors... ... 24
Chapter 4: Conclusions And Recommendations...26
4.1 Importance of Wet Cleaning Technology ... 26
4.2 Expected V alue of Cost Benefits ... 26
4.3 C ontext of C ost B enefits ... 27
4.4 Sum m ary ... ---... 28
C hapter 5: R eferences ... ... ---... 29
C hapter 6: A ppendix ... .... ---... 30
List of Tables and Figures
Figure 1. Process Comparison Schematic Flow Chart... 10
Figure 2. Megasonic Immersion Bath Equipment Configuration... 11
Figure 3. Chemical Prices of RCA Components, 1996-2000 ... 19
Table 1: Chem ical Prices M arch 2001 ... 14
Table 2: Chem ical Costs for RCA Clean ... 21
Chapter 1: Problem Overview
1.1 Introduction
Process change in semiconductor manufacturing environments can introduce many sources of risk, especially when the change affects multiple points in the production line. There is a need to completely understand all the potential cost benefits, risks associated with change, and costs to implement and qualify new process techniques. Semiconductor fabrication facilities typically run at very high production levels, ideally near capacity at all times; therefore any variance in product specification and resultant decrease in yield could severely impact revenue through the creation of bottlenecks and lost product. A cost benefit model can aid in making process change decisions by clearly outlining the financial benefits and risks involved.
Significant cost savings may be achieved in the manufacturing of integrated circuits with respect to improvements in wet cleaning wafer technology. The current industry standard for wafer wet cleaning is the RCA clean, named for the inventors at RCA Laboratories in 1970. This process step is used to remove all surface contamination and trace impurities on a silicon wafer surface multiple times in the manufacturing process. The RCA clean has proven to be very effective in maximizing yield by creating a uniform ultra clean substrate surface when implemented with high purity chemicals. However, it is a lengthy four step process that uses large volumes of deionized water, ammonium hydroxide and hydrochloric acid. All of these chemicals need to be neutralized prior to disposal.
J.T. Baker Associates have developed a proprietary chemical solution, which is used in the Baker clean method as a replacement for the standard RCA clean'. The J.T. Baker clean process involves a significant reduction in the volume of chemicals used as well as a decrease in
process time. The cleaning process consists of an alkaline solution containing tetra-alkyl-ammonium hydroxide followed by a single rinse of deionized water. The Baker clean offers a more environmentally friendly process, where chemical waste does not need to be neutralized prior to disposal, introducing another cost saving parameter. Decreased cycle times would result in lower and more efficient labor spending as well as reduced parts usage. The Baker clean process could be qualified by test production to insure that contaminant particle levels and surface roughness are achieved in an equal or better fashion than the RCA clean.
All of the chemicals used in the RCA clean are standard commodity items that are available from a wide range of industrial chemical vendors. Hydrogen peroxide, aluminum hydroxide, hydrochloric acid and deionized water are all used in a wide range of industrial applications. Consequently, chemical price fluctuations are not specific to current trends in the semiconductor industry. The Baker clean process, however, involves use of the company's proprietary chemical solution, and thus process costs are dependent on the single vendor.
Understanding all the sources of potential cost savings as well as costs derived from change implementation and risk factors is critical to making a decision on whether to utilize alternate wafer cleaning technologies. The RCA clean is a crucial process step, being performed at least five times during fabrication of semiconductor wafers. The success of many other semiconductor manufacturing steps such as diffusion, tunnel oxide growth and chemical vapor deposition completely rely on the existence of an ultra clean substrate surface2. In addition,
many semiconductor manufacturers adopt a policy of complete horizontal process uniformity across all production facilities worldwide. Therefore, any proposed process change and resultant improvement or decrease in profitability would be potentially impacted on a very large scale.
There are no equipment costs associated with changing from the RCA clean to the Baker clean process. The Baker clean chemical solution would be used in the same megasonic immersion bath equipment and operators would need little if any additional training to accommodate the new process. However, there is a tremendous amount of exposure to other process steps that rely on the integrity of the cleaning process. Therefore, the cost savings must prove to be extremely significant in order to justify the risk exposure of process change.
1.2 Background
A crucial part of semiconductor fabrication is creating and maintaining ultra clean substrate surfaces throughout the manufacturing process. Contamination is responsible for over
50% of yield losses in integrated circuit fabrication3. As the process logistics of device fabrication become increasingly complex, wafer cleaning is being held to higher standards, demanding both higher chemical purity of cleaning solutions and lower trace impurity levels on the wafer substrate. A huge number of transistors on a wafer must behave exactly as they are designed, requiring a tight control in manufacturing. There is little tolerance for product variation within a large production volume that includes dozens of discrete process steps. Perfect uniformity and reproducibility must be guaranteed for deep submicron wafer manufacturing lines.
Trace impurities, such as sodium ions, metals and particles are especially detrimental if present on semiconductor surfaces during high temperature processing steps. All impurities must be removed before process steps such as thermal oxidation, diffusion and epitaxial growth. Failure to remove impurities will result in particulate diffusion into the silicon substrate, altering electrical properties and interfering with device physics. Impurities must also be removed from
surfaces before and after low temperature steps such as chemical vapor deposition, dopant implanting, and plasma reactions. Wafer surface cleaning is necessary after photoresist stripping for every mask level through the production process.
There are various forms of contamination that need to be addressed in the wafer cleaning process. In order to achieve an ultra clean wafer surface, the wafer must be free of:
i) Particle contamination ii) Organic contamination iii) Metallic contamination iv) Native silicon oxide
v) Variance in surface micro-roughness vi) Contaminant films
vii) Absorbed gases
When a silicon substrate surface is exposed to air in a clean room, moisture comprising several tens of molecular layers is adsorbed within a second4. Oxygen dissolves into adsorbed moisture layers from the air, resulting in a native oxide layer. Furthermore, both organic and metallic contaminants are introduced in large quantities from wafer handling, previous process steps and the environment.
The current industry standard for the cleaning of silicon wafers during fabrication, the RCA clean, uses a four step wet chemical treatment based on hydrogen peroxide chemistry. Through the years the process has been tweaked through variation of chemical concentrations and treatment times in order to optimize desired surface characteristics. The RCA clean consists of an alkaline mixture at high pH followed by an acidic mixture at low pH. In order to remove metallic and organic contaminants from the silicon surface, it is necessary to use a solution having a high redox potential. This type of solution captures electrons from metallic and organic contaminants to oxidize them. In this process, metals are ionized to be dissolved into the
solution while organic impurities are composed. The choice of chemicals was based on reaction
5
chemistry, oxidation potentials, reagent purity, reagent volatility, safety and economic factors . The first treatment step, called Standard Clean 1 or SC-1, consists of a hot mixture of water-diluted hydrogen peroxide and ammonium hydroxide. This is designed to remove organic surface films by oxidative breakdown and dissolution. In this cleaning solution, the chemical oxide layer on a wafer, which is formed by H202 oxidation, is etched by NH40H. Particles on a
wafer are lifted off and separated from the wafer surface. The separated particles cannot re-adhere onto the surface due to the electrical repulsion between particles and the wafer surface; the particles and silicon substrate are charged the same polarity (negative) in alkaline solution. Typically, the SC-1 step is performed in the ratio of 5:1:1 (H20/H202/NH40H) at a temperature
range of 85-90 0 C. In the second step of the RCA clean, ultra-filtered deionized water is used to
rinse wafers.
The third step, called Standard Clean 2 or SC-2, exposes the rinsed wafer to a hot mixture of water-diluted hydrogen peroxide and hydrochloric acid. This removes alkali ions and cations that form NH40H- insoluble hydroxides in basic solutions. The SC-2 step is performed in the
ratio of 6:1:1 (H20/H202/HCl) at a temperature range of 85-90 0 C. Higher temperatures must be
avoided to minimize excessive thermal decomposition of the hydrogen peroxide.
Finally, the fourth process step in the RCA clean consists of another deionized water rinse. The chemicals used must be of the highest purity (electronic grade NH40H and HCl and
unstabalized H202), as even the slightest chemical impurities can lead to drastically lower yield results. Figure 1 shows a schematic diagram of both the RCA and J.T. Baker clean processes.
RCA Process Contaminated Wafer Step 1 SC - 1 NH4: H202: H20 1:5:1 Time Required: 10 minutes
4
Step 2 Rinse H20 Time Required: 5 minutes I Step 3 SC -2 NH4 : H202: H20 1:6:1 Time Required: 10 minutes Step 4 Rinse H20 Time Required: 5 minutesI7
J.T. Baker Process Contaminated Wafer4
Step 1 JTB -100: H202: H20 5:1:25 Time Required: 10 minutes Step 2 Rinse H20 Time Required: 5 minutes Processed Wafer Processed WaferThe original RCA cleaning process was utilized with a simple immersion bath technique. In order to achieve advanced results, several alternative application designs were developed. The most successful complement to the RCA process was the inclusion of a megasonic particle removal system. Through ultrahigh frequency sonic energy, the front and backside surfaces of the wafers are cleaned with a non-contact scrubbing action while the wafers are submerged in cleaning solution. An array of piezoelectric transducers creates sonic waves of 850 - 950 kHz6. This technique is effective in removing particles ranging in size from several micrometers to 0.25 micrometers using input power densities of 5 -10 W/cm 2. A megasonic bath will
simultaneously remove contaminant films and particles when used in conjunction with the SC-I and SC-2 solutions. Figure 2 shows a typical megasonic configuration.
Oscillating Carrier Arm
Wafer Carriers 000 00 0~ 04 0 0 0 0 0 0 00 000 Meg Chemical Feed Line
+ Wafers
Chemical Surface
~ hmlcal Tank
asonlcs Transducers
The RCA clean method has been very successful in removing surface particles, organic and metallic contaminants. Furthermore, surface roughness has been minimized while maintaining cleaning effectiveness by optimizing process times and chemical concentrations. However, RCA cleaning requires a large number a processing steps and consumes huge quantities of liquid chemicals and ultra-pure deionized water. In addition, huge volumes of clean air are exhausted in order to prevent chemical vapors from entering the clean room.
During the fabrication process of semiconductor wafers, the RCA clean is performed at least five times. Many process steps rely on total wafer uniformity in order to successfully complete the task of the individual process action. For this reason, it is absolutely essential that cleaning be optimized and performed with complete predictability, as even a slight variance in wafer integrity can have a gross impact on yield results.
The J.T. Baker clean process involves a two step process that utilizes a proprietary alkaline solution followed by a deionized water rinse. The solution, JTB-100, contains a tetraalkylammonium hydroxide that will remove both organic and metallic contaminants in a single step. Wafers are immersed in the same megasonic bath equipment containing a 1:5:25 ratio of hydrogen peroxide, JTB-100 and deionized water. The solution was designed to promote oxidation of metallic impurities, dissolution of other contaminants, and at the same time prevent redeposition. Cleaning efficiency has been verified and documented by the product vendor and was shown to reduce surface roughness and lower particulate contamination.7. The Baker clean solution does not degrade as quickly as the SC-1 and SC-2 solutions, and thus can be used up to three times as long without adversely effecting cleaning results. Furthermore, the Baker clean runs on the identical megasonic immersion bath equipment and thus does not require any additional parts spending. Although the chemical solution is proprietary, a Material Safety Data
Sheet (MSDS) is available to fully understand any potential chemical interactions and safety issues (see Appendix).
All of the chemicals used in the RCA clean are standard commodity items that are available from multiple chemical vendors. Prices are dependent on current market supply and demand issues, however the price fluctuations of hydrogen peroxide, aluminum hydroxide and hydrochloric acid, which are all used in a wide range of industrial applications, are not specific to the economies of the semiconductor industry.
Chapter 2: Methodology
2.1 Chemical Costs
A survey of chemical distributors was conducted in order to establish current prices of highest grade hydrogen peroxide, aluminum hydroxide and hydrochloric acid. Table 1 shows market prices as of April 2001 from several large industrial chemical suppliers. All prices were quoted for the largest bulk discount available, assuming that a semiconductor manufacturer would take advantage of the highest economies of scale.
Table 1: Chemical Prices April 2001
CHEMICAL SUPPLIER PRICE($/SHORT TON,
DELIVERED) Hydrogen Peroxide Doe & Ingalls of NC, Inc. 30
(Electronic Grade, Unstabilized) General Chemical Corp 29.3
Koch Microelectronic Service Company, Inc. 28.1
Hydrochloric Acid Koch Microelectronic Service Company, Inc. 76.0
(Electronic Grade) Sigma Aldrich 72.3
General Chemical Corp. 70.9
Ammonium Hydroxide Koch Microelectronic Service Company, Inc. 28.9
(Electronic Grade) General Chemical Corp 30.8
Spectrum Chemical 32.8
Deionized Water Sigma Aldrich 0.23
Spectrum Chemicals 0.25
Sources: ChemExpo Corporation, CMAI, Lehman Brothers
For the Baker clean comparison, the proprietary solution must be purchased directly from the vendor, J.T. Baker. Price information was obtained including possibility of long term contracts
A historical study of chemical prices was also conducted to obtain a measure of volatility of hydrogen peroxide, aluminum hydroxide and hydrochloric acid prices. A five year time frame was chosen as a sufficient measure of historical price action. In addition, research was conducted to determine the factors that influence chemical commodity prices.
2.2 Production Levels
Data was collected from semiconductor manufacturing company Intel Corporation in order to gain a sense of scale of production. Data was collected regarding the volume of wafers processed in the Intel Fab 12 wafer production facility in Chandler, Arizona. Weekly production numbers were averaged over a period of one year and used as a representation of a large scale manufacturing facility. In addition, it is assumed that the facility utilization is a variable that fluctuates with current demand and back supply issues of the market place.
2.3 Other Considerations
Chemical disposal costs were obtained from J.T. Baker Inc. based on a national average assuming the largest economy of scale. A one week supply of chemicals is assumed to be stored on the fabrication site for the purpose of inventory cost. In addition, parts usage was estimated based on the average utilization of the equipment for each clean process. It is assumed that the megasonic immersion bath equipment used by both clean processes has a product life of five years. After the five year period, equipment replacement is recommended to avoid the negative effect of equipment failure. Square footage of chemical storage space was estimated by volume for a measure of on site chemical storage cost. The cost of change implementation was calculated assuming that 120 man hours of engineering resources and one full day of wafer
production would need to be devoted to qualify, test, and implement policy change specific to the new wafer cleaning technique.
2.4 Total Cost Benefit and Risk Measure Methodology
All of the above stated sources of costs savings were modeled numerically and integrated into the overall cost model. The cost of qualification and cost of implementation of a process change plan was calculated and subtracted from total cost benefits. Finally, two main sources of risk were identified 1) potential impact on line yield of process change 2) risk of use of single supplier proprietary chemical. These risks were modeled in order to give a measure of probability of occurrence and financial impact. From this model, an expected value of total cost benefit was derived.
2.4.1 Risk Inherent To An Impact On Line Yield
To determine the risk exposure of a change in line yield, two population means were compared. Let us assume that a population of one day's production is studied. The population of 10,000 wafers cleaned by the RCA process is said to have a population mean of M rca, where
M rca represents the mean number of wafers that were successfully cleaned by the RCA process.
M jtb represents the mean number of wafers successfully cleaned by the J.T. Baker clean process. Using the sample size of 10,000 wafers, Grca and Gjtb represent the standard deviations of the RCA and J.T. Baker cleaned distributions, respectively. Equations 2 and 3 give us to a 99.99% confidence level the expected number of wafers passing line yield requirement for a given day:
Yielded wafers in RCA process =M ra - 4Carca (2)
Yielded wafers is J.T. Baker Clean process = M tb - 4yjtb (3)
Depending on the level of confidence desired, we adjust the number of standard deviations subtracted from the mean. For example, if we know that M rca = 9900 with a a(rca) = 25 wafers and M jtb = 9925 with Cyjtb)= 20 wafers, equation 4 will calculate the expected cost benefit of the
J.T. Baker process over the course of one day:
Expected Benefit of One Day= {(Mjtb- 4ajtb) -(M rca -4 rca)}*C (4)
= {(9925 - 4*20) -(9900 - 4*25)}*C
= (9845-9800)*C
= 45*C
where C is the cost of losing one wafer in production. Given the standard deviation of one day's production, a, the standard deviation of over any given time , t, is equal to Y . Equation 5 is used to extrapolate the exposure of the course of one year:
Yearly Exposure = [365 * (jtb-4jtb 35) - 365 * (Mjtb-4CYrca 365)] * C (5)
where M jtb, Gjtb, M rca, Grca again represent the population means and standard deviations of a
single days production, 10,000 wafers, using the J.T. Baker and RCA clean processes, respectively. Using this model, we can predict the financial impact over the course of one year of
one cleaning process performing better than another, and thus model the risk exposure of a process change.
Chapter 3: Analysis And Discussion
3.1 Chemical Cost Analysis
Chemical costs and details of process logistics were compiled for the traditional RCA Clean as implemented at Intel Corporation Fab 12 in Chandler, AZ. This is assumed to be representative of standard industry practice. Historical data of chemical prices was researched in an attempt to understand the stability of the commodity chemical prices. Figure 3 shows five year price history of hydrochloric acid, hydrogen peroxide and ammonium hydroxide.
Industrial Chemical Prices 1996-2000
100 NH40H,
Bectronic Grade
90 - - -- 0 H202, Unstabilized
CF [
_HCI, Bectronic Grade
0 70_ t 60 - - /_ CO 50 _/ _/ 40-o 30Fiur 3P / U) M _ 10 o 0) C C C C C (D C a) a ) CU :3 CU U M cc C C
Figure 3. Chemical Prices of RCA Components, 1996-2000 Source: CMAI Chemical Journal
All the chemicals involved are used in such a broad range of industrial applications that price volatility tends to be non-systematic to the semiconductor industry. Instead, it was found 8 that industrial chemical prices tend to correlate to energy prices such as natural gas . Commodity futures contracts, which guarantee delivery of chemical goods at a fixed price at a future date are readily available for the chemicals involved, adding a method of risk reduction in processing costs. It can be seen that all the chemicals used have a significant degree of price volatility during the five year span. For the purpose of cost modeling, a five-year moving average calculation was performed in order to best represent the chemical cost components inherent to each cleaning process technique.
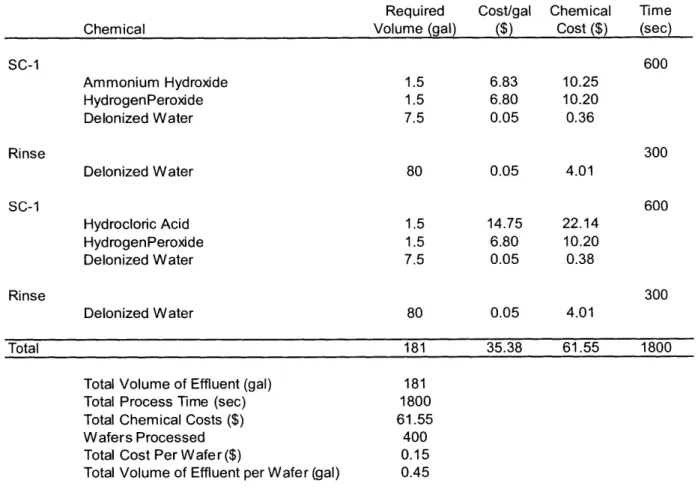
Wafers are processed in a megasonic bath with a capacity of 400 wafers per bath. Table 2 shows the costs associated with the RCA Clean. Table 3 shows the chemical costs of the Baker clean, run on the identical megasonic bath equipment. It can be seen that the Baker clean process would reduce the chemical cost per wafer from $0.15380 per wafer to $0.10796 per wafer, a 29.8 % reduction in chemical costs. Additionally, the volume of effluent per wafer decreases from 0.4525 gallons to 0.2275 gallons, a 50% reduction.
The Baker clean process effluent is compatible with most city drain standards, and thus does not need to be neutralized prior to disposal . This eliminates the chemical disposal cost of $0.01 per gallon that is applicable to the RCA process. This translates to a savings of $0.0045 per wafer processed.
Table 2: Chemical Costs for RCA Clean
Traditional RCA Clean
Required Volume (gal) Chemical
Cost/gal Chemical Time
($) Cost ($) (sec) Ammonium Hydroxide HydrogenPeroxide Delonized Water Delonized Water Hydrocloric Acid Hydrogen Peroxide Delonized Water Rinse Delonized Water Total 1.5 1.5 7.5 80 1.5 1.5 7.5 80 181 6.83 6.80 0.05 0.05 14.75 6.80 0.05 0.05 10.25 10.20 0.36 4.01 22.14 10.20 0.38 300 4.01 35.38 61.55
Total Volume of Effluent (gal) Total Process Time (sec) Total Chemical Costs ($)
Wafers Processed Total Cost Per Wafer($)
Total Volume of Effluent per Wafer (gal)
SC-1 Rinse SC-1 600 300 600 1800 181 1800 61.55 400 0.15 0.45
Table 3: Chemical Costs for J.T. Baker Clean
J.T. Baker Clean
Required Cost/gal Chemical Time
Chemical Volume (gal) ($) Cost ($) (sec)
Step 1 600 JTB - 100 Proprietary Solution 1.76 20.31 35.75 Hydrogen Peroxide 0.44 6.80 2.99 Delonized Water 8.80 0.05 0.44 Rinse 300 Delonized Water 80 0.05 4.01 Total 91 27.21 43.19 900
Total Volume of Effluent (gal) Total Process Time (sec)
Total Chemical Costs ($)
Wafers Processed Total Cost Per Wafer ($)
Total Volume of Effluent per Wafer (gal)
91 900 43.19 400 0.11 0.23
3.2 Process Implications
It is important to note that the J.T. Baker clean process involves less wafer handling and transportation. Wafer handling can be a significant source of contamination, thus it is reasonable to conclude that the reduced handling of wafers would translate to an improvement in process yield. Moreover, the process time is reduced from 30 minutes to 15 minutes. This reduction doubles the theoretical through put capacity of the wet bench stations, an important consideration in preventing and dealing with manufacturing bottleneck issues within the facility. In addition, this reduces the technician resources that need to be devoted to wet station operation. A total of 2 technicians would be needed to operate a four wet bench set up, as opposed to the 4 technicians that are currently used. It is assumed that the man-hour savings will be reinvested to improve overall plant efficiency. In this sense, 16 man-hours of labor per day are freed with implementation of the J.T. Baker clean process.
Parts usage is also an important consideration. With a decrease in process time, the chemical pump system will receive less use and can be assumed to achieve a longer lifetime. However, it was found that wet bench systems are routinely replaced every 2-4 years, well before their life expectancy in order to eliminate the possibility of in line failure. Therefore, the reliability of the wet bench equipment can be expected to improve, however this will not translate to any dollar cost savings with respect to capital equipment spending. However, a 50% decrease in process time results in a 50% decrease in energy costs.
3.3 Risk Factors
The J.T. Baker process relies on the use of the proprietary chemical solution JTB-100, which is only available from a single vendor. This exposes the semiconductor manufacturer to a degree of risk in dealing with future price movements of the chemical solution. J.T. Baker, Inc. was contacted and it was found that the company will sell its product with 2 year fixed price contracts. However, after two years the price of the chemical solution may increase, reducing the cost advantage. In addition, there is always the possibility that the single chemical vendor may no longer be in operation, leaving the buyer exposed to the cost of having to change back to the RCA process. In this case, the transition cost would be minimal, as there is no capital outlay required in association with equipment costs. The cost of change would arise from the cost of internal policy change and retraining technicians on RCA clean procedure. If J.T. Baker, Inc. was a public company, the calculation of risk would be more reliable, as published financial statements would allow analysis of the financial well being of the company.
During the course of one year, J.T. Baker would receive proceeds of sales in connection with the JTB-100 solution of $326,000 from a single customer. It is assumed that a single customer is not sufficient to keep J.T. Baker in a state of financial well being. Therefore, for the purpose of this study a five percent probability is assigned to the possibility that J.T. Baker will have supply problems and discontinue distribution of its solution to the semiconductor manufacturing facility. It is assumed that if J.T. Baker does default, there is an equal probability that it will occur at any point in time, that is to say that there is no time bias as to when it would happen. We will also assume that the process change will impact a time period of 5 years. After the five year period, the facility may no longer be in operation or an alternative cleaning technology may be in place. Given this assumption, a time value of money calculation is
performed to model the financial impact of experiencing cost savings for a period of t years, but then having to revert back to the RCA process due to supplier failure and incur a charge R at time t associated with changing back to the old RCA process. Equation 6 gives the cost impact of the described scenario:
I
{Ct
- (P(d)R)Financial Impact
(I
+ n), (6)where C is the yearly cost benefit of the J.T. Baker clean process, R is the cost of changing back to the RCA process, t is the time in years when the change occurs, P(d) is the probability of supplier default and n is the current interest rate.
Another source of risk is that of decreased line yield connected with the process change. It has been shown how the wafer cleaning process step is a critical one that can greatly impact device properties and final line yield. Before any process change is implemented, it is always necessary to do a rigorous process qualification study to ensure equal or better resultant performance. This study must be conducted on a large scale, in order to achieve a superior confidence level in the data collected. Using the risk measure methodology outlined in section 2.4.1, the "worst case scenario" was modeled to a confidence level of 99.99%.
After accounting for all sources of cost benefit and assessing the financial impact of the risk factors studied, it was found that the J.T. Baker clean change implementation would result in an expected value of cost savings of $285,000 per year of operation. It is therefore shown that the risk factors present are outweighed by the cost benefits inherent to implementing the process change.
Chapter 4: Conclusions And Recommendations
4.1 Importance of Wet Cleaning Technology
The semiconductor manufacturing industry has relied on the RCA clean process for nearly thirty years. It has proven to be a reliable process to minimize wafer contamination and product defect rates. However, recent wet cleaning technology developments have introduced other options with more desirable process parameters and costs. In deciding when to implement change in complex manufacturing facilities, it is essential to understand all possible cost benefits and risks associated with yield and business impact.
Wafer cleaning is an essential part of the manufacturing of semiconductor devices. During the course of fabrication, the RCA clean is utilized an average of five times on each wafer to insure that the wafer surface is free of organic and metallic contaminants as well as thin films and native silicon oxide growth. Even under the strictest clean room requirements environmental debris, wafer handling and transportation all contribute to various forms of silicon contamination. In addition, process steps such as chemical etching and photolithography masking leave large concentrations of trace impurities that must be removed in order to achieve final device functionality. There exists a direct correlation between the quality of surface cleaning and the reliability of integrated circuit device properties .
4.2 Expected Value of Cost Benefits
The J.T. Baker clean process was shown to reduce chemical costs by 29.8%. It reduces volume of chemical effluents by 50% and eliminates chemical disposal costs of 0.0045 cents per
wafer processed. Furthermore, it reduces cycle times by 50% which results in drastically lower energy costs, parts usage, chemical storage and inventory costs as well as more efficient use of labor. The J.T. Baker clean process frees floor space in the fabrication facility and increases capacity and through put potential.
There are other value added characteristics of the J.T. Baker clean process that were not quantified and modeled. For example, the RCA clean produces fume exhaust that must be contained and eliminated from the clean room. The fume exhaust contains potential wafer contaminants which could adversely effect yield if improperly handled. The J.T. Baker clean process involves less wafer handling than the RCA clean process, which is also a potential point of contamination. Finally, the J.T. Baker clean process is more environmentally friendly. Elimination of harsh chemicals such as hydrochloric acid has a positive effect on the environment, however this consideration was not quantified.
The expected value of cost savings for a semiconductor manufacturing facility processing 10,000 wafers a day would be $285,000 a year. This calculation takes into account major sources of risk including negative impact on line yield from inferior wafer cleaning and price risk of chemicals from both the RCA and J.T. Baker clean processes. Therefore, it can be expected that a manufacturing facility that changes from the RCA clean process to the J.T. Baker clean process would save approximately $780 a day or 7.8 cents per wafer processed.
4.3 Context of Cost Benefits
The cost benefit of manufacturing process change can be looked at in a context of impact on bottom line of the company. A company such as Intel Corp. had operating expenses in excess of 23 billion dollars in 2000 (source: Reuters). Even assuming this change is implemented in
every facility worldwide, it would only reduce total operating expenses by 0.02%. In this context, it may not be prudent by opportunity cost analysis to devote engineering resources and qualification time to implement a change with operating expense reduction potential of only 0.02%. Depending on the circumstances of the company, there may be larger issues with more risk impact that need to be addressed before time is devoted to reducing manufacturing costs. In this sense, opportunity cost of studying other process changes may be a significant barrier to implementation of the RCA clean replacement.
4.4 Summary
It is believed that the J.T. Baker clean change implementation is attractive due to the mitigated risks associated with change. The process change requires no capital equipment spending and transition costs where shown to be minimal. Furthermore, in the event that the J.T. Baker clean process proves to be a failure, the costs to revert back to RCA clean production are also very low relative to the potential cost benefit. By studying the financial structure of J.T. Baker, Inc., it is possible to assess a probability of supplier failure and therefore an expected value on the overall cost benefit. Similarly, by studying wafer cleaning data from both processes, the line yield exposure was quantified and translated to an expected value calculation of benefit. Considering both these sources of risk, a positive cost benefit of $285,000 per year based on a 10,000 wafer per day facility can be expected. Cost benefit models can be an extremely valuable tool in understanding sources of cost benefit and areas that are exposed to risk. Only after analyzing potential risks and rewards can an informed decision on implementing alternate wet cleaning technologies be reached.
Chapter
5:
References
1. Cady, W., Varadarajan, M., "RCA Clean Replacement", pg.1, J.T. Baker Microelectronics
Journal, 1999.
2. D.C. Burkman, C.A. Peterson, "Understanding and Specifying the Sources and Effects of Surface Contamination in Semiconductor Processing", pg 107, Journal of Wafer Contamination, Vol 32, September1998.
3. Kern, W., "The Evolution of Silicon Wafer Cleaning Technology", pg. 7, RCA Review, 1974.
4. Ohmi, Tadahiro, "Total Room Temperature Wet Cleaning of Silicon Surfaces", pg. 323,
Semiconductor International, July 1996 .
5 Krusell, W., Golland, D., "Cleaning Technologies for High Volume Production of Silicon
Wafers", pg.23, The Journal of the Electrochemical Society, Vol. 94, 1998.
6. Syverson, W., Fleming, M., "The Benefits of SC-1/SC-2 Megasonic Wafer Cleaning", pg. 10,
Journal of the Electrochemical Society, Vol. 92, 1997.
7. Cady, W., Varadarajan, M., "RCA Clean Replacement", pg.32, J.T Baker Microelectronics
Journal, 1999.
8. "Chlor-Alkali Market Report", pg 68, Chemical Market Associates, Vol 83, March 28, 2001.
9. Lai, K., Hao, M., Chen, W., "Surface Cleaning Effects on Reliability for Devices With Ultra-Thin Oxides or Oxynitrides", pg. 137, S.P.I.E, Volume 2334.
Chapter 6: Appendix
Material Safety Data Sheet For JTB -100 Baker Solution
JTB 100 BAKER CLEAN
(Patented)-MSDS Number: B0033 -- Effective Date: 12/08/96 1. Product Identification
Synonyms: None
CAS No.: Not applicable to mixtures.
Molecular Weight: Not applicable to mixtures. Chemical Formula: Not applicable to mixtures. Product Codes: 6420, 6430 2. Composition/Information on Ingredients Ingredient Water Proprietary CompTSRN4314011-5036p Proprietary Component,TSRN4314011-5037p Trade Secret Registry Number
004314011-5036p is for Alkylammonium Hydroxide Trade Secret Registry Number
004314011-5037p is for the Carboxylate
Buffer System. CAS No 7732-18-5 N/A N/A Percent Hazardous 79 - 99% < 20% * 10% No Yes Yes 3. Hazards Identification Emergency Overview
POISON! DANGER! CORROSIVE LIQUID. CAUSES SEVERE EYE IRRITATION OR BURNS. MAY CAUSE ALLERGIC REACTION. AVOID BREATHING SOLUTION MIST. HARMFUL IF INHALED. MAY BE FATAL IF SWALLOWED OR ABSORBED THROUGH SKIN.
J.T. Baker SAF-T-DATA(tm) Ratings (Provided here for your convenience)
Health Rating: 2 -Moderate Flammability Rating: 0 -None Reactivity Rating: 0 -None
Contact Rating: 3 -Severe (Corrosive)
Lab Protective Equip: GOGGLES & SHIELD; LAB COAT & APRON; VENT HOOD; PROPER GLOVES
Storage Color Code: White (Corrosive) Potential Health Effects
Inhalation:
Solution mists are highly corrosive to mucous membrane. Ingestion:
Highly corrosive to mucous membrane. causes severe bums to mouth, throat, and stomach, may be fatal.
Skin Contact:
Highly corrosive to skin. Causes alkali bums. and severe irritation, may be fatal. May be absorbed through the skin with possible systemic effects.
Eye Contact:
Highly corrosive to eyes. May cause severe eye irritation. and bums. Chronic Exposure:
Kidney damage, liver damage, dermatitis. Aggravation of Pre-existing Conditions:
Skin disorders, eye disorders, liver or kidney disorders. 4. First Aid Measures
Inhalation:
If the solution mist is inhaled, remove to fresh air. If not breathing, give artificial respiration. If breathing is difficult, give oxygen. Prompt action is essential. Ingestion:
CALL A PHYSICIAN. If swallowed, if conscious, Do NOT INDUCE VOMITING. Immediately give victim a large volume of water and milk. Skin Contact:
In case of contact, immediately flush skin with large amounts of water for at least 15 minutes. remove all contaminated clothing and get medical attention.
Eye Contact:
Immediately flush eyes with gentle but large stream of water for at least 15 minutes, lifting lower and upper eyelids occasionally. Call a physician immediately.
Note to Physician: Treat as alkali burn.
5. Fire Fighting Measures
Fire:
Not expected to be a fire hazard. Explosion:
None identified.
Fire Extinguishing Media:
Use extinguishing media appropriate for surrounding fire. Special Information:
Wear S.C.B.A. Avoid splashing on skin or clothing. 6. Accidental Release Measures
Wear self-contained breathing apparatus and full protective clothing. Stop leak if you can do so without risk. Ventilate area. Carefully neutralize spill with dilute HCl. Flush area with flooding amounts of water. (Use caution.) Prevent run-off from entering drains, sewers, or streams.
7. Handling and Storage
Keep container tightly closed (readily absorbs C02 from the air). Bond and ground containers when transferring liquid. Protect from freezing. Do not get material on skin, in eyes, or on clothing. Wear protective clothing, chemical resistant gloves, safety goggles and wash thoroughly after handling. No food, beverages or tobacco products should be carried, stored or consumed where this chemical is used. Containers of this material may be hazardous when empty since they retain product residues (vapors, liquid); observe all warnings and precautions listed for the product.
8. Exposure Controls/Personal Protection Airborne Exposure Limits:
None established. Ventilation System:
A system of local and/or general exhaust is recommended to keep employee exposures as low as possible. Local exhaust ventilation is generally preferred because it can control the emissions of the contaminant at its source, preventing dispersion of it into the general work area. Please refer to the ACGIH document,
Industrial Ventilation, A Manual of Recommended Practices, most recent edition,
Personal Respirators (NIOSH Approved):
For conditions of use where exposure to the substance is apparent, consult an industrial hygienist. For emergencies, or instances where the exposure levels are not known, use a full-facepiece positive-pressure, air-supplied respirator.
WARNING: Air purifying respirators do not protect workers in oxygen-deficient atmospheres.
Skin Protection:
Wear impervious protective clothing, including boots, gloves, lab coat, apron or coveralls, as appropriate, to prevent skin contact.
Eye Protection:
Use chemical safety goggles and/or a full face shield where splashing is possible. Maintain eye wash fountain and quick-drench facilities in work area.
9. Physical and Chemical Properties Appearance:
Clear, colorless liquid. Odor: Amine-like odor. Solubility: Complete (100%) Specific Gravity: 1.02 pH: 9.6 % Volatiles by volume @ 21C (70F): No information found. Boiling Point: 96C (205F) Melting Point: OC (32F)
Vapor Density (Air-1): No information found. Vapor Pressure (mm Hg): No information found.
Evaporation Rate (BuAc=1): No information found. 10. Stability and Reactivity
Stability:
Stable under ordinary conditions of use and storage. Hazardous Decomposition Products:
Carbon monoxide, oxides of nitrogen, alcohols, amines. Hazardous Polymerization:
Will not occur. Incompatibilities: Strong acids.
Conditions to Avoid: Heat, boiling temperatures. 11. Toxicological Information
--- \Cancer
Lists\--- NTP CarcinogenLists\---
Carcinogen---Ingredient Known Anticipated IARC Category
--- --- ---
---Water (7732-18-5) No No None
Proprietary CompTSRN4314011-5036p No No None
Proprietary No No None Component, TSRN4314011-5037p 12. Ecological Information Environmental Fate: No information found. Environmental Toxicity: No information found. 13. Disposal Considerations
Whatever cannot be saved for recovery or recycling should be managed in an appropriate and approved waste facility. Although not a listed RCRA hazardous waste, this material may exhibit one or more characteristics of a hazardous waste and require appropriate analysis to determine specific disposal requirements. Processing, use or contamination of this product may change the waste
management options. State and local disposal regulations may differ from federal disposal regulations. Dispose of container and unused contents in accordance with federal, state and local requirements.
14. Transport Information Domestic (Land, D.O.T.)
Proper Shipping Name: CORROSIVE LIQUIDS, N.O.S. (ALKYLAMMONIUM HYDROXIDE)
Hazard Class: 8 UN/NA: UN1760 Packing Group: II
Information reported for product/size: 430LB International (Water, I.M.O.)
Proper Shipping Name: CORROSIVE LIQUIDS, N.O.S. (ALKYLAMMONIUM HYDROXIDE)
Hazard Class: 8 UN/NA: UN1760
Packing Group: II
Information reported for product/size: 430LB
15. Regulatory Information
--- \Chemical Inventory Status - Part
1\---Ingredient TSCA EC Japan Australia
Water (7732-18-5) Yes Yes Yes Yes
Proprietary CompTSRN4314011-5036p Yes Yes Yes Yes Proprietary Component,TSRN4314011-5037p Yes Yes Yes Yes
--- \Chemical Inventory Status - Part
2\--- Canada2\---
Canada--Ingredient Korea DSL NDSL Phil.
Water (7732-18-5) Yes Yes No Yes
Proprietary CompTSRN4314011-5036p Yes Yes No Yes Proprietary Component,TSRN4314011-5037p Yes Yes No Yes
--- \Federal, State & International Regulations - Part
1\---SARA 302- --- SARA
313---Ingredient RQ TPQ List Chemical
Catg.
Water (7732-18-5) No No No No
Proprietary CompTSRN4314011-5036p No No No No
--- \Federal, State & International Regulations - Part 2\---RCRA- -TSCA-Ingredient CERCLA 261.33 8(d) Water (7732-18-5) No No No Proprietary CompTSRN4314011-5036p No No No Proprietary Component,TSRN4314011-5037p 5000 No No
Chemical Weapons Convention: No TSCA 12(b): No CDTA: No SARA 311/312: Acute: Yes Chronic: Yes Fire: No Pressure: No Reactivity: No (Mixture / Liquid)
Australian Hazchem Code: No information found. Poison Schedule: No information found.
WHMIS:
This MSDS has been prepared according to the hazard criteria of the Controlled Products Regulations (CPR) and the MSDS contains all of the information required by the CPR.
16. Other Information
NFPA Ratings: Health: 2 Flammability: 0 Reactivity: 0 Label Hazard Warning:
POISON! DANGER! CORROSIVE LIQUID. CAUSES SEVERE EYE IRRITATION OR BURNS. MAY CAUSE ALLERGIC REACTION. AVOID BREATHING SOLUTION MIST. HARMFUL IF INHALED. MAY BE FATAL IF SWALLOWED OR ABSORBED THROUGH SKIN.
Label Precautions:
Do not get in eyes, on skin, on clothing. Keep in tightly closed container. Use with adequate ventilation. Wash thoroughly after handling. In case of spill, carefully neutralize spill with dilute HCL. Flush spill area with water. Prevent run-off from entering drains, sewers, or streams.
Label First Aid:
CALL A PHYSICIAN. If swallowed, if conscious, Do NOT INDUCE
VOMITING. Immediately give victim a large volume of water and milk. In case of contact, immediately flush eyes or skin with plenty of water for at least 15 minutes while removing contaminated clothing and shoes. Wash clothing before reuse.
Product Use: Process Chemical
Revision Information:
Mixture. New 16 section MSDS format, all sections have been revised. Disclaimer:
****************************** Mallinckrodt Baker, Inc. provides the
information contained herein in good faith but makes no representation as to its comprehensiveness or accuracy. This document is intended only as a guide to the appropriate precautionary handling of the material by a properly trained person using this product. Individuals receiving the information must exercise their independent judgment in determining its appropriateness for a particular purpose. MALLINCKRODT BAKER, INC. MAKES NO REPRESENTATIONS OR WARRANTIES, EITHER EXPRESS OR IMPLIED, INCLUDING WITHOUT LIMITATION ANY WARRANTIES OF MERCHANTABILITY, FITNESS FOR A PARTICULAR PURPOSE WITH RESPECT TO THE INFORMATION SET FORTH HEREIN OR THE PRODUCT TO WHICH THE INFORMATION REFERS. ACCORDINGLY, MALLINCKRODT BAKER, INC. WILL NOT BE RESPONSIBLE FOR DAMAGES RESULTING FROM USE OF OR
RELIANCE UPON THIS INFORMATION.
****************************** Prepared by: Strategic Services Division