Bottom-Up Estimates of Coal Mine Methane Emissions in
China: A Gridded Inventory, Emission Factors, and Trends
The MIT Faculty has made this article openly available.
Please share
how this access benefits you. Your story matters.
Citation
Sheng, Jianxiong et al. "Bottom-Up Estimates of Coal Mine Methane
Emissions in China: A Gridded Inventory, Emission Factors, and
Trends." Environmental Science & Technology Letters (May 2019):
473–478 © 2019 American Chemical Society
As Published
http://dx.doi.org/10.1021/acs.estlett.9b00294
Publisher
American Chemical Society (ACS)
Version
Final published version
Citable link
https://hdl.handle.net/1721.1/128863
Terms of Use
Article is made available in accordance with the publisher's
policy and may be subject to US copyright law. Please refer to the
publisher's site for terms of use.
Bottom-Up Estimates of Coal Mine Methane Emissions in China: A
Gridded Inventory, Emission Factors, and Trends
Jianxiong Sheng,
*
,†Shaojie Song,
‡Yuzhong Zhang,
‡,§Ronald G. Prinn,
†and Greet Janssens-Maenhout
∥†Center for Global Change Science, Massachusetts Institute of Technology, Cambridge, Massachusetts 02139, United States
‡John A. Paulson School of Engineering and Applied Sciences, Harvard University, Cambridge, Massachusetts 02138, United States
§Environmental Defense Fund, Washington, D.C. 20009, United States
∥European Commission, Joint Research Centre (JRC), Via E. Fermi 2749 (T.P. 123), I-21027 Ispra, VA, Italy
*
S Supporting InformationABSTRACT: China has large but uncertain coal mine methane (CMM) emissions. Inverse modeling (top-down) analyses of atmospheric methane observations can help improve the emission estimates but require reliable emission patterns as prior information. To serve this urgent need, we developed a
high-resolution (0.25° × 0.25°) methane emission inventory for
China’s coal mining using a recent publicly available database of
more than 10000 coal mines in China for 2011. This number of coal mines is 25 and 2.5 times, respectively, more than the number available in the EDGAR v4.2 and EDGAR v4.3.2 gridded global inventories, which have been extensively used in past inverse
analyses. Our inventory shows large differences with the EDGAR
v4.2 as well as its more recent version, EDGAR v4.3.2. Our results
suggest that China’s CMM emissions have been decreasing since
2012 on the basis of coal mining activities and assuming time-invariant emission factors but that regional trends differ greatly.
Use of our inventory as prior information in future inverse modeling analyses can help better quantify CMM emissions as well
as more confidently guide the future mitigation of coal to gas in China.
■
INTRODUCTIONChina is the largest producer of coal in the world. China’s coal
mine methane (CMM) emissions are a major anthropogenic source in the global methane budget but are poorly
quantified.1,2
The most recent CMM emissions in China reported to the United Nations Framework Convention on
Climate Change (UNFCCC) are 23.8 Tg of CH4year−1 for
2012, accounting for >60% of the reported global CMM emissions, while estimates from independent bottom-up
inventories3−7 vary significantly from 14 to 28 Tg of CH4
year−1.
Inverse modeling (top-down) analyses of atmospheric methane observations can help improve the estimates but require an accurate spatial distribution of emissions as prior
knowledge.8 National emission inventories reported to the
UNFCCC often do not include spatial information. Past
inverse modeling analyses9−13 have relied on the Emission
Database for Global Atmospheric Research (EDGAR) gridded
global inventories,3,7 which contains information about 400−
4000 coal mines in China, while the Chinese State Administration of Coal Mine Safety (SACMS) reported
more than 10000 operating coal mines in 2011.14Incomplete
prior information about coal mine locations may bias
top-down estimates and their interpretations and mislead the
assessment of China’s CMM mitigation policy.13
Gridded emission inventories with an improved spatial distribution of methane emissions have been developed for
Australia,15 Canada,16 Mexico,16 the United Kingdom,17
Switzerland,18 the United States,19 and the global oil/gas
sector.20Results from Maasakkers et al.,19Sheng et al.,16and
Scarpelli et al.20show large differences with the EDGAR v4.2
and v4.3.2 inventories for the oil/gas sector. The regional
inversion in the Southeast United States from Sheng et al.21
using the improved prior estimates of Maasakkers et al.19
supports the Environmental Protection Agency (EPA)
bottom-up inventory,22while previous inversion studies relying on the
EDGAR v4.2 inventory have suggested that the EPA inventory is too low.
Here we present a 0.25° × 0.25° resolution inventory of
China’s CMM emissions for 2011 based on the most recent
publicly available SACMS database, including more than Received: May 14, 2019 Revised: May 29, 2019 Accepted: May 31, 2019 Published: May 31, 2019 Letter pubs.acs.org/journal/estlcu Cite This:Environ. Sci. Technol. Lett. 2019, 6, 473−478
This is an open access article published under an ACS AuthorChoice License, which permits copying and redistribution of the article or any adaptations for non-commercial purposes.
10000 coal mines, to serve the urgent need to better quantify
China’s methane emissions on a finer scale and to more
confidently attribute CMM contributions and guide CMM
mitigation policy.
■
MATERIALS AND METHODSThe databases and methods used in this study are depicted in
Figure 1. We start from the database of the National Coal
Mine Methane Level Identification for 2011 compiled by
SACMS.14All coal mines in China are required to report their
methane emissions to SACMS for safety evaluations, but emission factors and production are not mandatory. The SACMS database covers 10963 coal mines in 26 coal-producing provinces in mainland China, in which 10093 operating mines measured and reported their methane
emissions (total of 53000 m3min−1) and 1046 mines reported
their captured methane (total of 15000 m3min−1), which can
be used in natural gas applications. According to the SACMS database, each coal mine measured its emissions by
continuously monitoring its ventilation and degasification
systems during its annual safety evaluation (2−3 months).
The number of coal mines in the SACMS database is 25 and 2.5 times more than that available in the EDGAR v4.2 and
EDGAR v4.3.2 gridded global inventories,3,7respectively. The
coal mine database23used in EDGAR v4.3.2 covers 4243 coal
mines and 36% of China’s coal production in 2011 but is
strongly biased toward Shanxi province. It excessively includes 3347 coal mines in Shanxi (>3 times the number of Shanxi coal mines in the SACMS database), while it represents only 10%
of coal mines and 24% of coal production for the rest of the
country (seeFigure S1).
The national total for 2011 derived from the SACMS
database is 16.7 Tg of CH4 year−1 by applying the IPCC
conversion factor of 0.67 kg m−3 and the provincial level
utilization rate for captured methane (see Figure S2). The
SACMS labels coal mines either high CH4content (emissions
of >40 m3min−1or emission factors of >10 m3Mg−1) or low
CH4content. High-CH4content mines account for 27% of the
total coal mines but contribute 75% of the total emissions. The reported emissions from the SACMS database may have large uncertainties, but the derived total emissions are in the range
of 13−30 Tg of CH4 year−1 from the 2000−2012 Global
Carbon Project,2 comparable to the independent bottom-up
estimates (16.1−17.7 Tg of CH4 year−1)5,6 using provincial
level emissions factors, but much lower than those (20.5−28.4
Tg of CH4year−1)3,7 using generic emission factors.
The original SACMS database is a paperback book. We scan
it into 1003 image files and apply the Optical Character
Recognition (OCR) algorithm (with an accuracy of >99%)
provided by Baidu AI Open Platform24to generate a digitized
database. We manually verify the OCR results with the top 100 methane-emitting coal mines (accounting for 32% of total
emissions) and find no differences. The SACMS database
provides no geological coordinates of coal mines. To spatially allocate emissions to mine facilities, we use coal mine names in the database and apply the geocoding algorithms from Baidu
Map Platform25to retrieve coal mine locations. We find that
the accuracy is typically within 0.25° (i.e., town or village level)
by comparing the Baidu results with those from Google Maps
Figure 1.Diagram of steps for estimating coal mine methane emissions in China. The databases, methods, and results of this study are indicated by the colors blue, green, and orange, respectively.
Environmental Science & Technology Letters Letter
DOI:10.1021/acs.estlett.9b00294
Environ. Sci. Technol. Lett. 2019, 6, 473−478
Platform,26 which are offset by 50−500 m because of
restrictions on geographic data in China.27We manually verify
the locations of the top 100 emitters andfind that most spatial
errors are within 0.15° and the maximum error is 0.21° (see
the Supporting Information for details). To minimize errors due to imprecise locations, we thus limit our gridded inventory
at 0.25° × 0.25° resolution, which is sufficient for regional
studies. At such a resolution, we also find that emission
patterns can likely be applied to more recent years (seeFigure
S4).
We derive region-specific emission factors based on 8027
reported emission factors (EFs) in the SACMS database. We assume that emission factors for a given province follow the same distribution because of the similarities in local practices
and coal mine basins, which are well separated by province.28
We first adjust individual emission factors accordingly if
capture and utilization of methane are reported. Then we calculate the density distribution of the adjusted emission
factors for low- and high-CH4content mines at the provincial
level. This density distribution is facility-normalized regardless of its emissions or production because emission factors depend on only local practices (i.e., utilization of CMM), the underground structure of the coal mine layers, and the type
of coal.2,7 The mean of the density distribution of emission
factors for each province is applied to production data from
2005 to 2016 (see Table S1) to calculate provincial CMM
emission trends. The resulting error standard deviations are applied to all mines in the corresponding province to derive
Figure 2.China’s coal mine methane emissions for 2011. The left panel shows the spatial distributions of China’s coal mine methane emissions at 0.25° × 0.25° resolution from this study, EDGAR v4.2, and EDGAR v4.3.2. The right panel shows coal methane emissions from the top 20 CMM-emitting provinces and the rest of China (“Other”).
uncertainties in each grid cells, which can serve as prior errors in inversions, though they may not fully account for uncertainties in the SACMS database.
■
RESULTS AND DISCUSSIONFigure 2(left panel) shows the calculated spatial distribution of
China’s CMM emissions for 2011 at 0.25° × 0.25° resolution
derived from 10093 coal mines reporting to SACMS. Also
shown are the results from the EDGAR v4.2 inventory,3which
has been widely used as prior information in past inverse
analyses,9−13and its recently updated version, EDGAR v4.3.2.7
There are significant differences in spatial patterns between our
work and the two EDGAR inventories. There are only∼400
Chinese coal mines available in EDGAR v4.27 (<4% of the
SACMS database). Allocation of national total emissions to its limited mine locations leads to incorrect spatial patterns and
artifactual emission hot spots. EDGAR v4.3.2 significantly
improves on v4.2 by using a database of 4243 coal mines from
Liu et al.23 However, EDGAR v4.3.2 still tends to
under-estimate emissions in the north, overunder-estimate them in the east, and miss most of them in the southwest when compared to our newly derived inventory. In addition to incomplete
informa-tion about coal mine locainforma-tions, this difference may also be due
to a lack of sub-country-specific emission factors for China in
EDGAR v4.3.2.7 These spatial errors will cause an incorrect
relative fraction of CMM emissions within the grid box that would bias the analysis of trends and source attribution in inversions.
Figure 2 (right panel) shows the top 20 CMM-emitting provinces in China for 2011 in our inventory and the results from the EDGAR v4.2 and v4.3.2 inventories. In our inventory, Shanxi province is the largest source of CMM emissions in China and contributes 35% of the national total. The southwest (Sichuan, Chongqing, Guizhou, and Yunnan) is also a major source region, accounting for 28% of the national total. Anhui and Liaoning are the provinces that emit the most in the east and north, respectively. The spatial errors in the EDGAR v4.2 and v4.3.2 inventories remain on the provincial level (coarser resolution) as their relative contributions of
provinces to CMM emissions differ significantly from ours.
Figure 3 shows the derived spatial distribution of emission
factors at the provincial level for low- and high-CH4content
mines in the SACMS database, along with their uncertainties (relative error standard deviations) that can be used as prior error estimates in the inversion. Emission factors for low- and
high-CH4 content mines in the southwest are the highest,
explaining their large emissions despite their relatively small production. The spatial variation in emission factors across the
country could be related to different local practices (e.g.,
Figure 3. China’s coal methane emission factors and their uncertainties. Top panels show the spatial distribution of emission factors at the provincial level for low- and high-CH4 content coal mines. Bottom panels show the uncertainties (relative error standard deviations) of the emission factors for low- and high-CH4content coal mines. White areas indicate that no data are available.
Environmental Science & Technology Letters Letter
DOI:10.1021/acs.estlett.9b00294
Environ. Sci. Technol. Lett. 2019, 6, 473−478
utilization of CMM), the underground structure of the coal
mine layers, and the type of coal.2,7 Uncertainties (relative
error standard deviations) are relatively small (40−60%) in the
south, while uncertainties are the highest in the northern provinces such as Liaoning and Inner Mongolia.
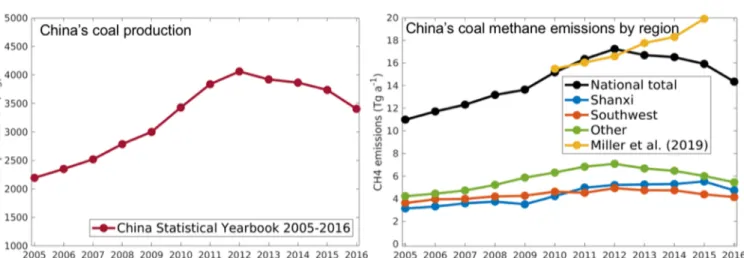
Figure 4shows China’s coal production activities and their
methane emissions trends for 2005−2016, along with emission
contributions from Shanxi, the southwest region (Sichuan, Chongqing, Guizhou, and Yunnan), and the rest of the country. Here methane emissions are derived from multiplying the coal production data by our 2011 time-invariant emission
factors. China’s national coal methane emissions have declined
since 2012, which is consistent with its coal production activities but deviates from the inversion results of Miller et
al.13 using EDGAR v4.2 as prior information. The emission
trend in Shanxi has been continuously increasing from 2006 to 2015. However, the emission trends in the southwest region
and the rest of the country slowed in 2010−2011 and have
declined since 2012. This seems to conform to China’s CMM
mitigation policy that closes small township and village coal
mines (∼50% of which are in the southwest) and expands
production at the largest operators (mainly in Shanxi). Inverse modeling (top-down) analyses without prior information in the regions with concentrated small coal mines (e.g., EDGAR
v4.2 inFigure 2) are unlikely to be able to detect the declining
emissions from these regions.
CMM emission trends, often not accounted for in previous
relevant studies, could play a significant role in understanding
net climate benefits of coal-to-gas mitigation policy, which has
been debated since the late 1980s.29−32The decline of China’s
CMM emissions inferred in this study would further support a coal-to-gas shift in China, though our results may be limited by the assumption of time-invariant emission factors because
some studies suggest that China’s CMM EFs could evolve over
time, but their trends are being debated.6,13
In conclusion, we have developed a gridded inventory of methane emissions from the coal mining sector in China at 0.25° × 0.25° resolution that can serve as prior information in inverse modeling using atmospheric methane observations. Our inventory uses the best available information to derive the
spatial distribution of China’s CMM emissions, which should
constitute an improvement upon existing emission inventories.
Our bottom-up analyses also suggest that China’s CMM policy
has successfully reduced national CMM emissions. This is in
contrast with the results from a recent Bayesian inversion,13
which however is limited by its erroneous prior assumptions of emission patterns (EDGAR v4.2). Future inversions combin-ing satellite and surface network data with our work should
improve the estimation of China’s CMM emissions and
provide a more robust assessment of China’s coal-to-gas policy.
■
ASSOCIATED CONTENT*
S Supporting InformationThe Supporting Information is available free of charge on the
ACS Publications website at DOI: 10.1021/acs.es-tlett.9b00294.
Chinese coal mine databases, coal mine methane utilization in China, geocoding of the SACMS database, emission patterns in 2011 and 2014, coal production in China, coal mine methane emissions and emission
factors in China, and references (PDF)
■
AUTHOR INFORMATION Corresponding Author *E-mail:shengj@mit.edu. ORCID Jianxiong Sheng: 0000-0002-8008-3883 Shaojie Song:0000-0001-6395-7422 NotesThe authors declare no competingfinancial interest.
The gridded inventory in this study is available at https://
forms.gle/NGMXUTfMumMFkMZPA.
■
ACKNOWLEDGMENTSThis work was supported by NASA Grant NNX16AC98G to the Massachusetts Institute of Technology. S.S. was supported by the Harvard Global Institute. Y.Z. was partially supported
by the Kravis Scientific Research Fund of the Environmental
Defense Fund.
■
REFERENCES(1) Kirschke, S.; Bousquet, P.; Ciais, P.; Saunois, M.; Canadell, J. G.; Dlugokencky, E. J.; Bergamaschi, P.; Bergmann, D.; Blake, D. R.; Figure 4.Trends in China’s coal activities and emissions from 2005 to 2016. The left panel shows historical coal production from the China Statistical Yearbook (provincial level). The right panel shows emission trends inferred from the provincial level production data and emission factors derived in this study (see the text) for Shanxi province, the southwest region (Chongqing, Guizhou, Sichuan, and Yunnan), and the rest of China (“Other”).
Bruhwiler, L.; et al. Three decades of global methane sources and sinks. Nat. Geosci. 2013, 6, 813−823.
(2) Saunois, M.; Bousquet, P.; Poulter, B.; Peregon, A.; Ciais, P.; Canadell, J. G.; Dlugokencky, E. J.; Etiope, G.; Bastviken, D.; Houweling, S.; et al. The global methane budget 20002012. Earth System Science Data 2016, 8, 697−751.
(3) Joint Research Centre (JRC)/Netherlands Environmental Assessment Agency (PBL), European Commission. Emission Database for Global Atmospheric Research (EDGAR), release version 4.2; 2011.
(4) Smith, S. J.; Zhou, Y.; Kyle, P.; Wang, H.; Yu, H. A Community Emissions Data System (CEDS): Emissions For CMIP6 and Beyond; 2015.
(5) Peng, S.; Piao, S.; Bousquet, P.; Ciais, P.; Li, B.; Lin, X.; Tao, S.; Wang, Z.; Zhang, Y.; Zhou, F. Inventory of anthropogenic methane emissions in mainland China from 1980 to 2010. Atmos. Chem. Phys. 2016, 16, 14545−14562.
(6) Zhu, T.; Bian, W.; Zhang, S.; Di, P.; Nie, B. An Improved Approach to Estimate Methane Emissions from Coal Mining in China. Environ. Sci. Technol. 2017, 51, 12072−12080.
(7) Janssens-Maenhout, G.; Crippa, M.; Guizzardi, D.; Muntean, M.; Schaaf, E.; Dentener, F.; Bergamaschi, P.; Pagliari, V.; Olivier, J.; Peters, J.; et al. EDGAR v4.3.2 Global Atlas of the three major Greenhouse Gas Emissions for the period 1970−2012. Earth System Science Data Discussions 2019, 1−52.
(8) Jacob, D. J.; Turner, A. J.; Maasakkers, J. D.; Sheng, J.; Sun, K.; Liu, X.; Chance, K.; Aben, I.; McKeever, J.; Frankenberg, C. Satellite observations of atmospheric methane and their value for quantifying methane emissions. Atmos. Chem. Phys. 2016, 16, 14371−14396.
(9) Alexe, M.; Bergamaschi, P.; Segers, A.; Detmers, R.; Butz, A.; Hasekamp, O.; Guerlet, S.; Parker, R.; Boesch, H.; Frankenberg, C.; et al. Inverse modelling of CH4 emissions for 20102011 using different satellite retrieval products from GOSAT and SCIAMACHY. Atmos. Chem. Phys. 2015, 15, 113−133.
(10) Turner, A. J.; Jacob, D. J.; Wecht, K. J.; Maasakkers, J. D.; Lundgren, E.; Andrews, A. E.; Biraud, S. C.; Boesch, H.; Bowman, K. W.; Deutscher, N. M.; et al. Estimating global and North American methane emissions with high spatial resolution using GOSAT satellite data. Atmos. Chem. Phys. 2015, 15, 7049−7069.
(11) Pandey, S.; Houweling, S.; Krol, M.; Aben, I.; Chevallier, F.; Dlugokencky, E. J.; Gatti, L. V.; Gloor, E.; Miller, J. B.; Detmers, R.; et al. Inverse modeling of GOSAT-retrieved ratios of total column CH4 and CO2 for 2009 and 2010. Atmos. Chem. Phys. 2016, 16, 5043−5062.
(12) Maasakkers, J. D.; Jacob, D. J.; Sulprizio, M. P.; Scarpelli, T. R.; Nesser, H.; Sheng, J.-X.; Zhang, Y.; Hersher, M.; Bloom, A. A.; Bowman, K. W.; et al. Global distribution of methane emissions, emission trends, and OH concentrations and trends inferred from an inversion of GOSAT satellite data for 2010−2015. Atmos. Chem. Phys. Discuss. 2019, 1−36.
(13) Miller, S. M.; Michalak, A. M.; Detmers, R. G.; Hasekamp, O. P.; Bruhwiler, L. M. P.; Schwietzke, S. Chinas coal mine methane regulations have not curbed growing emissions. Nat. Commun. 2019, 10, 303.
(14) State Administration of Coal Mine Safety. Compilation of National Coal Mine Gas Level Identification for 2011; 2012.
(15) Wang, Y.-P.; Bentley, S. T. Development of a spatially explicit inventory of methane emissions from Australia and its verification using atmospheric concentration data. Atmos. Environ. 2002, 36, 4965−4975.
(16) Sheng, J.-X.; Jacob, D. J.; Maasakkers, J. D.; Sulprizio, M. P.; Zavala-Araiza, D.; Hamburg, S. P. A high-resolution (0.1 × 0.1) inventory of methane emissions from Canadian and Mexican oil and gas systems. Atmos. Environ. 2017, 158, 211−215.
(17) National Atmospheric Emissions Inventory. 2014; http://naei. defra.gov.uk/(accessed December 12, 2018).
(18) Hiller, R. V.; Bretscher, D.; DelSontro, T.; Diem, T.; Eugster, W.; Henneberger, R.; Hobi, S.; Hodson, E.; Imer, D.; Kreuzer, M.; et al. Anthropogenic and natural methane fluxes in Switzerland
synthesized within a spatially explicit inventory. Biogeosciences 2014, 11, 1941−1959.
(19) Maasakkers, J. D.; Jacob, D. J.; Sulprizio, M. P.; Turner, A. J.; Weitz, M.; Wirth, T.; Hight, C.; DeFigueiredo, M.; Desai, M.; Schmeltz, R.; et al. Gridded National Inventory of U.S. Methane Emissions. Environ. Sci. Technol. 2016, 50, 13123−13133.
(20) Scarpelli, T.; Jacob, D.; Maasakkers, J.; Sheng, J. X.; Rose, K.; Payer Sulprizio, M.; Worden, J. A Global Gridded Inventory of Methane Emissions from Fuel Exploitation including Oil, Gas, and Coal. AGU Fall Meeting Abstracts; American Geophysical Union: Washington, DC, 2018; Vol. 33.
(21) Sheng, J.-X.; Jacob, D. J.; Turner, A. J.; Maasakkers, J. D.; Sulprizio, M. P.; Bloom, A. A.; Andrews, A. E.; Wunch, D. High-resolution inversion of methane emissions in the Southeast US using SEAC4RS aircraft observations of atmospheric methane: anthro-pogenic and wetland sources. Atmos. Chem. Phys. 2018, 18, 6483− 6491.
(22) Environmental Protection Agency. Inventory of U.S. Greenhouse Gas Emissions and Sinks 1990−2014; 2014.
(23) Liu, Z.; Guan, D.; Wei, W.; Davis, S. J.; Ciais, P.; Bai, J.; Peng, S.; Zhang, Q.; Hubacek, K.; Marland, G.; et al. Reduced carbon emission estimates from fossil fuel combustion and cement production in China. Nature 2015, 524, 335−338.
(24) Baidu AI Open Platform. Optical Character Recognition (OCR); 2018;https://ai.baidu.com/tech/ocr(accessed December 12, 2018). (25) Baidu Map Platform. Baidu Map API; 2018; https://lbsyun. baidu.com/products/products/map(accessed December 12, 2018).
(26) Google Maps Platform. Google Maps API; 2018;https://cloud. google.com/maps-platform/maps/(accessed December 12, 2018).
(27) Wikipedia. Restrictions on geographic data in China; 2019;
https://en.wikipedia.org/w/index.php?title=Restrictions_on_ geographic_data_in_Chinaoldid=894502273 (accessed May 1, 2019).
(28) Dai, S.; Ren, D.; Chou, C.-L.; Finkelman, R. B.; Seredin, V. V.; Zhou, Y. Geochemistry of trace elements in Chinese coals: A review of abundances, genetic types, impacts on human health, and industrial utilization. Int. J. Coal Geol. 2012, 94, 3−21.
(29) Lelieveld, J.; Crutzen, P. J. Indirect chemical effects of methane on climate warming. Nature 1992, 355, 339.
(30) Qin, Y.; Edwards, R.; Tong, F.; Mauzerall, D. L. Can Switching from Coal to Shale Gas Bring Net Carbon Reductions to China? Environ. Sci. Technol. 2017, 51, 2554−2562.
(31) Qin, Y.; Tong, F.; Yang, G.; Mauzerall, D. L. Challenges of using natural gas as a carbon mitigation option in China. Energy Policy 2018, 117, 457−462.
(32) Tanaka, K.; Cavalett, O.; Collins, W. J.; Cherubini, F. Asserting the climate benefits of the coal-to-gas shift across temporal and spatial scales. Nat. Clim. Change 2019, 9, 389.
Environmental Science & Technology Letters Letter
DOI:10.1021/acs.estlett.9b00294
Environ. Sci. Technol. Lett. 2019, 6, 473−478