HAL Id: hal-03027996
https://hal.archives-ouvertes.fr/hal-03027996
Submitted on 27 Nov 2020HAL is a multi-disciplinary open access archive for the deposit and dissemination of sci-entific research documents, whether they are pub-lished or not. The documents may come from teaching and research institutions in France or abroad, or from public or private research centers.
L’archive ouverte pluridisciplinaire HAL, est destinée au dépôt et à la diffusion de documents scientifiques de niveau recherche, publiés ou non, émanant des établissements d’enseignement et de recherche français ou étrangers, des laboratoires publics ou privés.
Distributed under a Creative Commons Attribution - NonCommercial - NoDerivatives| 4.0 International License
Spatial and temporal diversity of service plant
management strategies across vineyards in the south of
France. Analysis through the Coverage Index
Hugo Fernandez Mena, Hélène Frey, Florian Celette, Léo Garcia, Karim
Barkaoui, Laure Hossard, Audrey Naulleau, Raphaël Métral, Christian Gary,
Aurélie Metay
To cite this version:
Hugo Fernandez Mena, Hélène Frey, Florian Celette, Léo Garcia, Karim Barkaoui, et al.. Spa-tial and temporal diversity of service plant management strategies across vineyards in the south of France. Analysis through the Coverage Index. European Journal of Agronomy, 2021, 123, pp.126191. �10.1016/j.eja.2020.126191�. �hal-03027996�
‘Spatial and Temporal Diversity of Service Plant Management Strategies across Vineyards in the South of France. Analysis through the Coverage Index’
Authors: Hugo Fernández-Mena1*, Hélène Frey2, Florian Celette3, Léo Garcia1, Karim Barkaoui5, Laure Hossard4, Audrey Naulleau2,4, Raphaël Métral1, Christian Gary2, Aurélie Metay1**
Affiliations:
1. Montpellier SupAgro, Institut Agro, University of Montpellier – UMR ABSys – UMR SYSTEM (Montpellier SupAgro, INRAE, CIRAD, CIHEAM IAMM), Montpellier, France
2. INRAE – UMR ABSys – UMR SYSTEM (Montpellier SupAgro, INRAE, CIRAD, CIHEAM-IAMM), Montpellier, France
3. ISARA, Research Unit Agroecology and Environment, Lyon, France
4. INRAE – UMR INNOVATION (Montpellier SupAgro, INRAE, CIRAD, University of Montpellier), Montpellier, France
5. CIRAD – UMR ABSys – UMR SYSTEM (Montpellier SupAgro, INRAE, CIRAD, CIHEAM-IAMM), Montpellier, France
* hugo.fernandez-mena@supagro.fr, **aurelie.metay@supagro.fr
Keywords: cover crop; service plant; intercropping; spontaneous vegetation; survey. Highlights:
Spontaneous service plants strategies present a high spatial and temporal diversity Strategies can be measured by calculating the Coverage Index (CI) for each vineyard Higher CI was linked to quality labels, organic crop protection and low target yields No link was found between CI and water and soil resources in vineyards
Target services by winegrowers are consistent with the CI and period coverage Abstract:
‘Service plants’ include spontaneous vegetation or sown species of cover crops associated with perennial crops in the rows or inter-rows with a high potential to provide ecosystem functions and services. In vineyards, service plants target specific services depending on the management strategy implemented by the winegrower, including the plant species, the surface covered, the plant growth control and destruction date. Understanding the management strategies linked to their associated target services at the regional scale is necessary to better help winegrowers, advisers and policy makers regarding an adapted use of service plants. To do this, we conducted a survey in 2016 among 334 winegrowers in Languedoc-Roussillon region in France, enquiring about their service plant management practices during the season 2014-2015. Given the diversity of the strategies of service plant management, we proposed a typology analyzing their spatial and temporal dimensions. Further, we present a Coverage Index (CI), which combines both temporal and spatial dimensions of the service plant management strategies. We conducted a multiple components analysis and clustering to create a vineyard typology and applied linear models to find correlations between the CI and specific vineyard characteristics. Three quarters of interviewed winegrowers sowed or maintained service plants in their vineyards; 41% used a winter service plant strategy; 8.4% a semi-permanent and 27.3% a semi-permanent service plant strategy. The preferred surface coverage strategy was full surface during grapevine dormancy and its reduction to half of the inter-rows after grapevine budburst. However, the diversity of surface coverage strategies during the grapevine vegetative period was remarkable. Lower water resources and specific soil characteristics were not linked to the service plant management strategies. Higher CI was associated with vineyards presenting quality labels (PDO and Organic), independent winemaking and lower target yields, showing that the added value of producing high quality wine plays an important role when implementing service plants in vineyards. Overall, our study
showed: i) the popularity of spontaneous service plant strategies; ii) the spatial and temporal diversity of service plant management strategies and iii) the utility of the CI to study the implementation of service plants and to understand the motivations and constraints of their use.
1. Introduction
Mediterranean regions present a high risk of soil erosion (Cerdan et al., 2010; García-Ruiz, 2010; González-Hidalgo et al., 2007). These lands are prone to soil erosion partially because of climatic conditions, with a high occurrence of extreme weather events (Reiser and Kutiel, 2011), but also because of soils with low soil organic matter content and soil stability (Marzaioli et al., 2010; Romanyà and Rovira, 2011; Sinoga et al., 2012). Land-use in the Mediterranean is often devoted to farming (Francaviglia et al., 2014; Mohawesh et al., 2015) and vineyards are one of the main farming activities (Dougherty, 2012). Aggravated by climate change, farming systems in the Mediterranean can easily lead to degradation, especially in vineyard areas where, generally, the soil covering rate is low (García‐Orenes et al., 2012; Muñoz‐Rojas et al., 2015; Zdruli, 2014). Soil management in vineyards is usually achieved through destruction of grass vegetation using soil tillage or by the application of herbicides (Lieskovský and Kenderessy, 2014; Pateiro-Moure et al., 2013). However, soil tillage in vineyards increases the risk of soil erosion, in particular, due to the high level of runoff especially during intense rainfall events (Cerdà et al., 2017; Rodrigo Comino et al., 2016). The impact of soil erosion in Mediterranean vineyards has been estimated at 9.3 Mg of soil loss per hectare and year (Prosdocimi et al., 2016). Preventing soil degradation in vineyards is essential, in particular considering the grapevine permanent crop status and their frequent location on terraced or steep slopes (Tarolli et al., 2015). Thus, a more sustainable soil management strategy for vineyards is needed to preserve the soil and to associate ecosystem services (Winter et al., 2018).
1.1. What are service plants and why are they important?
Service plants are spontaneous vegetation (weeds) and sown plant species associated with a perennial crop in the rows or inter-rows with a high potential to provide ecosystem functions and services. In the literature, these plants are often named ‘vegetation cover’ but without linking their activity to the ecosystem services provided (Hall et al., 2020; Winter et al., 2018); ‘cover crops’ referring to sown plant species (Ripoche et al., 2012; Samedani et al., 2014) but sometimes referring also to spontaneous vegetation (Schütte and Bergmann, 2019) and also ‘service crops’ (Garcia et al., 2018) to emphasize their management needs similar to crops. As stated previously, some of the most significant services provided by service plants in vineyards are linked to soil support and regulation (Daane et al., 2018). More generally, service plants present beneficial effects on soil quality compared to bare soils (Biarnès et al., 2012; Guzmán et al., 2019; Salomé et al., 2016). They help to prevent nutrient loss due to reduction of runoff (García-Díaz et al., 2017), and through N catch crops when seeding legume species (Novara et al., 2013). Service plants can also play a role in mitigating climate change in vineyards since they can contribute to carbon sequestration by increasing soil organic matter content and soil stability at the same time (Novara et al., 2019; Wolff et al., 2018). Service plants can help to provide a habitat for natural enemies of grapevine pests (Danne et al., 2010). In addition, they can improve vineyard aesthetics (
Kazakou
et al., 2016; Winkler et al., 2017) and also reduce on and off-site costs (Schütte et al., 2020). On the flip side, certain plant species associated with grapevines can occasionally induce competition for resources. Water stress is thought to be the most limiting resource to consider for plant association with grapevines in Mediterranean conditions, followed by nutrient competition (Celette et al., 2010; Celette and Gary, 2013; Lopes et al., 2011; Monteiro and Lopes, 2007). Furthermore, associated plants can eventually host vine pests (Muscas et al., 2017; Rusch et al., 2017; Wilson and Daane, 2017). Finding suitable trade-offs through careful management of the vineyard cropping system will enhance target services and reduce undesirable disservices (Rapidel et al., 2015).Different strategies can be used to manage spontaneous vegetation or sown species, depending on the composition and diversity of plant species, the surface area of the service plants, the type of vegetation control and the date of destruction (Garcia et al., 2018). Spontaneous vegetation is frequently chosen as the basic service plant option by winegrowers thanks to its easiness and lower management costs (Metay et al., 2017). Instead, sown service crops, sometimes named intercrops (Ripoche et al., 2010), can be useful for providing additional services compared to the spontaneous vegetation, such as greater biomass production, N fixation, lower water demand or pest repellency (Donkó et al., 2017; Irvin et al., 2016; Mercenaro et al., 2014; Miglécz et al., 2015; Tomaz et al., 2017). Compared to sown plant species, spontaneous service plants have been shown to produce greater (Bordelon and Weller, 1997; Guzmán et al., 2019) or lower biomass (Kazakou et al., 2016). In the Mediterranean context, spontaneous cover treatment can be chosen as a costless trade-off for the winegrowers between improving soil properties, limiting mechanical work and maintaining vine production (Kazakou et al., 2016). Additionally, some spontaneous species having different traits and using resources differently can also complete their cycle (e.g., early flowering weed species able to produce seeds before the closure of the canopy of the cover crop) (Kazakou et al., 2016). Finally, winegrowers’ management can modulate weed richness and abundance presenting interesting functional traits (Fried et al., 2019).
The management of service plants to avoid grapevine water stress in Mediterranean regions is crucial, especially during the grapevine vegetative period, between budburst and flowering (Garcia de Cortazar Atauri et al., 2017; Vasconcelos et al., 2009). The spatial and temporal strategy to avoid grapevine water stress has to be flexible enough to adapt to and plot conditions and inter-annual climate variability (Ripoche et al., 2010). In this sense, the adaptation of service plant coverage to different soil depths is necessary to prevent early water stress in grapevines, but sometimes includes important trade-offs between grape yield and protecting soil from erosion (Delpuech and Metay, 2018). In the case of arable cropping systems, the date of destruction is a crucial leverage that farmers have to manage (Alonso-Ayuso et al., 2020). After destruction, service plant residues left in the vineyard provide several agroecological services for the vineyard such as the supply of nutrients and the preservation of soil humidity (Ranaivoson et al., 2017). Although these residues can be used as a natural mulch preventing the growth of spontaneous vegetation (Steinmaus et al., 2008), mulches can be created using pruning wastes (López-Urrea et al., 2020), bringing in biomass, plastics, fibers and/or bioplastics (Gastaldi et al., 2018).
Surface area and time of year dictate the number of management operations in the row, the inter-row or both, such as the use of herbicides or mechanical tillage for weeding and the control of plant growth by mowing or rolling. Furthermore, the winegrowers preference for a service plant strategy is also related to grape yield objectives (according to wine label regulations); to the level of technical knowledge (Marques et al., 2015) ; to the use of inputs such as pesticides (Mailly et al., 2017), fertilizers, water, fuel and labor-time (Borsato et al., 2020); and to the associated services targeted by the winegrower (Mercenaro et al., 2014).
1.3. How can we study service plant management strategies at the regional scale?
Although the scientific literature provides detailed information on trials of service plant management strategies at the plot and the farm scale, we know little about how and why winegrowers implement these strategies at farm and regional scales, including the vineyard surface area covered by the service plant, the growth control practices and the dates of destruction. Only a few studies have analyzed the implementation of service plants by winegrowers at the regional scale. Marques et al. (2015) evidenced that strategies were linked to vineyard climatic conditions, the knowledge of winegrowers and the type of business structures. Schütte and Bergmann (2019) showed that winegrowers doing direct sales of high quality wine pay more attention to the environment and consequently use service plants more often than winegrowers selling their grapes to winemaking cooperatives. Hall et al. (2020) demonstrated that an increase in management operations on service plants (i.e., tillage, chemical weeding, mowing, mulch, etc.) resulted in lower species
richness, functional diversity and vegetation cover, although vineyard structural characteristics and winegrower motivations were not taken into account.
In France, the agricultural census (Agreste, 2017) provides a brief classification of service plants in vineyards in 2013. This classification includes the type of weed control (chemical, mechanical or mixed), and just three options of the temporality of weed destruction (completely bare soil; temporary cover crop; and permanent cover crop). The same classification degree was used in several European regions by Hall et al. (2020). However, these classification methods could be improved in terms of temporality and spatial surface covered, in relation to the grapevine cycle, and the objectives of the service plant strategy. Therefore, we believe that further analysis of the diversity of service plant management strategies across vineyards at a regional scale will help to better understand the assets and constraints to the implementation of service plants in vineyards in the Mediterranean region. We hypothesize that an intensive use of service plants (higher surface covered, longer duration, selected plant material, etc.) could be linked to less constrained vineyard conditions concerning soils, water access and climate. Likewise, we expect that this degree of intensity could be linked to vineyards producing wine with high added value and lower target yields.
In the present work, we conducted a survey among winegrowers in the Languedoc-Roussillon region (south of France), enquiring about the practices involved in the management of service plants and the services expected. We built a theoretical spatial and temporal typology, described in section 2.2, and a Coverage Index (CI), described in section 2.3, that were applied to the service plant management strategies found in the survey. Then, we tested if the service plant management strategies depend on: (i) the conditions, in this case, the economic and physical characteristics of the vineyards; and (ii) the desired services, by analyzing target services and disservices highlighted by the winegrowers in the survey.
2. Materials and Methods
2.1. Survey and study area description
We conducted a survey across vineyards of the former Languedoc Roussillon region in 2016 (Fig. 1). The survey aimed to better understand the management strategies of service plants in vineyards during the previous grapevine season, i.e., starting in fall 2014 and harvested in fall 2015. For the survey, about 3000 winegrowers were contacted by email through public and private extension services of the region in agronomy and viticulture (Chambres d’Agriculture, Civam, Sudvinbio, etc.), targeting as many winegrowers as possible without seeking a specific profile. Organic viticulture consultants in the region,
Sudvinbio and Civam Languedoc Roussillon who have a specific interest in understanding service plant
strategies, helped to elaborate the questionnaire. In total, 334 winegrowers answered the survey, representing around 3% of the current winegrowing population in Languedoc-Roussillon and representing slightly more than 10% of the winegrowers contacted. The questionnaire and the answers are available online in an opensource dataset (Fernandez-Mena, 2020). The questionnaire was composed of 101 questions with semi-open and multiple-choice answers divided into four sections:
(i) the vineyard characteristics (size, labels, irrigation, soil features) (ii) soil management practices (tillage, mowing, herbicide use, compost)
(iii) the typical (or most frequent) service plant management strategy at the vineyard scale, defined by the spatial design and its duration, plus the use of sown crops or spontaneous vegetation (iv) their objectives, such as target yield, target services and constraints to the adoption of service
plants
Although some vineyards have differentiated management according to plots, most of the questions relating to service plants concern the main management service plant strategy, i.e. applied to the larger part of the vineyard. We considered this to be their main management strategy in the whole vineyard.
A B
Figure 1. (A) The Languedoc Roussillon region in the South of France shown within official French regional borders which changed in 2015 (Wikialine, 2009). (B) the location of the winegrowers that answered the survey is represented in green circles and weather stations in orange stars.
In Languedoc Roussillon region (Fig. 1), winemaking accounts for around 18000 independent cellars with 228000 hectares of vineyards, representing 30% of the vineyard surface area in France (Agreste, 2013). The elevation of the region ranges from sea level to 1567 m, although vineyards are usually located below 900 m (Fanet, 2009). Across the landscape of the region, flat vineyards with deep soils are usually located in lowland plains close to the Mediterranean coast while vineyards with steep slopes and shallow soils are in higher altitudes inland. Soils present a high variability in the stoniness, and are mostly calcaric luvisols, lixisols and cambisols (Coll, 2011; IUSS Working Group WRB, 2015). The climate of the Languedoc Roussillon region is characterized by high temperatures and low rainfall during the summer, with high variability and torrential rain events. Both rainfall and temperatures of the fall 2014 and the winter, spring and summer 2015, obtained from the weather stations in the region (Fig. 2), were similar to the average weather conditions in the region. There is a spatial variability within the region for rainfall and maximum temperatures (Meteo France and ADEME, 2015), usually inland vineyards in high areas present significantly higher rainfall and lower average temperatures.
0 5 10 15 20 25 30 0 50 100 150 200 250 300 350 400 T ( ° Cel s iu s ) Rai nfa ll (m m ) PET (m m )
Average monthly rainfall (mm) Average monthly Penman PET (mm) Average monthly temperature (° Celsius)
Figure 2. Climatic variables during season 2014-2015 obtained as an average of weather stations (n=17) in the Languedoc Roussillon region (Météo France and CLIMATIK data). Average monthly rainfall (mm) is represented in blue bars. The average monthly temperature (Celsius degrees) corresponds to the solid red line and average monthly Penman potential evapotranspiration (PET) to the yellow dashed line.
2.2. Typology of service plant management strategies according to temporal and spatial dimensions
According to the literature (Celette and Gary, 2013; Garcia et al., 2018; Ripoche et al., 2010) and after discussing service plant multiple patterns in Languedoc Roussillon (Fig. 3) with agricultural extension services, we proposed a theoretical double typology to examine the strategies announced in the survey through temporal and spatial dimensions. The temporal typology was classified in 4 main strategies:
1. The ‘Bare soil’ strategy, is generally practiced by winegrowers weeding (chemically or mechanically) the whole year and continuously destroying the soil cover. With this strategy, it is possible to avoid any possible interaction between the service plant and the grapevines. The choice of this strategy could be linked to the apprehension of resource competition with grapevines or to vineyard aesthetics (clean ground).
2. The ‘Winter cover’ strategy; lies on the practice of leaving a spontaneous service plant or choosing to sow a chosen service plant during winter only, from grape harvest until grapevine budburst. By using this strategy, resource competition during grapevine vegetative period is very limited. Also, the soil is protected when most rainfall occurs. Compared to the previous strategy, they reduce labor and machinery costs of weeding during winter, when the grapevine is dormant, principally making use of spontaneous vegetation in the service plant.
3. The ‘Semi-permanent cover’ strategy, is followed by winegrowers destroying their service plant during the spring period, generally around grapevine flowering. As highlighted by our surveys (section 3.3), winegrowers using this strategy aim to avoid competition for resources after the grapevine has flowered, while profiting from target services of the service plant during most of the year. Less weeding than the previous strategy is required, and therefore costs are reduced.
4. The ‘Permanent cover’ strategy, is practiced by winegrowers leaving service plants all through the year. By using this strategy, winegrowers can target positive interactions between service plants and vineyards that endure until grapevine harvest. This strategy englobes permanent partial surfaces, e.g. covering only the row all year, helping to reduce cover crop destruction costs.
a b
c d
Figure 4. Service plant management examples in Languedoc Roussillon: a. Spontaneous vegetation in the row during winter, predominance ofTaraxacum officinale, © Yvan Bouisson; b. Barley sown in the inter-row and
mechanical weeding in the row, in spring, © Yvan Bouisson; c. Faba bean in the inter-row and soil tillage in the row during autumn, © Yvan Bouisson; d. Perennial service plants on the grapevine row by testing different
Thymus species (Thymus pseudolanuginosus and Thymus serpyllum), © Hugo Fernandez-Mena.
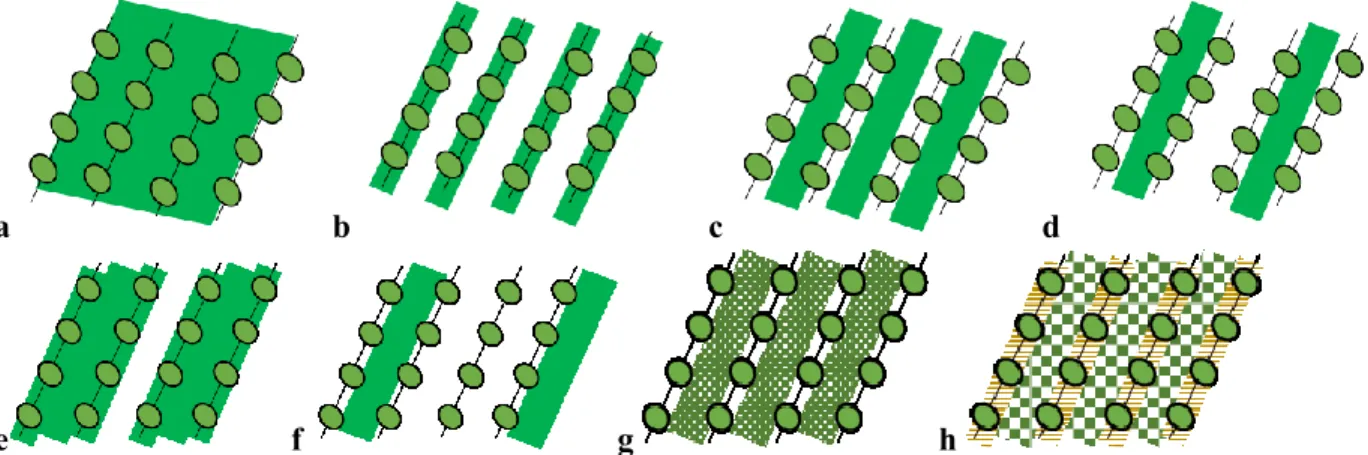
As regards the spatial design, we identified several configurations depending on the number of rows and inter-rows where service plant destruction can be achieved through tillage or herbicide use. A full cover (row and inter-row) is generally employed to reduce costs, especially in periods of water abundance. The vegetation of the inter-row can be destroyed using herbicides or soil tillage. Vegetation in rows can be eliminated using herbicides or specific equipment such as under-vine foot blades. Different combinations of inter-row cover and bare soil exist, for instance, one-every-two inter-rows or bare soil in one-every-three inter-rows, with or without a covered row. Some growth control operations can also be applied to previous configurations, such as rolling the inter-row or mowing it. Mechanical mowing operations during winter can be associated with grapevine shoot grinding and during summer it helps to create mulch in the row (Fig. 4).
a b c d
e f g h
Figure 4. The spatial design of some service plant management strategies. The letters correspond to: ‘a’ full cover; ‘b’ row cover; ‘c’ row cover; ‘d’ one-every-two rows cover; ‘e’ row and one-every-two inter-rows cover; ‘f’ one-every-three inter-inter-rows cover; ‘g’ rolled inter-inter-rows; ‘h’ mowed inter-inter-rows (green squares) and plastic mulch in the rows (yellow stripes).
Analyzing either the spatial or the temporal dimension alone does not provide complete information on service plant management. Some permanent covers can cover a reduced surface and, on the contrary, full covers are sometimes destroyed early. In many cases, the service plant is partially destroyed at several points in the season, often by reducing the covered surface area. Consequently, an integrated indicator considering both temporal and spatial strategy is needed to better characterize service plant management at the yearly scale, such as the CI explained as follows.
2.3. Coverage Index (CI) of service plants
We propose an indicator to measure the coverage rate of a service plant called Coverage Index (CI). This indicator is calculated as the surface covered by the service plant, divided by the total vineyard surface during a specific period ‘p’ (Eq. 1).
Eq. 1
𝑪𝑰
𝒑 =𝒔𝒖𝒓𝒇𝒂𝒄𝒆 𝒄𝒐𝒗𝒆𝒓𝒆𝒅 𝒃𝒚 𝒕𝒉𝒆 𝒔𝒆𝒓𝒗𝒊𝒄𝒆 𝒑𝒍𝒂𝒏𝒕 (𝒉𝒂) 𝒕𝒐𝒕𝒂𝒍 𝒗𝒊𝒏𝒆𝒚𝒂𝒓𝒅 𝒔𝒖𝒓𝒇𝒂𝒄𝒆 (𝒉𝒂)
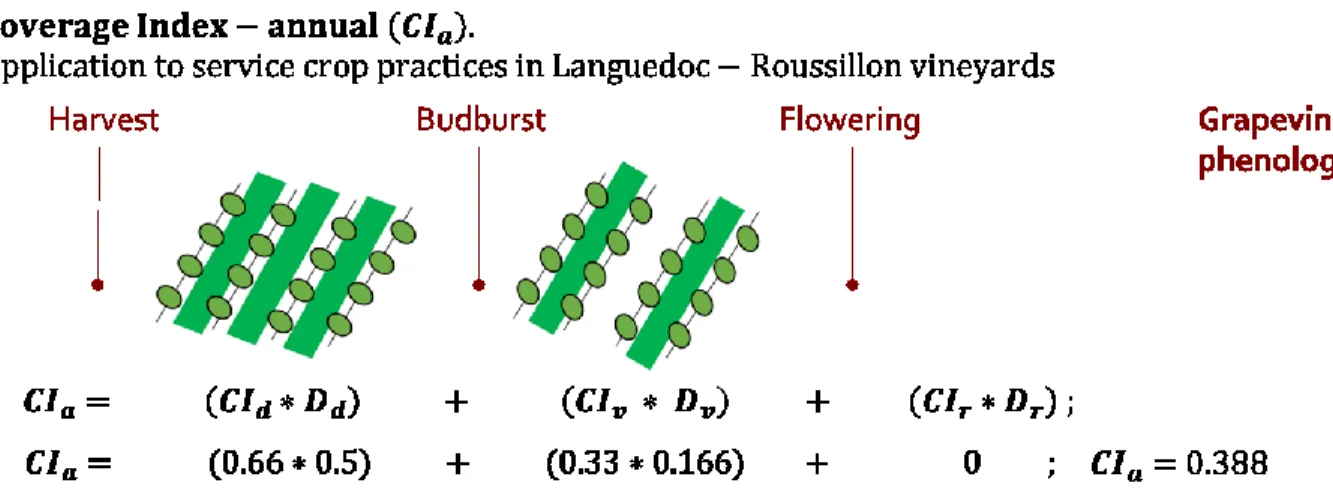
As soil and climate conditions vary according to vineyard and year, service plant adaptation strategies to climatic and soil conditions across vineyards are diverse. To consider the temporal dimension, we split the year into 3 periods corresponding to the main development periods of grapevines and we calculated a specific CI for each of these periods: (i) a vegetative period starting at budburst in April; (ii) a reproductive period starting at flowering; and (iii) a dormancy period considered as starting after harvest and slightly before the beginning of leaf senescence. Therefore, the CI index can be calculated separately for each of the three key periods of grapevine phenology: the dormancy of the grapevine, the vegetative period of the grapevine, and the reproductive period of grapevine. Then, an annual value of the Coverage Index (CI –
Annual) can be calculated by adding all the CI periods, weighted by the duration of the period out of a year
(Eq. 2).
Eq. 2 𝑪𝑰𝒂= (𝑪𝑰𝒅∗ 𝑫𝒅) + (𝑪𝑰𝒗 ∗ 𝑫𝒗) + (𝑪𝑰𝒓∗ 𝑫𝒓) 𝑫𝒅 + 𝑫𝒗 + 𝑫𝒓 = 1 (year)
𝐶𝐼𝑎: Coverage Index – Annual is the ratio covered by the service plant, established annually.
𝐶𝐼𝑑: Coverage Index – Dormancy is the ratio covered by the service plant during winter and grapevine
𝐷𝑑: Duration ratio of the dormancy period, that in our case included the period between harvest and leaf senescence as well.
𝐶𝐼𝑣: Coverage Index – Vegetative is the ratio covered by the service plant during the grapevine vegetative period.
𝐷𝑣: Duration ratio of the grapevine vegetative period, between grapevine budburst and flowering.
𝐶𝐼𝑟: Coverage Index – Reproductive is the ratio covered by the service plant during the grapevine
reproductive period.
𝐷𝑟: Duration ratio of the grapevine reproductive period, between flowering and grape harvest.
In the survey, winegrowers specified how row and inter-row surfaces were managed. In this region and depending on the machinery used, grapevine rows are separated by a distance between 2-2.5 meters large (inter-row coverage), and row width between 0.6-0.8 meters (row coverage), as described in Roby et al., (2008). For the calculation of the CI, we assumed that inter-rows are equivalent to two-thirds of the total surface, and grapevine rows to one-third of it.
In the Languedoc-Roussillon region, the main grapevine development stages are generally observed in early April for budburst, early-June for flowering and late September or in October for maturity and the beginning of leaf fall (Fraga et al., 2016; Garcia de Cortazar Atauri et al., 2017). Thus, we considered the vegetative period to be equivalent to approximately two months out of 12, 𝐷𝑣 = 0.166, the reproductive period equivalent to approximately four months out of 12, 𝐷𝑟= 0.333 and the dormancy period equivalent to six months out of twelve, 𝐷𝑑 = 0.5. Therefore, a vineyard presenting a service plant in all inter-rows during
dormancy, changing at grapevine budburst to half of the inter-rows and destroying them at grapevine
flowering, will have an CI–Annual = 0.388 (Fig. 5).
Figure 5. Example of Coverage Index calculation for service plant management in Languedoc Roussillon vineyards. Grapevine phenological periods appear in dark red. Coverage Index in the different grapevine periods are: 𝑪𝑰𝒅 for the dormancy period; 𝑪𝑰𝒗 for the vegetative period; 𝑪𝑰𝒓 for the reproductive period. Similarly, the duration of the periods is: 𝑫𝒅 for dormancy; 𝑫𝒅 for the beginning of the grapevine vegetative period and 𝑫𝒓: Duration ratio of the grapevine reproductive period.
2.4. Data analysis
Firstly, the service plant management strategies founded in the survey have been classified by temporal and spatial design at the identified grapevine periods by calculating the percentage of winegrowers choosing to implement that strategy. Then, both dimensions were integrated into CI calculations for each winegrower, as well as their corresponding CI category. The CI calculations were categorized as a factor by distributing
them into 5 Categories: CI= 0; 0>CI<0.25; 0.25>CI<0.5; 0.5>CI<0.75; CI>0.75. The categories were defined by equal intervals, except the 0 category, being the category having the highest frequency among all the CI values together. These categories enabled us to compare the Coverage Index with different vineyard categorical factors, announced as follows.
Secondly, to create a typology of service plant strategies, we used a combination of multiple correspondence analyses (MCA) and ascendant hierarchical classification (AHC), as other studies of farm typologies have done (Aouadi et al., 2015; Deheuvels et al., 2012). Two MCA were performed to observe the link between qualitative factors pointed out by the winegrowers (vineyard structure, soil-climate conditions) and the CI categories. A first MCA was performed using vineyard structural and activity variables such as: vineyard size; winemaking (cooperative; independent); winegrower (full-time; part-time); quality label (PGI; PDO; none); crop protection (organic; conventional); irrigation (yes/no); target yield interval (<40 hl/ha; 40-55 hl/ha; 55-80 hl/ha; >80 hl/ha) and if target yield is achieved or not. A second MCA was performed using pedoclimatic conditions of the vineyards as active variables. They included average rainfall at the closest weather station and main soil conditions in the vineyard: soil texture and depth categories; carbonates in the soil; average stoniness and the degree of slope. Significant MCA dimensions were selected to analyze their variables with the higher contribution by using linear models. The significance of variables with a contribution higher than two times the average of the contributions to these dimensions (Cibois, 1997) was tested using linear modeling (‘lm’ R function). In addition, clusters of the MCA were performed using AHC Ward method (Ward Jr, 1963). Tukey’s range test was used to compare the quantitative CI distribution of the clusters.
Thirdly, the fifth top target services announced by winegrowers and the CI categories of the winegrowers targeting those services were analyzed according to their corresponding and relevant coverage period. The
CI–Annual was used to analyze the ‘biodiversity’ (Winter et al., 2018) and the ‘soil organic matter’ (Muñoz‐
Rojas et al., 2015) services; the CI Dormancy was used to analyze the ‘soil erosion’ (Rodrigo Comino et al., 2016) service and the CI during dormancy plus vegetative periods was used to understand the ‘soil bearing capacity’ (Novara et al., 2019) and ‘ green manure’ (Novara et al., 2013) services. Finally, the two first disservices highlighted by our survey sample, namely competition for water resources and lowering of grapevine yields, were contrasted with the individual and the categorized CI of the vineyards. Individual CI were confronted with irrigation capacity and rainfall of key periods. In addition, CI categories were confronted with irrigation capacity and target services using chi-squared test test.
Statistical analysis was performed using ‘R software’ (R Core Team, 2014) and using ‘car’ R package (Fox and Weisberg, 2019). Multiple correspondence analysis and hierarchical clustering on principal components were performed using ‘FactomineR’ R package (Lê et al., 2008). Plots were done using ‘dplyr’ R package (Wickham et al., 2018), ‘explor’ R package (Barnier, 2020), and ‘ggplot2’ R package (Wickham, 2016).
3. Results
3.1. Description of service plant management strategies: temporal and surface dimensions
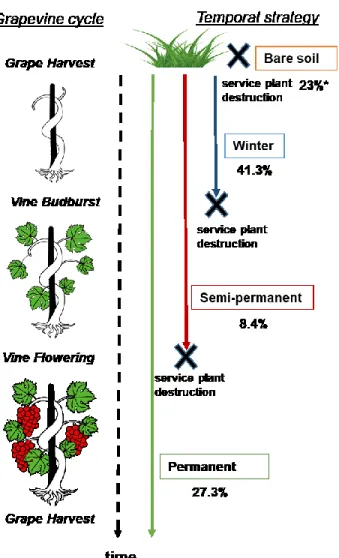
All the temporal strategies previously defined in section 2.2 (Fig. 6) were observed in our survey sample. The winter cover strategy was the most popular (41.3 %). It is used by winegrowers tolerating vegetation only during winter and aiming to avoid competition between grapevines and the service plant, when grapevine vegetation starts, in particular concerning water resources. Winegrowers with bare soil strategy (23.3 %) decided to destroy their service plant earlier, during grapevine dormancy, probably concerned about a reduction in the soil water stock available at grapevine budburst. Destroying the service plant at grapevine flowering through a semi-permanent strategy (8.4%) is chosen to facilitate fruit filling, especially in seasons marked by water scarcity. Finally, a permanent strategy, was still popular among the winegrowers consulted (27.3 %) choosing to keep a surface portion of the service plant coverage the whole
year, probably looking for specific services as developed further in this section. According to our survey, the decision making of the service plant destruction date depended on several indicators: weather conditions; labor (and machinery) availability; grapevine phenology; grapevine stress and grass phenology (SI – Fig. 2).
Figure 6. Temporal typology of the service plant strategies. On the left, the timeline presents the main grapevine vegetative periods. Temporal categories according to the date of service plant destruction (symbolized by a black cross) are shown with their percentages for winegrowers having a service plant during that period. Concerning the spatial design, all of the predefined spatial strategies (Fig. 4) appear in our surveys (Table 1). Very often, winegrowers chose to reduce the surface area with a cover crop during grapevine growth. During the grapevine dormancy period, 64.4 % of the winegrowers having a service plant (therefore excluding bare soil strategies) used a full surface coverage strategy. The others either chose an inter-row coverage or a row coverage and, a minority of 0.6 %, used a permanent plastic mulch on the row. After grapevine budburst, the range of spatial design implemented by permanent and semi-permanent temporal strategies increased. During these periods, our survey sample chose predominantly, 40.3% and 38.2 % respectively, to cover half of the inter-rows.
Table 1. Percentage of service plant spatial designs out of the total survey sample using service plants (not destroyed in the period) during each of the three key grapevine phenology stages. The most frequent spatial
design for each period is underlined. Letters (a, b, c, d, e, f g, h) correspond to spatial designs illustrated in Figure 3.
Spatial design Dormancy
period Vegetative period Reproductive period a. full cover 64.4 % 10.3 % 11.1 % b. row cover 15.3 % 12.5 % 10.2 %
c and g. inter-row cover 19.7 % 26.4 % 26.9 %
d. one-every-two (half) inter-rows cover - 40.3 % 38.2 %
e. row and one-every-two inter-rows cover - 8.9 % 9.3 %
f. one-every-three inter-rows cover - - 2.3 %
h. mowed inter-row and plastic mulch in rows 0.6 % 1.6 % 2 %
Since we considered row width and inter-row spaces to be homogeneous for CI calculation in the present study, calculated values of CI periods appeared at specific ratios, such as 0; 0.33; 0.5; 0.66 and 1. However, their combination in the CI–Annual created a higher diversity of values (SI–Fig. 1A). Although various strategies can obtain a similar value of CI–Annual, we observed that, generally, permanent and semi-permanent strategies present a higher CI–Annual (SI – Fig. 1B). From dormancy to reproductive periods, we observed that CI decreased and so did the CI categories (Fig. 7). During the dormancy period, most of the winegrowers in the sample (75 %) covered all or part of the vineyard surface and almost half of them (48 %) chose a high surface coverage strategy (CI > 0.75). After budburst (vegetative period), there is a drastic reduction of the CI, with around two-thirds of the survey sample (64,3 %) destroying the service plants and those keeping some coverage did so only partially (CI < 0.5). Finally, no significant differences are observed in the CI from vegetative to reproductive periods.
Figure 7. Percentages of the Coverage Index (CI) categories on each CI Period. The CI categories correspond to: 0 CI in cream-colored; CI between 0 and 0.25 in very light green; CI between 0.25 and 0.5 in light green;
CI between 0.5-0.75 in intense green and CI higher than 0.75 in dark green. Each of the whole bars represents 100% of the values of the CI categories for the CI period mentioned.
3.2. Winegrower and Vineyard characteristics according to CI categories
With our survey, we obtained a representative sample of vineyard and winegrowers characteristics. We found a wide diversity of vineyard total size, from small (<10ha) to big (>40ha) surfaces. Most were full-time winegrowers (81.7%) and performed their winemaking in a cooperative winery (60.2%). Around 38% of the them are labelled organic, slightly more than the actual population in the region where 32% of vineyards are labelled organic (Agence Bio, 2017). The two most important wine quality labels in the region are PGI (Protected Geographical Indication – Indication Géographique Protégée) and PDO (Protected
Designation of Origin – Appellation d’Origine Protégée) labels of the European framework. In our survey,
PGI labels appear in 83% and PDO in 60% of the vineyards consulted. Actually, both labels are slightly over represented in our survey sample, since actual PGI are found in 64% and PDO in 38% of the total viticultural surfaces (Agreste, 2013).
Among farming practices linked to soil management covered in the survey, we highlight that more than one-third of the survey sample did composting, most of them having an organic label (Table 2b). Irrigation systems were present in almost one-third of the vineyards, being overrepresented compared to the 15% in the current census (Agreste, 2018). All winegrowers in our sample using herbicides for service plant destruction combined this with tillage. In fact, those combining herbicides and tillage for destruction did not significantly reduce soil tillage (4,31 tillage operations per year) compared to those not using herbicides (4,57 tillage operations per year), yet, those not using herbicides presented higher CI categories. Only winegrowers with the top CI category (> 0.75), substantially reduced soil tillage (1,3 tillage operations per year). Among the control operations, mowing, that included indirect mows while vine shoot grinding, is relatively widespread (60.7%) and is almost always performed in vineyards with high CI categories (0.5-0.75 and >(0.5-0.75). In contrast, rolling operations were only applied by 4.7% of the sample. The date of mowing varies depending on the temporal management strategy, but they were performed all along the season (SI – Fig 3), mainly guided by grass height (SI – Fig. 4).
The spontaneous service plant strategies are predominant in the survey (91.1% of the answers). Only 30 winegrowers had sown specific plant species, especially in their inter-rows. The species sown were mostly grasses (43 %), legumes (39%), and crucifers (16 %) and some flowers (2%).
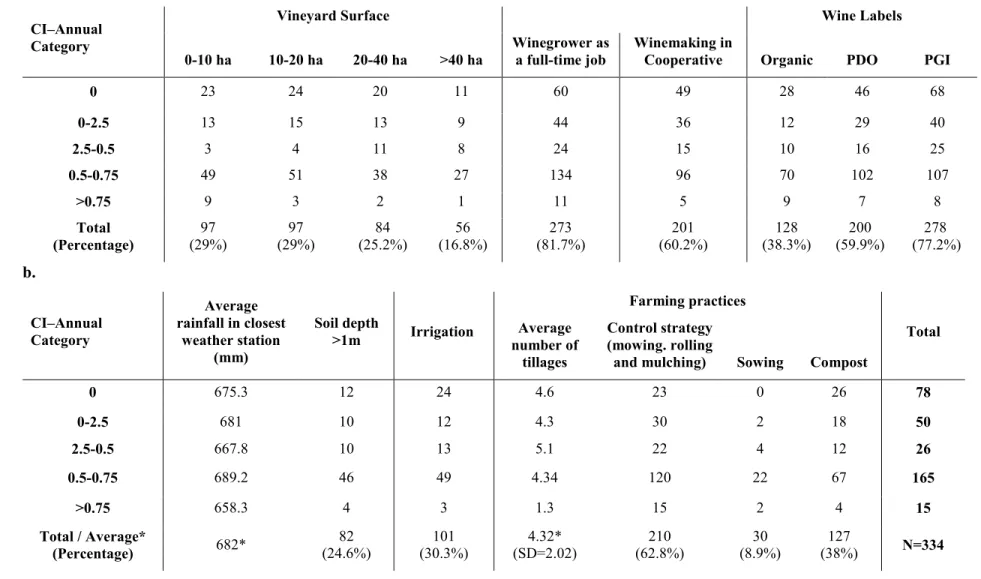
Table 2. Summary of the survey sample (number of winegrowers) classified by the Annual Coverage Index (CI–Annual) category. At the top, chart ‘a’ 1
shows vineyard structural characteristics and labels. At the bottom, chart ‘b’ shows climate and soil characteristics and associated farming practices. 2
Percentages are calculated with the vineyards presenting the characteristic out of the total. Quality labels stand for PGI: Protected Geographical 3
Indication and PDO: Protected Designation of Origin. 4
a. 5
CI–Annual Category
Vineyard Surface Wine Labels
0-10 ha 10-20 ha 20-40 ha >40 ha Winegrower as a full-time job Winemaking in Cooperative Organic PDO PGI
0 23 24 20 11 60 49 28 46 68 0-2.5 13 15 13 9 44 36 12 29 40 2.5-0.5 3 4 11 8 24 15 10 16 25 0.5-0.75 49 51 38 27 134 96 70 102 107 >0.75 9 3 2 1 11 5 9 7 8 Total (Percentage) 97 (29%) 97 (29%) 84 (25.2%) 56 (16.8%) 273 (81.7%) 201 (60.2%) 128 (38.3%) 200 (59.9%) 278 (77.2%) b. 6 CI–Annual Category Average rainfall in closest weather station (mm) Soil depth >1m Irrigation Farming practices Total Average number of tillages Control strategy (mowing. rolling
and mulching) Sowing Compost
0 675.3 12 24 4.6 23 0 26 78 0-2.5 681 10 12 4.3 30 2 18 50 2.5-0.5 667.8 10 13 5.1 22 4 12 26 0.5-0.75 689.2 46 49 4.34 120 22 67 165 >0.75 658.3 4 3 1.3 15 2 4 15 Total / Average* (Percentage) 682* 82 (24.6%) (30.3%) 101 (SD=2.02) 4.32* (62.8%) 210 (8.9%) 30 (38%) 127 N=334 7
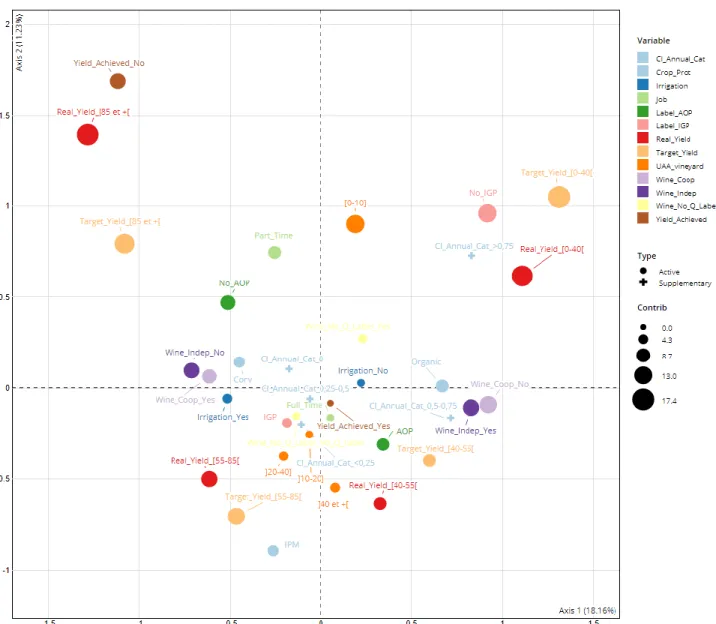
The analysis of the link between farm characteristics and service plant practices was facilitated by MCA, where the first two dimensions explained around one-third of the variability (Fig. 8). Although no clusters were defined for their CI–Dormancy and the service plant destruction method, 3 clusters were defined by the AHC highest inertia gain corresponding to different CI levels for their CI–Annual (SI – Fig. 5). The three clusters are distributed in a parabolic shape, known as the Guttman effect (Cibois, 2014), where (i) the 1st cluster corresponds to individuals represented in the negative second dimension and associated with low CI–Annual (0; 0.25-0.5); (ii) the 2nd cluster to those in the negative first dimension and associated with intermediate CI–Annual (0.25-0.5); and, (iii) the 3rd cluster correspond to those represented positively in the two dimensions and associated with high CI–Annual (>0.5; >0.75). According to Tukey’s range test, CI Annual, CI Dormancy, CI Reproductive and CI Vegetative of cluster 3 are significantly different from the other 2 clusters (SI – Fig. 6).
Figure 8. Multiple correspondence analysis (MCA) of the structural characteristics of the vineyards in our survey. Active variables building MCA appear in circles, with a size proportional to their contribution (Contrib) for the first two axes. Variable names stand for: Crop Protection (Crop_Prot); full-time or part-time winegrower job (Job); presence of AOP label (Label_AOP), IGP label (Label_IGP) or no label (Wine_No_Q_label) at least in some vineyard plots; vineyard size (UAA_vineyard); winemaking in a cooperative (Wine_Coop) or independent (Wine_Indep); categories of real (Real_Yield) and target yield (Target_Yield) in hl/ha; yield achieved or not (Yield_Achieved). Supplementary variables displayed are CI Annual Categories (CI_Annual_Cat) in blue crosses.
The first cluster includes 51 vineyards (15.2%), corresponding to small irrigated vineyards (0-10 ha), seeking to obtain the highest yields yet often unsuccessful at achieving them (Table 3). They had the lowest CI–Annual by practicing a bare soil strategy, through both intensive tillage and herbicide use. The second cluster includes 119 vineyards (35.6%) corresponding to vineyards with a PGI label, high target yield and achieved yields, a relatively big size (20-40 ha), equipped irrigation systems and winemaking in cooperatives. They present an intermediate
CI–Annual (0.25-0.5) managed by a high number of soil tillage operations, mostly leaving service plants during
the Dormancy period. The third cluster includes 164 vineyards (49.1%) and corresponds to vineyards with Organic and PDO labelling (or both), frequently middle sized (10-20 ha), without irrigation systems, a moderate target yield and independent winemaking. They present a high CI–Annual (>0.5; >0.75) and make use of sown plant species. When a service plant is destroyed, they apply a few soil tillage operations (<4). The illustration of active variable ellipses and individuals are presented in SI – Fig 7 and SI – Fig. 8.
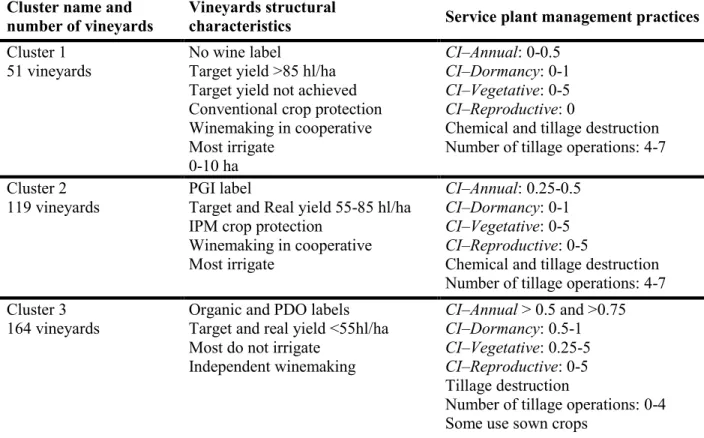
Table 3. Clusters of winegrowers resulting from analyzing vineyard characteristics and service plant practices through Multiple Component Analysis (MCA) and Ascendant Hierarchical Classification (AHC).
Cluster name and
number of vineyards Vineyards structural characteristics Service plant management practices Cluster 1
51 vineyards No wine label Target yield >85 hl/ha Target yield not achieved Conventional crop protection Winemaking in cooperative Most irrigate 0-10 ha CI–Annual: 0-0.5 CI–Dormancy: 0-1 CI–Vegetative: 0-5 CI–Reproductive: 0
Chemical and tillage destruction Number of tillage operations: 4-7
Cluster 2 119 vineyards
PGI label
Target and Real yield 55-85 hl/ha IPM crop protection
Winemaking in cooperative Most irrigate CI–Annual: 0.25-0.5 CI–Dormancy: 0-1 CI–Vegetative: 0-5 CI–Reproductive: 0-5
Chemical and tillage destruction Number of tillage operations: 4-7 Cluster 3
164 vineyards
Organic and PDO labels Target and real yield <55hl/ha Most do not irrigate
Independent winemaking CI–Annual > 0.5 and >0.75 CI–Dormancy: 0.5-1 CI–Vegetative: 0.25-5 CI–Reproductive: 0-5 Tillage destruction
Number of tillage operations: 0-4 Some use sown crops
Among MCA dimensions, only the 1st MCA dimension was significant (p-value < 0.05) and included the following variables: presence or absence of an AOP label (AOP) or an IGP label (IGP); the type of crop protection (Crop_Prot); the target yield (Target_Yield) and the real yield (Real_Yield) ranged in hl/ha (<40; 40-55; 55-85; >85) and the type of winemaking: cooperative (Wine_Coop) or independent (Wine_Indep). Among these variables, the significant variables for estimating the different CI periods were: for CI Annual the type of crop protection (Crop_Prot) and the target yield (Target_Yield) ranged in hl/ha (<40; 40-55; 55-85; >85); for CI
Dormancy the type of crop protection (Crop_Prot) and the real yield (Real_Yield); for the CI Vegetative and for
the CI Reproductive the target yield (Target_Yield) and the presence or absence of an AOP label (AOP). Target yield appeared as the most influential variable over the different CI. Generally, we observed that winegrowers targeting low yields (<40 hl/ha), presented higher CI (Fig. 9). The unachieved yield situations represent only 5.3% of the total survey sample but most of them correspond to high target yields and therefore lower CI.
Figure 9. Percentage of CI–Annual categories of the different target wine yield ranges announced by the winegrowers consulted in the survey.
Dimensions of soil and climate characteristics MCA (soil depth, carbonates degree, stoniness, slope degree, soil texture and rainfall) were not significant to explain any of the CI periods. Although an important soil variability appeared in our surveys, we only observed a small link between higher CI in deep soils (>1m) and lower soil tillage on steep and stony soils (SI – Fig. 9).
Concerning water stress conditions, we evidenced that irrigated and non-irrigated vineyards did not show different CI categories (SI – Fig 10). Furthermore, the dispersion of the CI during dormancy and vegetative and reproductive periods, versus the rainfall of each of those periods did not reveal a correlation between CI and rainfall level in the corresponding period (SI – Fig 11).
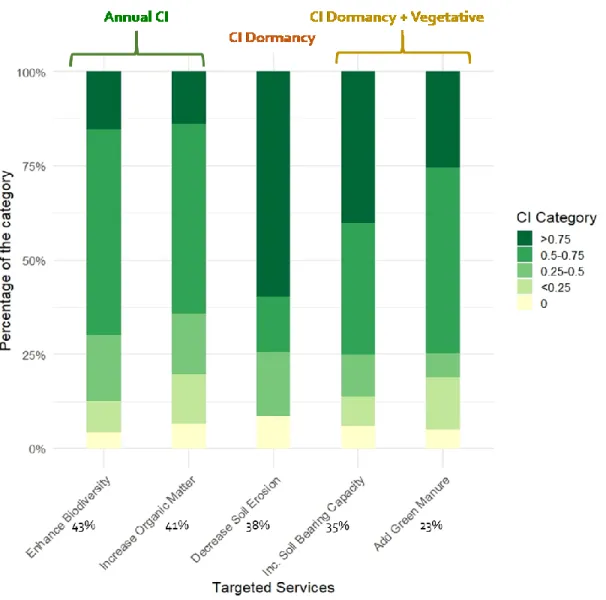
3.3. Target services and disservices by the use of service plants
In our survey, the winegrowers selected one or several target services that motivate their implementation of service plants in their vineyards (SI – Fig. 12). The most chosen services in the survey list were, in order of importance, ‘enhance biodiversity’; ‘increase soil organic matter; ‘decrease soil erosion’; ‘increase soil bearing capacity’; ‘green manure’; ‘cost reduction’; ‘vineyard aesthetics’ and ‘limit nitrate leaching’; with at least 30 responses. However, there was no correlation between vineyard structural characteristics (Table 2a) and services targeted in the survey.
The CI period calculation of the corresponding service targeted was explained in section 2.4. If we compare the top 5 services among them, the higher CI was found in vineyards where winegrowers have targeted to ‘decrease soil erosion’, followed by ‘increase soil bearing capacity’ (Fig. 10). In addition, there was considerable consistency, i.e., winegrowers that have independently selected each of the top 5 target services presented a
significantly higher CI by chi-squared test (p-value < 0.05) in the corresponding period, than the winegrowers who did not select the same target services.
Figure 10. CI categories of the top 5 target services selected by the winegrowers for the purpose of service plants. The CI periods aggregated for each service are presented on the top based on the literature (cf. section 2.4). The percentage of winegrowers targeting the services out of the total survey sample appears below each service. In contrast, winegrowers who did not choose to maintain any service plant were asked about the reasons for not using any service plants. The most important potential disservices of service plants announced were: (i) competition for resources with grapevine and (ii) risk of lowering yields (SI – Fig. 13). Soil constraints, increasing costs, missing equipment and lack of technical knowledge were other important constraints that were cited.
4. Discussion
4.1. A diversity of service plant strategies observed
Our approach was a first attempt to characterize the spatial and temporal dimensions of service plant strategies at the regional scale using a large survey sample of winegrowers (n=331). Our service plant classification based
on both temporal and spatial criteria went further than the classification applied to France by Mailly et al. (2017) and to European regions by Hall et al. (2020). The implementation of temporal and spatial hypothetical designs proposed was verified by the survey answers. During the dormancy period, three out of four winegrowers (75 %) covered all or some vineyard surface and almost half of them (48 %) chose a high surface coverage strategy (CI > 0.75), probably explained by lower weeding costs and no risk of competition with grapevines. However, still one fourth of winegrowers did not cover the soil during this period, increasing the risk of soil erosion (Guzmán et al., 2019). The analysis of spatial designs evidenced that the size of the surface area covered decreased significantly between dormancy and vegetative periods, probably influenced by a risk of competition for resources, as explained by Celette and Gary (2013). During the grapevine vegetative and reproductive periods, the diversity of surface coverage strategies was remarkable, both at the spatial and temporal levels. The surface covered decreased significantly from dormancy to vegetative periods and the spatial design chosen was one-every-two inter rows for almost half of the winegrowers.
The service plant spatial design also depends on the farming machinery available (Cloutier et al., 2007; Ingels, 1998; Merot and Wery, 2017). To till the inter-rows, a wide range of equipment exists, namely cultivators, harrows, etc. Row destruction and inter-row cover were quite widespread, frequently chosen by winegrowers using herbicides on the row. When converted to organic, the mechanical destruction of the row can be performed using specific under-vine weeding machines (Merot et al., 2019). Although these specific types of machines need a considerable economic investment, winegrowers generally acquire them since they prefer not to use service plants on the row, assuming the balance between services and disservices will be less attractive. However, in wetter years, service plants in the rows may be a competitive alternative to herbicides (Karl et al., 2016) that may help to reduce excessive vigor (Chou and Heuvel, 2019).
We observed a large majority of spontaneous vegetation use in the strategies. Despite the fact that spontaneous vegetation may present a lower biomass production and slower soil coverage than sown species (Pardini et al., 2002; Ruiz-Colmenero et al., 2011; Steenwerth et al., 2010), it is frequently chosen since it embodies a cheaper intercropping option (Kazakou et al., 2016) without the need of specific seeds or technical knowledge. The predominance of spontaneous vegetation strategies seen in our sample confirmed the need for developing an analysis of the surface and temporality of each strategy through the Coverage Index (CI).
4.2. Usefulness of the Coverage Index for characterizing, analyzing and managing service plant strategies
The measurement of service plant practices through the Coverage Index (CI) was useful to understand the degree of service plant implementation among diversified management practices of a large sample. It helped us to compare the service plant strategies with the structural characteristics, with soil and water variables and with the services targeted by winegrowers. Nevertheless, the CI presents some limitations since it does not take into consideration: (i) the degree of crop growth after control operations (mowing and rolling); or (ii) the type and physiological state of plant species (often senescent after high summer temperatures). The CI merely provides information about the fact that the spontaneous or sown vegetation has not been destroyed by soil tillage or herbicide use. Therefore, the CI suggests that there is good reason note if there is some kind of vegetation rather than a bare soil, since some support services are provided (Steenwerth et al., 2010) and vegetation growth can easily be revived.
In future studies, the calculation of the CI can help to develop agri-environmental assessments of the use of service plants at the regional scale. In the same way as the Treatment Frequency Index (TFI) measures phytosanitary product use in agriculture, the CI enables standardization of service plant strategies and their comparison along different key periods. The consistency of the farming practices for achieving a specific service can be assessed, for instance, by analyzing the CI during rainfall periods to avoid soil erosion in the region. Besides, label certifiers and public policy makers may be interested in CI as a measurement for scoring the degree of service plants used among a panel of producers, either for winegrowers or farmers with other perennial crops.
4.3 Wine labelling and lower target yields drive the CI
As developed by Ripoche et al. (2010, 2011), service plant strategies are chosen through a complex integration of winegrower target services, soil resources, label constraints, climatic conditions, material and labor availability. Contrary to our hypothesis based on the analysis of the literature (Fourie et al., 2007; Gaudin and Gary, 2012; Salomé et al., 2016), soil features and water resources (irrigation and rainfall) did not seem to influence the service plant strategies measured through the CI. These results support the analysis done by Winter et al. (2018) showing that rainfed vineyards presented a significantly higher use of service plants. In our study, most of the irrigated vineyards also corresponded to vineyards with high production objectives limiting the risk of yield losses.
Our results pointed out a greater use of service plants and a corresponding higher CI in Organic and PDO labelled vineyards targeting low wine yields. These results confirmed the importance of the added value of producing high quality wine, and environmental concerns of winegrowers to conceive and implement service plant strategies, as other studies evidenced (Marques et al., 2015; Schütte and Bergmann, 2019). Correlation between PDO and lower yields is not surprising since most PDO in Languedoc-Roussillon restrict wine yield to 50 hl/ha, compared to 70-90 hl/ha in PGI labels (BO-AGRI, 2015, 2014). Higher CI in organic vineyards, where herbicides are not allowed, could be linked to the higher cost of mechanical destruction. In addition, the risk of yield losses appeared to be more critical for conventional, irrigated, PGI vineyards targeting high yields and therefore choosing a bare soil. However, some studies do not show the expected decline in grape yields (e.g., Ruiz-Colmenero et al., 2011; Tesic et al., 2007) but similar or even higher yields in vineyards with service plants in the inter‐rows (Mercenaro et al., 2014; Sweet and Schreiner, 2010). Independently from yield and growth reduction due to service plant use, some vineyards may present overall profitability by reducing soil tillage costs and associated operations like fruit thinning and leaf pulling (Guerra and Steenwerth, 2012).
Our results highlight the consistency of the strategies measured by the CI with the target services during dormancy and vegetative periods, in particular for enhancing biodiversity and preserving soil from erosion. Winegrowers aiming to increase soil bearing capacity were numerous, mainly motivated for preventing soil compaction caused by engines performing phytosanitary treatments in spring (Biarnès et al., 2004; Bogunovic et al., 2017; Polge de Combret‐Champart et al., 2013). Several services are compatible and therefore were targeted at the same service plant period. However, a destruction of the service plant is necessary when using a green manure strategy for nutrient release and a mulch effect for soil evaporation mitigation when enough biomass is produced (Ranaivoson et al., 2017). In addition, the maximization of services performed annually (i.e., enhance biodiversity; increase soil organic matter) may be harder to ensure due to possible disservices between the service plant and grapevines during water stress periods.
4.4. Strengths and limitations of such a regional analysis
As other studies showed (Goulet and Morlat, 2011), the use of surveys has been proved to be a relevant tool to perform a regional study of service plant strategies. The survey sample was representative of the current winegrower population in Languedoc Roussillon, despite a slight over-representation of high-quality PDO labels and irrigated vineyards. Our questionnaire addressed a large number of issues, including vineyard structure; soil conditions; compost practices; service plant spatial design, service plant management practices and indicators guiding decision-making. However, several other issues could have been addressed by the questionnaire, such as the plantation framework for improving CI calculation, as alley width can play an important role in the weed control choices (Biarnès et al., 2009). A better characterization of the service plant strategy by group of similar plots instead of the whole vineyard will help to understand the trade-off between services and disservices for more precise water and soil conditions. Similarly to what Neethling et al. (2017) revealed, most strategies of vineyard adaptation to climate effects are primarily reactive or anticipatory to short-term climate conditions. Besides, enquiring about the level of knowhow and the material and labor availability could help to better understand winegrower’s decision-making to choose certain control and destruction methods. Most questions of
the online survey were closed, increasing the participation rate but possibly creating a bias when options were not specific enough (Zhou et al., 2017). This is particularly the case for the most common target service (‘enhance biodiversity’) hinting at different scales, namely the soil, the plant, the plot, the vineyard and the landscape biodiversity.
In our survey, we did not consider the winegrower’s application for public subsidies supporting the use of service plants. In France, service plant support is provided through subsidies obtained from AECM
(‘Agri-Environment-Climate Measures’) of the European Common Agricultural Policy (DRAAF Occitanie, 2018). Considering
AECM applications by each winegrower will be useful to understand how this financial support modifies their service plant strategies. Garini et al., (2017) showed that winegrowers adopt agroecological practices mainly because of autonomous choices rather than monetary coercion, encouraging policy-makers to promote autonomy-supportive policies that foster farmers’ motivations. Allocating public or private coercing measures to foster service plant strategies targeting multiple services and minimizing most disservices seems possible, especially by promoting winter and semi-permanent strategies with full or partial coverage. In addition, these subsidies can be adapted according to the temporality and the spatial coverage using the CI.
5. Conclusion
Our study confirmed the existence of a substantial margin of maneuver for the development of different service plant strategies within a region. Spontaneous service plant strategies presented a high spatial and temporal diversity. Overall, the spectrum of the strategies found ranged from a “basic” use of spontaneous vegetation in winter to a complex use of sown plant species for targeted services such as nutrient fixation, increasing soil organic matter or pest repellence. These strategies can be measured by calculating the Coverage Index (CI) for each vineyard. We found that higher CI was linked to quality labels, organic crop protection and low target yields. In contrast, no link was found between CI and water and soil resources in vineyards. We also verified that target services by winegrowers are consistent with the CI of the strategy chosen.
This study presented and described a Coverage Index in vineyards that can be useful for agronomic advisors, providing a crucial piece in the puzzle of innovative cropping system design in perennial crops. Furthermore, we evidenced how the calculation of the Coverage Index can help the monitoring of service plant implementation at a regional scale and provided some insights for the assessment of the service plant strategies and its eventual integration in agroecological policies and labels.
Acknowledgments
We thank Elaine Bonnier (Montpellier SupAgro) for improving the English writing of the manuscript and Yvan Bouisson for his pictures.
6. References
Agence Bio, 2017. Observatoire de l’agriculture biologique du Languedoc Roussillon. Sud et Bio. Consulted on
3rd April 2019:
https://www.sud-et-bio.com/sites/default/files/Chiffrescles2015_Bio_LR_Edition2016_BasseDef5.pdf.
Agreste, 2018. Analyse et études Occitanie - Numéro 5 - Janvier 2018 - http://draaf.occitanie.agriculture.gouv.fr/IMG/pdf/l_irrigation_contribue_a_18_de_la_valeur_de_la_pr oduction_agricole_cle41fb9d.pdf.
Agreste, 2017. Pratiques culturales en viticulture pour la Campagne 2013. Numéro 243. Consulted online the 4th of April 2019: http://agreste.agriculture.gouv.fr/IMG/pdf/cd243bsva.pdf.
Agreste, 2013. Recensement Agricole 2010. Consulted the 28 April of 2019 on: http://agreste.agriculture.gouv.fr/page-d-accueil/article/agreste-donnees-en-ligne.
Alonso-Ayuso, M., Gabriel, J.L., Hontoria, C., Ibáñez, M.Á., Quemada, M., 2020. The cover crop termination choice to designing sustainable cropping systems. Eur. J. Agron. 114, 126000.
Barnier, J., 2020. R CRAN package “explor”: Interactive Interfaces for Results Exploration. https://CRAN.R-project.org/package=explor.
Biarnès, A., Bailly, J.-S., Boissieux, Y., 2009. Identifying indicators of the spatial variation of agricultural practices by a tree partitioning method: The case of weed control practices in a vine growing catchment. Agric. Syst. 99, 105–116.
Biarnès, A., Coulouma, G., Compagnone, C., 2012. Unexpected predominance of wine grower location over soil trafficability for vine management in southern France. Agron. Sustain. Dev. 32, 661–671.
Biarnès, A., Rio, P., Hocheux, A., 2004. Analyzing the determinants of spatial distribution of weed control practices in a Languedoc vineyard catchment.
BO-AGRI, 2015. Cahier de charges de l’Indication Géographique Protégée « Paysd d’Oc ». Consulted online the 15th November 2019 : https://info.agriculture.gouv.fr/gedei/site/bo-agri/document_administratif-457779fa-8faa-4752-8266-afff941d0f1a/telechargement.
BO-AGRI, 2014. Cahier des charges de l’appellation d’origine contrôlée « LANGUEDOC » Consulted online the 15th November 2019 : https://info.agriculture.gouv.fr/gedei/site/bo-agri/document_administratif-b2890033-0d28-4036-a002-332a71ac678e/telechargement.
Bogunovic, I., Bilandzija, D., Andabaka, Z., Stupic, D., Comino, J.R., Cacic, M., Brezinscak, L., Maletic, E., Pereira, P., 2017. Soil compaction under different management practices in a Croatian vineyard. Arab. J. Geosci. 10, 340.
Bordelon, B.P., Weller, S.C., 1997. Preplant cover crops affect weed and vine growth in first-year vineyards. HortScience 32, 1040–1043.
Borsato, E., Zucchinelli, M., D’Ammaro, D., Giubilato, E., Zabeo, A., Criscione, P., Pizzol, L., Cohen, Y., Tarolli, P., Lamastra, L., 2020. Use of multiple indicators to compare sustainability performance of organic vs conventional vineyard management. Sci. Total Environ. 711, 135081.
Celette, F., Gary, C., 2013. Dynamics of water and nitrogen stress along the grapevine cycle as affected by cover cropping. Eur. J. Agron. 45, 142–152.
Celette, F., Ripoche, A., Gary, C., 2010. WaLIS—A simple model to simulate water partitioning in a crop association: The example of an intercropped vineyard. Agric. Water Manag. 97, 1749–1759.
Cerdan, O., Govers, G., Le Bissonnais, Y., Van Oost, K., Poesen, J., Saby, N., Gobin, A., Vacca, A., Quinton, J., Auerswald, K., 2010. Rates and spatial variations of soil erosion in Europe: a study based on erosion plot data. Geomorphology 122, 167–177.
Chou, M.-Y., Heuvel, J.E.V., 2019. Annual Under-Vine Cover Crops Mitigate Vine Vigor in a Mature and Vigorous Cabernet franc Vineyard. Am. J. Enol. Vitic. 70, 98–108.
Cibois, P., 2014. Les méthodes d’analyse d’enquêtes. ENS éditions.
Cibois, P., 1997. « Les pièges de l’analyse des correspondances », Histoire & Mesure, 12 (3/4), pp. 299-320. Cloutier, D., Van der Weide, R., Peruzzi, A., Leblanc, M., 2007. Mechanical weed management. Non-Chem.
Weed Manag. Oxfs. UK CAB Int. 111–134.
Coll, P., 2011. Qualité des sols viticoles en Languedoc Roussillon: effets des pratiques.
Daane, K.M., Hogg, B.N., Wilson, H., Yokota, G.Y., 2018. Native grass ground covers provide multiple ecosystem services in Californian vineyards. J. Appl. Ecol. 55, 2473–2483.