HAL Id: hal-02098546
https://hal.archives-ouvertes.fr/hal-02098546
Submitted on 16 Oct 2020
HAL is a multi-disciplinary open access
archive for the deposit and dissemination of
sci-entific research documents, whether they are
pub-lished or not. The documents may come from
teaching and research institutions in France or
abroad, or from public or private research centers.
L’archive ouverte pluridisciplinaire HAL, est
destinée au dépôt et à la diffusion de documents
scientifiques de niveau recherche, publiés ou non,
émanant des établissements d’enseignement et de
recherche français ou étrangers, des laboratoires
publics ou privés.
Properties, structure and crystallization study of
germano-gallate glasses in the Ga2O3-GeO2-BaO-K2O
system
Téa Skopak, Florian Calzavara, Yannick Ledemi, F. Celarie, Mathieu Allix,
Emmanuel Véron, Marc Dussauze, Thierry Cardinal, Evelyne Fargin, Younès
Messaddeq
To cite this version:
Téa Skopak, Florian Calzavara, Yannick Ledemi, F. Celarie, Mathieu Allix, et al.. Properties, structure
and crystallization study of germano-gallate glasses in the Ga2O3-GeO2-BaO-K2O system. Journal
of Non-Crystalline Solids, Elsevier, 2019, 514, pp.98-107. �10.1016/j.jnoncrysol.2019.02.028�.
�hal-02098546�
Properties, structure and crystallization study of germano-gallate glasses in
the Ga
2O
3-GeO
2-BaO-K
2O system
T. Skopaka,b,c, F. Calzavaraa,c, Y. Ledemia,c, F. Célariéd, M. Allixe, E. Vérone, M. Dussauzea,f, T. Cardinala,b, E. Fargina,b,⁎, Y. Messaddeqa,c
a
International Associated Laboratory (LIA) LuMAQ, CNRS, Université de Bordeaux, ICMCB, CELIA, ISM & Université Laval, COPL & INRS, France
b
Institut de Chimie de la Matière Condensée de Bordeaux, ICMCB, CNRS, Université de Bordeaux, Bordeaux, France
c
Centre d'Optique, Photonique et Laser, COPL, Université Laval, Québec, QC, Canada
d
Institut de Physique de Rennes, Université de Rennes 1, Rennes, UMR CNRS, 6251, France
e
Conditions Extrêmes et Matériaux : Hautes Températures et Irradiation, CEMHTI, CNRS, Université d'Orléans, Orléans, France
f
Institut des Sciences Moléculaires, ISM, Université de Bordeaux, Bordeaux, France
⁎ Corresponding author at: International Associated Laboratory (LIA) LuMAQ, CNRS, Université de Bordeaux, ICMCB, CELIA, ISM & Université Laval, COPL & INRS,
France / E-mail address: evelyne.fargin@icmcb.cnrs.fr (E. Fargin).
Abstract : Mid-infrared transparent germano-gallate glasses (with gallium oxide as main component) have been studied
following the composition law (100-x)[48.3GaO3/2-32.2GeO2-19.5BaO]-xKO1/2 (with x = 0, 5, 10, 13, 17 mol%). All prepared glasses are transparent from approximately 280 nm up to 5.5 μm, with a measured linear refractive index and density decreasing respectively from 1.72 to 1.67 (at 1538 nm) and 4.79 to 4.34 g/cm3 with increasing potassium oxide content. As expected, the increase of potassium oxide content also results in a decrease of the glass transition temperature (698 to 671 °C) and the viscosity in the softening regime whereas the thermal expansion coefficient increases (4.8 to 10.3 × 10⁻⁶ K−1). These results are related to the depolymerization of the 3D interconnected glass network which has been studied by Raman spectroscopy. Large thermal stability criteria (difference between onset of crystallization and glass transition temperatures) ranging from 182 to 199 °C have been measured by DSC for the compositions containing potassium oxide, suggesting strong potential for fiber drawing from glass preforms. The 40.1GaO3/2-26.7GeO2-16.2BaO-17KO1/2 glass composition (in cation mol.%, which corresponds to 28Ga2O3 -37GeO2-23BaO-12K2O in mol.%) was then selected for further investigation. Its mechanical properties (Young and shear moduli, Poisson's ratio, hardness) were measured, showing values close to those reported for well-known barium gallo-germanate (BGG) glasses. A thorough crystallization study was then carried out using DSC (Marotta's method), X-Ray diffraction and electron microscopies (TEM and SEM) to better understand the unexpected surface crystallization issues observed during the glass preform fiber drawing process. The potential of using such germano-gallate glasses to produce mid-infrared optical fiber of high mechanical strength is discussed.
1. Introduction
The development of optical materials transmitting in the mid-infrared region up to 5 μm is of first interest for many applications in defense and security, health and environment, for instance [1]. Most of the pollutant molecules' fingerprint are indeed located in this spectral region [2], whereas it also includes the second band of the atmospheric transmission window (3–5 μm). Among them, vitreous materials like chalcogenide, fluoride or tellurite glasses are widely studied for their infrared transmission and also their relatively low-cost manufacturing, ease of shaping, optics molding or fiber drawing, by opposition to crystalline materials (e.g. Ge single-crystal, sapphire, etc.). However, chalcogenide, fluoride and tellurite glass-based optics and fibers, despite their unique infrared optical properties, possess relatively poor chemical, thermal and/or mechanical resistance as well as long-term chemical durability that strongly limit their utilization in a large number of practical applications. Remarkably, germanate glasses, whose main constituent is the glass-former germanium dioxide GeO2, are recognized for their superior mechanical, chemical and thermal resistance that has permitted their implementation in specific applications where materials robustness is critical. One can cite for instance the BaO-Ga2O3-GeO2 (so-called BGG) glass windows developed by the US Naval Research Laboratory for defense applications [[3], [4], [5], [6], [7]]. The other well-known GeO2-based glass system is the lead-germanium oxide GeO2-PbO whose optical fibers transmitting up to 3 μm are commercially available for dentistry or laser surgery applications [8,9].
Gallate glasses, whose infrared transparency is expected to be close to that of germanate glasses because of the close phonon energy of Ga O and Ge O bonds (~500 cm−1), may offer an interesting alternative to the above cited systems in terms of higher rare-earth ions solubility and polarizability, for example. Gallium oxide is an intermediate oxide acting similarly to alumina in silicate glasses. It can either be a network modifier in silicate [10] or germanate [11,12] glasses or a network former or co-former in gallate, germano-gallate or gallo-phosphate glasses for instance [[13], [14], [15]]. Relatively few studies have been reported on glasses having gallium oxide as principal glass component [12,13,[15], [16], [17], [18], [19], [20], [21]], even though they may show good optical, mechanical and thermal properties for potential application from the visible to the mid-infrared (mid-IR) range. For better readability, a particular glass denomination formalism should be proposed to distinguish properly gallate glasses from gallate-based glasses. On one hand, gallate glass should stand only for glass compositions containing gallium oxide as single network former. On
the other hand, when two network co-formers are involved, like in germano-gallate or gallio-silicate glasses for example, both network formers should be mentioned with the second term corresponding to the major glass constituent.
To the best of our knowledge, there is no report in the literature of successful fabrication glass optical fiber from gallate glasses or any other glasses with gallium oxide as main constituent (like germano-gallate), despite the large thermal stability against crystallization that may be observed for some compositions. Gallio-silicate glass-ceramics fibers and lead-bismuth-gallium oxide glass photonic crystal fibers have been reported by Pinckney et al. [22] and by Buczynski et al. [23], respectively. But in neither case gallium oxide is the glass main component. In our previous works, GaO3/2-GeO2-NaO1/2 germano-gallate glasses have been investigated [24,25]. A thermal stability against crystallization criterion (difference between onset of crystallization and glass transition temperatures) well-above 120 °C was measured for several glass compositions, suggesting a strong potential for glass thermal shaping, including fiber drawing. However, unwanted crystallization was observed during glass thermal processing, probably related to the mobility of sodium cations at high temperature. In this work, sodium oxide has been replaced by potassium and barium oxides. Germano-gallate glasses (100-x)[48.3GaO3/2-32.2GeO2-19.5BaO]-xKO1/2 with x = 0, 5, 10, 13, 17 mol% have been studied in order to evaluate their potential for further bulk and/or fiber applications from the visible to mid-IR range. Their thermal stability, transmission window, refractive index, viscosity, linear thermal expansion coefficient, and glass structure by Raman spectroscopy are investigated. Finally, a thorough crystallization study relying on thermal analysis and electron microscopies is carried out on the most promising germano-gallate glass composition for future fiber drawing potential testing.
2. Experimental details
2.1. Glass synthesis
The glass samples were prepared by traditional melt and quenching technique according to the composition law (100-x)[48.3GaO3/2 -32.2GeO2-19.5BaO]-xKO1/2 with x = 0, 5, 10, 13, 17 mol%. The starting materials used were gallium oxide Ga2O3 (Strem Chemical, 99.99%), germanium oxide GeO2 (Strem Chemical, 99.999%), barium carbonate BaCO3 (ACS Merck, 99%) and potassium carbonate K2CO3 (Sigma Aldrich, 99%). After weighing, the powders were intimately mixed and placed in a platinum crucible for a pre-sintering treatment at 1200 °C for 1 h30 and then melted under ambient atmosphere at 1300–1400 °C for 30 min. The melted mixtures (up to 30 g) were then quenched in the ambient air before being ground. Small glass pieces were taken from each composition prepared to carry out DSC analysis to determine their corresponding glass transition temperature Tg. Then the remaining glass powders were melted a second time in order to increase their homogeneity. The resulting glasses were finally annealed at Tg −40 °C for 4 h and slowly cooled down to room temperature. All the resulting glasses were colorless, transparent and bubble free. Samples of different sizes and shapes, including glass rods of 10 mm diameter and 40 mm length, were produced. Glass slices of thickness ranging from 1 to 8 mm were then cut and polished on both parallel faces for further characterizations.
2.2. Thermal, physical and structural characterizations
The nominal stoichiometry was verified by quantitative microanalysis (Wavelength Dispersive Spectroscopy (WDS)) with an Electron Microprobe Cameca SX 100, with a deviation of ±2 mol%. The amorphous state of the samples was verified by Powder X-ray diffraction (XRD) patterns which were collected on a PANalitycal X'pert PRO MPD diffractometer used in a Bragg-Brentano θ-θ geometry and equipped with a secondary monochromator and X'Celerator multi-strip detector. Each measurement was performed within an angular range of 2θ = 8–80°. The Cu-Kα radiation was generated at 45 kV and 40 mA (λ = 1.5406 Å). XRD was also used to identify the crystalline phases formed during the crystallization study.
The density, ρ, was obtained from the average of two measurements per sample by Archimedes' method by immerging a glass chunk in diethyl phthalate at room temperature on a Precisa XT 220A weighing scale with an estimated error of 0.005 g/cm3.
Thermal properties which include the glass transition temperature (Tg), the onset of crystallization (Tx) and the maximum of crystallization (Tc) were measured on a Netzsch DSC Pegasus 404 F3 apparatus with glass chunks in a Pt pan at a heating rate of 10 °C/min with a precision of ±2 °C. The thermal stability (ΔT = Tx − Tg) was also calculated. The crystallization was also investigated more specifically on a selected glass composition by using the DSC method from Marotta [26]. More details about the used method are given in Section 3.4.2.
The linear thermal expansion coefficient (TEC) was determined by thermal mechanical analysis (TMA) on a Netzsch TMA 402 F1 between 25 and 750 °C with a heating rate of 5 °C/min. Silica spacers were used on cylindrical samples of 5 to 8 mm height with a 5 mm diameter. The linear TEC was determined for each composition from the slope of the TMA signal between 30 and 300 °C. The dilatometric glass transition temperature (Tgd) and the dilatometric softening point (Td) were determined as well. The viscosity in the interval of 1010 to 107 Poise was recorded on a Theta US parallel plate viscometer, on 10 mm diameter and 6 to 8 mm height cylindrical samples placed between two silica spacers. The samples, under a 300 g charge, were heated up to 650 °C with a heating
rate of 4 °C/min and then up to 795 °C with a heating rate of 2 °C/min. The potential fiber drawing temperature was estimated for a viscosity of 107 Poise by a simple linear extrapolation of the viscosity curve with an approximated error of ±5 °C. In this approach, we assumed a linear behavior of the viscosity-temperature curve in this regime of viscosity, which was found to be an acceptable approximation in anterior works by Galstyan et al. [27]. Nonetheless, it is worth noting that the Vogel-Fulcher-Tammann and Avramov-Milchev equations are generally employed to account for the viscosity evolution of glassy materials as a function of temperature [28,29].
The refractive index was measured by prism coupling on a M-line 2010/M Metricon apparatus at 532, 633, 972, 1308 and 1538 nm with an estimated error of ±0.005. The transmission spectra in the UV-Visible-NIR and the IR ranges were respectively obtained from Agilent Cary 5000 (UV-Visible-NIR) and Bruker Equinox 55 (FTIR) spectrometers. The short wavelength cut-off (λUV) and the multiphonon cut-off (λIR) were determined from the recorded spectra using the Beer-Lambert law for an absorption coefficient of 10 cm−1.
Regarding the mechanical properties, the Young's modulus (E), shear modulus (G) and Poisson's ratio (νpoisson) were estimated from the average of 4 measurements by ultrasound echography with a JSR Ultrasonics DPR300 pulser/receiver on two cylindrical samples of 1.1 cm height and 1 cm diameter at room temperature using 10 MHz piezoelectric transducers. The elastic modulus are given by the formula (in agreement with the ASTM E494 - 15 procedure):
where Vl and Vt are the longitudinal and transversal wave speeds. The Meyer's hardness (HM) measurements were obtained from 10 indentations at 250 mN and 10 indentations at 1 N with an Instrumented Vickers diamond indenter setup (Fischerscope H100C) on the samples used for the ultrasound echography. These measurements were carried out with a 20 s increase in charge followed by a hold at maximum force (250 mN and 1 N) for 5 s before releasing the charge. Note that these mechanical characterizations were carried out only on the glass composition selected as the best candidate for future glass fiber drawing potential.
The Raman spectra were obtained using a Horiba Jobin-Yvon XploRA Raman spectrometer with a spectral resolution of 2 cm−1, equipped with a 532 nm laser and a confocal microscope objective (x 50). The obtained spectra were normalized at their main peak intensity around 500 cm−1.
Samples for transmission electron microscopy (TEM) were prepared from powder dispersed in absolute ethanol, and deposited onto a holey carbon film supported by a copper grid. Bright field images were carried out with a TEM (Philips CM20) operating at 200 kV and equipped with an Oxford energy dispersive spectrometry (EDS) analyzer. Scanning electron microscopy (SEM) was carried out with a Philips ESEM XL40 apparatus equipped with an Oxford EDX detector for elementary analysis. Samples were observed and analyzed by SEM under high vacuum. To prevent the accumulation of electrostatic charge, an ultrathin coating of carbon was deposited on the glass sample surface.
3. Results and discussion
3.1. Physical-chemical properties of the GGBKx glasses
The different nominal compositions (100-x)[48.3GaO3/2-32.2GeO2-19.5BaO]-xKO1/2 with x = 0, 5, 10, 13 and 17 mol%, labelled GGBKx, are reported in Table 1 along with the experimental glass compositions obtained by WDS quantitative analysis. The experimental (K + 2Ba)/Ga molar ratio, corresponding to the (KO1/2 + 2·BaO)/GaO3/2 M ratio, represents the ratio between the amount of alkali ions charges and the amount of gallium and is reported for each composition in Table 1. The nominal stoichiometry of the mixtures appears to be maintained during glass synthesis and the (K + 2Ba)/Ga ratio increases from 0.81 (for the GGBK0 glass) up to 1.23 (for the GGBK17 glass).
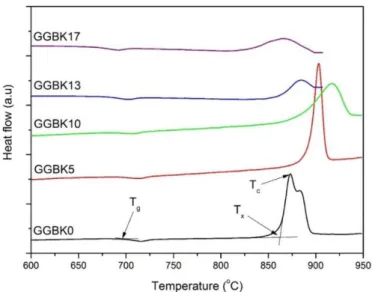
Regarding the thermal properties, the onset of glass transition temperature Tg and the onset of crystallization temperature Tx were determined from the DSC trace from the tangents crossing, as depicted in Fig. 1. The maximum of crystallization temperature Tc, as well as the calculated thermal stability against the crystallization ΔT = Tx − Tg, were also determined by DSC and are listed in
Table 2 whereas the thermograms are presented in Fig. 1. On can note an expected decrease of Tg with the addition of potassium
oxide due to the depolymerization impact of the modifier oxides addition in the glass network. The thermal stability, which is considered as an indicator of potential formability of glasses regarding bulk shaping or fiber drawing, is above 150 °C for all glass compositions and does not show significant variations with the addition of KO1/2. Moreover, one can note on the thermograms shown in Fig. 1 that the crystallization peak shape is evolving from a two-component intense and narrow peak (GGBK0) toward a broadened and weak peak for the GGBK13 and GGBK17 glasses. This behavior, resulting from the addition of potassium oxide into the GGB vitreous network, can be considered as favorable for further fiber drawing experiments. It is indeed preferable to avoid a sharp and intense crystallization peak to maximize the temperature working range for possible thermal shaping.
The measured density of the glasses is given in Table 2, showing a rapid decrease with the addition of KO1/2 from 0 to 10 mol% and then a slower decrease from 10 to 17 mol% of KO1/2. This result can be readily explained by the lower molar weight of KO1/2 vs the other glass constituents.
The TMA curves of the GGBKx glasses are presented in Fig. 2 whereas the linear thermal expansion coefficient (TEC, determined from the curve slope between 30 and 300 °C), the dilatometric glass transition temperature (Tgd, determined from the tangents crossing as depicted in Fig. 2) and the dilatometric softening point (Td, determined from the maximum dilatation point as depicted
in Fig. 2) are reported in Table 2.
The addition of KO1/2 implies an increase in the linear coefficient of thermal expansion, which confirms the role of the potassium oxide on the depolymerization of the network, thus leading to an increase of the TEC. Tgd decreases when KO1/2 is added, in accordance with the DSC results presented in Fig. 1. A 20 °C difference between the two Tg measurements is noticed, ascribed to distinct measurement methods and heating rates used, i.e. calorimetric with the DSC run at 10 °C/min and dilatometric with the TMA run at 5 °C/min.
The evolution of viscosity as a function of temperature of the GGBKx glass samples is presented in Fig. 3 whereas Table 2 reports the estimated fiber drawing temperature (Tfib). The glass viscosity is decreasing as the potassium oxide content increases, as well as the potential fiber drawing temperature. These Tfib temperatures remain lower than the onset of crystallization temperature Tx determined by DSC.
The transmission spectra of the GGBKx glass samples recorded in the short wavelength region (from 250 to 500 nm) are presented
in Fig. 4a. The artefact observed at 350 nm corresponds to the source change during the spectrum acquisition. The full transmission
spectrum of the GGBK17 glass sample is shown in Fig. 4b. Similar transmission spectra were recorded for all studied samples. One can notice a strong absorption band around 3 μm related to the presence of OH groups in the glass, which was expected as no special
care was taken during glass synthesis here. Various methods have been proposed in the literature to eliminate water from the starting materials and the produced glasses, resulting in a strong decrease of intensity of this band [6]. Then, one can observe in Fig. 4b that the short wavelength band-edge of the GGBK17 glass is located around 300 nm whereas its multiphonon band-edge is located around 5.5–6 μm. The same broad transmission window was observed on all the samples and is similar to that reported in BGG glasses [6]. Furthermore, as one can see from Fig. 4a and from the calculation of the short wavelength cut-off λUV of each glass composition for a given linear absorption coefficient of 10 cm−1, a small decrease from 293 to 277 nm with increasing the potassium content in the glass is observed (i.e. from GGBK0 to GGBK17). It is however difficult to explain this slight increase of the glass optical bandgap from the chemical composition evolution. Many aspects must indeed be taken into account (e.g. presence of non-bridging oxygens, transition metals impurities, etc.). It is worth reminding here that the barium and potassium carbonate precursors used here were only of 99% purity. Moreover, no effect of the glass composition was observed on their multiphonon wavelength cut-off, determined at λIR = 5.9 μm (for a given linear absorption coefficient of 10 cm−1) for all samples. Again, such a result was expected considering that the infrared band-edge is governed by the phonon energy of the vitreous network built on gallium and germanium oxides. The increasing concentration of barium and potassium oxide modifiers in the network (from 19.5 to 33.2 mol% in GGBK0 and GGBK17, respectively) is not sufficient to significantly change its multiphonon energy.
The refractive indices of the GGBKx glasses measured at five wavelengths in the visible and near-infrared ranges are plotted as a function of their potassium oxide content in Fig. 5. A monotonous decrease of the refractive index is observed at all wavelengths when increasing the potassium oxide in the glass. For instance, at 532 nm, the measured refractive index decreases from 1.754 (GGBK0) to 1.701 (GGBK17), which is consistent with the decrease of glass density reported in Table 2.
With respect to the mechanical properties, only the GGBK17 glass sample was characterized (as it corresponds to the selected composition for further fiber drawing and crystallization studies, see Section 3.4.1). Its measured Young's modulus, shear modulus, Poisson's ratio and hardness are E = 62 ± 1 GPa, G = 24.4 ± 0.5 GPa, νpoisson = 0.285 ± 0.002 and HM = 5.54 ± 0.05 GPa, respectively. These results will be discussed in Section 3.3.
3.2. Structural study
The Raman spectra were recorded on all the glass samples and are presented in Fig. 6. One can note, for all glasses, a principal band with a maximum at around 500 cm−1 and a broad band between 700 and 900 cm−1. The addition of potassium oxide induces a shift toward lower frequencies for both bands. The latest also shows an increase of its relative intensity. The spectra are similar to the ones observed for the gallium-rich GaO3/2-GeO2-NaO1/2 glasses studied in our previous work [24,25].
The presence of a 3D interconnected network made of connected tetrahedral XO4 units (X = Ga or Ge) can be associated to the vibrations observed at 500 cm−1. One can note that due to the similar mass of gallium and germanium, their signature cannot be distinguished by Raman spectroscopy. The shift in frequencies of the band at 500 cm−1 marks a modification of the X – O – X (X = Ga or Ge) bonds within the network. In fact, the glasses GGBK0 and GGBK5, which present a (K + 2Ba)/Ga ratio of respectively 0.81 and 0.92, cannot have a full charge compensation of the entire [GaO4]− tetrahedral units. As observed for the gallium-rich glasses in the GaO3/2-GeO2-NaO1/2 system [24,25], one can assume that some of the gallium cations, which do not find a charge compensation in tetrahedral units, may be inserted in highly coordinated gallium sites (either 5 or 6 coordination numbers) which do not require a charge compensation and the presence of a neighboring alkali. The highly coordinated gallium sites may as well generate connection by the edges or faces, leading to an increase of the Ga – O – Ga bond's strengthening. In the same time, there is creation of gallate units in 4-fold coordination having a full compensation of charge that are inserted within annular structures made of [GeO4] and [GaO4]− units, as observed in GaO3/2-GeO2-BaO glasses. This leads to the two components centered around 750 and 850 cm−1 in the broad 700–900 cm−1 band [30]. Once the ratio (K + 2Ba)/Ga is above unity, all the gallium tetrahedral oxygenated sites can be charge balanced and the creation of new Q3 (i.e. having 3 bridging oxygens) GeO
4 units can occur from the excess of alkali ions, which leads to a third component of vibration located around 800 cm−1. One can also note that this system presents two types of alkali ions (Ba2+ and K+), from which the capacity to compensate negative charges in the network might differ [31]. In summary, the bands observed in the Raman spectra in Fig. 6 can be assigned according to McKeown et al.'s work [30], as following: (i) at 500 cm−1: vibration X – O – X bonds with X = Ge or Ga; (ii) at 820 cm−1: Q3 XO
4 unit vibrations with X = Ge or Ga; (iii) at 850 cm−1: vibration of annular structure composed of [GeO
4] and [GaO4]− units and; (iv) at 270–300 cm−1: network vibration containing K+ and Ba2+ ions.
3.3. Structure-properties relationship
As KO1/2 acts in the glass network as a modifier oxide, it induces a depolymerization of the glass network through the decrease of connected gallate octahedral sites from (2Ba + K)/Ga ratio of 0.81 to 1.03 and then the formation of new Q3 units (characterized on Raman spectra by the band component at 800 cm−1, Fig. 6). This depolymerization of the network by the addition of potassium
oxide, observed for a ratio above unity, induces a decrease of the density, the glass transition temperature, the viscosity a nd an increase of the thermal expansion coefficient (Table 2, Fig. 1, Fig. 2, Fig. 3).
The increase in the KO1/2 content, which is less polarizable than the other components of this glass system (GeO2, GaO3/2 and BaO), combined to the decrease of the density, leads to an expected decrease of the refractive index values (Fig. 5). As mentioned earlier, a small decrease of the short wavelength cut-off is observed for K + Ba/Ga ≥ 1. As the potassium oxide introduction generates the formation of new Q3 units in the glassy matrix, an increase of λ
UV could have been expected due to the creation of new non-bonding molecular orbitals in the upper level of the valence band. However, one should keep in mind that the short wavelength cut-off is also influenced by the presence of impurities (transition metal ions in particular) within the raw materials, making the discussion more complex.
The Young's modulus was estimated by the ultrasound echography study for the glass composition GGBK17 to be at 62 GPa. This value appears to be higher than the Young's modulus obtained for chalcogenide glasses (for example E = 16.5 GPa for an As2S3 glass [32]) and even fluoride glasses (as for the ZBLAN glass, E = 54.3 GPa [32]). The Young's modulus of the GGBK17 glass composition seems to be closer to the values measured for silicate glasses (with E = 50 to 100 GPa depending on the glass composition [32]). The hardness of the GGBK17 glass, which is of 565 kg/mm2 (or 5.54 GPa) is higher than the value observed by Bayya et al. [[3], [4], [5], [6]]; [[13], [14], [15], [16]] for BaO-Ga2O3-GeO2 and BaO-In2O3-Ga2O3-GeO2 glasses (showing respectively a hardness between 385 and 455 kg/mm2 (or 3.77 and 4.46 GPa)). The latest being studied in the germanium oxide rich portion of the system, it can be suggested that the addition of gallium oxide tends to increase the hardness of the glasses.
3.4. Crystallization study
3.4.1. Composition selection and preliminary crystallization test
Regarding the thermal and optical properties, the most suitable glass for further thermal shaping like fiber drawing is the GGBK17 sample whose nominal composition is 40.1GaO3/2-26.7GeO2-16.2BaO-17KO1/2 (in cation mol.%, which also corresponds to 28Ga2O3-37GeO2-23BaO-12K2O in mol.%). This glass presents a high ΔT (191 °C), a weak and broad crystallization peak on the DSC measurements (Fig. 1), a refractive index of 1.701 at 532 nm and a large transmission window (from 277 to 5900 nm, Fig. 4). One should also keep in mind that the higher the potassium content is, the easier it is to melt and shape the glass at lower temperature due to lower viscosity (Fig. 3) and the temperature compatibility with molding materials (for example stainless steel).
In order to get preliminary crystallization information regarding the GGBK17 glass, a heat treatment was performed on bulk and powder at a temperature T1 between Tfib = 819 °C and Tx = 832 °C. To do so, one bulk and one powder samples were heated up in 5 min from ambient temperature to the temperature T1 = 825 °C, hold for 30 min at T1 and then cooled down to room temperature. The powder XRD patterns (see Fig. 7) were then recorded to determine the observed crystalline phases on both bulk and powder samples. The bulk sample presents one crystalline phase which can be indexed with either KGaGeO4 (JCPDS 052-1595) or BaGa2O4 (JCPDS 046-0415). Both phases are isostructural and exhibit very close cell parameters, which prevents clear assignation from XRD. The powder sample shows two crystalline phases being for the main one KGaGeO4 (JCPDS 052-1595) or BaGa2O4 (JCPDS 046-0415) and α-BaGa2O4 (JCPDS 049-0890) a high temperature polymorphism of the previous BaGa2O4 phase. These different results demonstrate the existence of a surface crystallization mechanism.
3.4.2. Nucleation-growth curves determination
The nucleation-like curve is determined with the DSC method proposed by Marotta et al. [26]. It consists in measuring the variation of the maximum of the crystallization peak Tp after a thermal treatment at a potential nucleation temperature TN. According to the following equation:
where I0 represents the nucleation rate at the temperature TN, Tp0 (respectively Tp) the maximum of crystallization obtained on the thermal analysis of the glass without any heat treatment (respectively after a heat treatment of 30 min at TN), EC the crystallization activation energy and C a constant that cannot be determined, plotting (1/Tp – 1/Tp0) as a function of TN will provide a qualitative information on the nucleation rate variation. Then the nucleation-like curve only shows the qualitative evolution of the nucleation rate with the temperature.
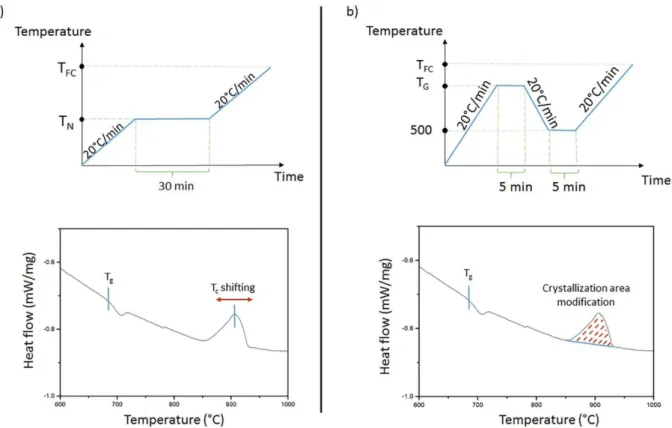
Experimentally, one glass bulk piece (40 – 55 mg) is placed in a Pt crucible and into a DSC apparatus. A first DSC measurement is run with a slope of 20 °C/min from room temperature to a temperature above crystallization (TFC), providing the thermal profile
reference of the studied glass. Then, several glass samples are tested following the heat treatment represented in Fig. 8a. A displacement of the maximum of crystallization will occur depending on TN, as represented in Fig. 8a. In fact, if many nuclei are formed during the isothermal plateau, the crystallization will occur at a lower temperature compared to the original DSC curve of the non-treated glass.
The growth-like curve is then also determined from DSC method, as proposed by Ray et al. [33]. In this case, the glass sample is considered to already contain nuclei, and the applied heat treatment only induces their growth, as represented in Fig. 8b. As crystallization appears as an exothermic phenomenon on the DSC curves, the variation of the crystallization peak area will provide information on the growth mechanism, as represented in Fig. 8b. The plot of the growth-like curves is ruled by the potential growth temperature (TG) as follows:
where A0 (respectively At) is the exothermic peak area for the glass sample which is not heat treated at TG (respectively for the glass sample treated at TG). In order to stay similar to the nucleation-like curve, the heat treatment slope is maintained at 20 °C/min and the mass of the analyzed bulk piece is between 40 and 75 mg.
The nucleation and growth profiles were both acquired, and thus the measurement were realized on glass chunks. The obtained curves are presented in Fig. 9.
The maximum nucleation and maximum growth temperatures, respectively TNmax and TGmax, are determined from these curves respectively at 710 °C and 880 °C. One can observe that the nucleation and growth curves show a huge overlap, with the presence of two maxima for the growth curve. In fact, the first maximum at around 750 °C could be associated to the surface crystallization when the second, and major maximum at 860 °C may be related to the volume crystallization. From this, it can be deduced that no control on the nucleation and growth of the volume can be managed. Actually, the surface crystallization may always grow while the volume nucleates. One can note that the first maximum at 750 °C is lower than the estimated fiber drawing temperature (Tfib = 819 °C) and might generate problematic surface crystallization during fiber drawing.
3.4.3. Crystallization at the maximum of nucleation and phase determination
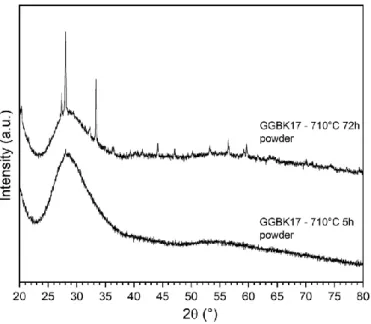
Crystallization tests were realized on bulk samples at TNmax = 710 °C for 5 and 72 h. The powder XRD patterns recorded are presented in Fig. 10. For the sample heat-treated 72 h, diffraction peaks corresponding to the same crystalline phases above mentioned are clearly observed, as well as the presence of a glassy phase. On the other hand, the sample heat-treated 5 h appears to be essentially glassy. A small peak is however arising at around 28° which can indicate the apparition of first crystals.
TEM observations were then performed in order to detect a possible phase separation in the glass (pristine and treated at TNmax for 5 and 72 h). The TEM micrographs acquired in bright field mode and the electron diffraction patterns recorded on selected areas are presented in Fig. 11. Note that electron diffraction patterns were recorded here to detect the presence of crystals in the samples rather than identify their nature. All the analyzed pristine samples appear homogenous and do not present phase separation. However, the glass heat-treated for 5 h at TNmax shows some dispersed crystallized areas (see Fig. 11b) with corresponding electron diffraction pattern presented in inset) while the sample heat-treated for 72 h at TNmax exhibits numerous nanocrystals (Fig. 11c) and corresponding electron diffraction pattern in inset). These observations are in agreement with the XRD patterns presented in Fig. 10.
As the crystalline phase could not be determined accurately from XRD, the surface of one sample treated at 710 °C for 72 h was studied by SEM-EDX. A first observation of the surface of the sample, as presented in Fig. 12b). The EDX analyses of the dendrites presented in Fig. 12d and Table 3 indicate a mixed composition between KGaGeO4 and BaGa2O4, suggesting a K1-xBaxGa1+xGe 1-xO4 solid solution with a x = 0.27 composition. This result almost corresponds to a 3:1 combination of KGaGeO4 and BaGa2O4 phases. Moreover, an analysis of the residual glassy phase in between the dendrites shows a deficit in the potassium content, which tends to increase when measuring its concentration in depth of the glass sample. This can be explained from a lower concentration of potassium in the crystal compared to the pristine glass.
In summary, the crystallization behavior described here on the GGBK17 glass composition shows that surface crystallization issues are expected during further fiber drawing experiments from a glass preform, despite the fact that this composition possesses a very large thermal stability against crystallization, as determined by DSC (ΔT = 191 °C). Preliminary tests of fiber drawing from GGBK17 glass preforms (40 mm length and 10 mm diameter) were conducted in parallel, confirming these surface crystallization issues. To illustrate this result, Fig. 13 shows a typical GGBK17 preform neck-down obtained after conventional drawing at 805 °C, even after optical polishing of the preform surface.
Last, as mentioned in the introduction, the initial approach here was to replace sodium cations in the germano-gallate vitreous network by less mobile barium and potassium cations in order to limit surface crystallization issues occurring during fiber drawing from preform (as observed in our anterior work on sodium germano-gallate glasses). It appears however from the results presented here that surface crystallization still constitutes a limiting factor for fiber drawing from glass preforms. Three directions may therefore be considered to circumvent this problem. The first one is related to the fiber fabrication process with the implementation of the crucible technique for instance. In such an approach, the glass fiber is indeed produced during cooling of the glass brought to its liquid state within a crucible, limiting therefore the risk of crystallization that occurs here upon glass preform heating. The second direction consists in modifying the glass composition and eventually replaces the alkali oxides by other components whereas the third one would be a combination of the first two. Efforts are currently ongoing in order to produce crystal-free optical fibers from these mid-infrared transparent germano-gallate glasses. Their superior thermal and mechanical properties (vs heavy metal oxide or fluoride glasses for instance) indeed make them promising candidates for robust and durable mid-infrared optical materials in general.
4. Conclusion
Germano-gallate glasses (i.e. with gallium oxide as the main component) of compositions (100-x)[48.3GaO3/2-32.2GeO2
-19.5BaO]-xKO1/2 (with x = 0, 5, 10, 13, 17 mol%) have been investigated in order to determine most appropriate composition for preform fiber drawing. The obtained glasses are transparent from approximately 280 nm up to 5.5 μm. When the potassium oxide content is increased, the measured linear refractive index and density decrease respectively from 1.72 to 1.67 (at 1538 nm) and 4.79 to 4.34 g/cm3; the glass transition temperature decreases (698 to 671 °C), as well as the viscosity in the softening regime whereas the thermal expansion coefficient increases (4.8 to 10.3 × 10⁻⁶ K−1). These expected results are related to the depolymerization of the 3D interconnected glass network studied by Raman spectroscopy.
Slightly superior mechanical properties (Young and shear moduli, Poisson's ratio, hardness) vs well-known BGG glasses have been measured on the glass composition, 40GaO3/2-27GeO2-16BaO-17KO1/2 (in mol.%, which corresponds to 28Ga2O3-37GeO2 -23BaO-12K2O), selected as the most promising one for optical fiber production. A thorough crystallization study combining DSC method with XRD, SEM and TEM analyses has been conducted on this glass composition to better understand the unexpected surface crystallization issues observed during the glass preform fiber drawing process. Surface crystallization of mixed KGaGeO4 and BaGa2O4 phases has been evidenced, suggesting the formation of a K1-xBaxGa1+xGe1-xO4 (x = 0.27) solid solution. The obtained results provide better insight of the surface crystallization behavior observed in this germano-gallate glass, which is somewhat representative of that observed in Ga2O3-GeO2-based glasses, independently of their germanium and gallium oxides relative content.
As such crystallization behavior under heating treatment constitutes a serious limiting factor to glass thermal processing like fiber drawing from a preform, alternative avenues have to be explored to produce germano-gallate glass optical fibers transmitting in the mid-infrared.
Acknowledgements
This research was conducted in the framework of the Laboratoire International Associé (LIA) LuMAQ and supported by the Canadian Excellence Research Chair program (CERC) in Photonics Innovations and the Aquitaine Region. The authors are also grateful to the Natural Sciences and Engineering Research Council of Canada (NSERC), the Fonds de Recherche Québecois sur la Nature et les Technologies (FRQNT) and the Canadian Foundation for Innovation (CFI) for the financial support. The authors thank the ICMN Laboratory (Orléans, France) for TEM access. Steeve Morency is also acknowledged for his technical assistance.
Mobilities were supported by grants of the French Consulat in Québec (by the Frontenac Program), the association of Campus France and Mitacs Globalink as well as grants of the Agence Nationale de la Recherche (ANR) with the program “Investissement d'avenir” number ANR-10-IDEX-03-02 and ANR-17-CE08-0042-01, and the French Region Nouvelle Aquitaine, with the program n° 2016 – 1R10107.
References
[1] G.M. Tao, H. Ebendorff-Heidepriem, A.M. Stolyarov, S. Danto, J.V. Badding,Y. Fink, J. Ballato, A.F. Abouraddy, Infrared fibers,
Adv. Opt. Photon. 7 (2015) 379–458.
[2] A. Schliesser, N. Picque, T.W. Hansch, Mid-infrared frequency combs, Nat.Photonics 6 (2012) 440–449.
[3] S.S. Bayya, B.B. Harbison, J.S. Sanghera, I.D. Aggarwal, BaO-Ga2O3-GeO2 glasses with enhanced properties, J. Non-Cryst. Solids 212
(1997) 198–207.
[4] S.S. Bayya, J.S. Sanghera, I.D. Aggarwal, J.A. Wojcik, Infrared transparent germa- nate glass-ceramics, J. Am. Ceram. Soc. 85 (2002)
3114–3116.
[5] S.S. Bayya, G.D. Chin, G. Villalobos, J.S. Sanghera, I.D. Aggarwal, VIS-IRtransmitting windows, International Conference on
Window and DomeTechnologies and Materials IX, Orlando, FL, 2005, pp. 262–271.
[6] S.S. Bayya, G.D. Chin, J.S. Sanghera, I.D. Aggarwal, Germanate glass as a window for high energy laser systems, Opt. Express 14
(2006) 11687–11693.
[7] S.S. Bayya, J.S. Sanghera, I.D. Aggarwal, Optical Transmission of BGG GlassMaterial, (2004).
[8] A. Jha, B. Richards, G. Jose, T. Teddy-Fernandez, P. Joshi, X. Jiang, J. Lousteau, Rare-earth ion doped TeO2 and GeO2 glasses as
laser materials, Prog. Mater. Sci. 57 (2012) 1426–1491.
[9] J. Wang, J.R. Lincoln, W.S. Brocklesby, R.S. Deol, C.J. Mackechnie, A. Pearson, A.C. Tropper, D.C. Hanna, D.N. Payne, Fabrication
and optical properties of lead- germanate glasses and a new class of optical fibers doped with Tm3+, J. Appl. Phys. 73 (1993) 8066– 8075.
[10] J.E. Shelby, Alkali and alkaline-earth galliosilicate glasses, Rare Elem. Glas. 94-9 (1994) 279–316.
[11] J.M. Jewell, Alkaline-earth gallogermanate glasses, Rare Elem. Glas. 94-9 (1994)317–343.
[12] S.P. Szu, C.P. Shu, L.G. Hwa, Structure of properties of lanthanum galliogermanate glasses, J. Non-Cryst. Solids 240 (1998) 22–28.
[13] J.C. Lapp, W.H. Dumbaugh, Gallium oxide glasses, Rare Elem. Glas. 94-9 (1994)257–277.
[14] T. Skopak, S. Kroeker, K. Levin, M. Dussauze, R. Méreau, Y. Ledemi, T. Cardinal, E. Fargin, Y. Messaddeq, Structure and properties
of gallium-rich sodium germano- gallate glasses, J. Phys. Chem. C 123 (2019) 1370–1378.
[15] P. Hee, R. Christensen, Y. Ledemi, J.E.C. Wren, M. Dussauze, T. Cardinal, E. Fargin, S. Kroeker, Y. Messaddeq, Properties and
structural investigation of gallophosphate glasses by Ga-71 and P-31 nuclear magnetic resonance and vibrational spectro- scopies, J. Mater. Chem. C 2 (2014) 7906–7917.
[16] M.K. Murthy, K. Emery, Properties and structure of glasses in system M2O-Ga2O3- GeO2 (M = Li, Na, K), Phys. Chem. Glasses 8
(1967) (26-&).
[17] P.L. Baynton, H. Rawson, J.E. Stanworth, Gallium oxide glasses, Nature 179 (1957) 434–435.
[18] G. Whichard, D.E. Day, Glass-formation and properties in the gallia-calcia system, J. Non-Cryst. Solids 66 (1984) 477–487.
[19] K. Fukumi, S. Sakka, Structure of alkali or alkaline-earth metal gallate glasses, J. Non-Cryst. Solids 95-6 (1987) 193–200.
[20] L.A. Balewick, J.E. Shelby, Properties of calcium, strontium, and barium galliosi- licate glasses, J. Am. Ceram. Soc. 73 (1990)
213–216.
[21] L.G. Hwa, Y.R. Chang, S.P. Szu, Optical and physical properties of lanthanum gal- logermanate glasses, J. Non-Cryst. Solids 231
(1998) 222–226.
[22] L.R. Pinckney, B.N. Samson, G.H. Beall, J. Wang, N.F. Borrelli, Transparent gallate spinel glass-ceramics, Ceram. Nanomater.
Nanotechnol. 137 (2003) 265–275.
[23] R. Buczynski, H. Bookey, M. Klimczak, D. Pysz, R. Stepien, T. Martynkien, J.E. McCarthy, A.J. Waddie, A.K. Kar, M.R. Taghizadeh,
Two octaves super- continuum generation in Lead-bismuth glass based photonic crystal fiber, Materials 7 (2014) 4658–4668.
[24] T. Skopak, P. Hee, Y. Ledemi, M. Dussauze, S. Kroeker, T. Cardinal, E. Fargin,Y. Messaddeq, Mixture experimental design applied to
gallium-rich GaO3/2-GeO2- NaO1/2 glasses, J. Non-Cryst. Solids 455 (2017) 83–89.
[25] T. Skopak, S. Kroeker, K. Levin, M. Dussauze, R. Méreau, Y. Ledemi, T. Cardinal, E. Fargin, Y. Messaddeq, Structure and properties
of gallium-rich sodium germano- gallate glasses, J. Phys. Chem. 123 (2019) 1370–1378.
[26] A. Marotta, A. Buri, F. Branda, Nucleation in glass and differential thermal analysis, J. Mater. Sci. 16 (1981) 341–344.
[27] A. Galstyan, S.H. Messaddeq, I. Skripachev, T. Galstian, Y. Messaddeq, Role of io- dine in the solubility of Tm3+ ions in As2S3
glasses, Opt. Mater. Express 6 (2016) 230–243.
[28] I. Avramov, A. Milchev, Effect of disorder on diffusion and viscosity in condensed systems, J. Non-Cryst. Solids 104 (1988) 253–
260.
[29] J.C. Mauro, Y.Z. Yue, A.J. Ellison, P.K. Gupta, D.C. Allan, Viscosity of glass-forming liquids, Proc. Natl. Acad. Sci. U. S. A. 106 (2009)
[30] D.A. McKeown, C.I. Merzbacher, Raman spectroscopic studies of BaO-Ga2O3-GeO2 GLASSES, J. Non-Cryst. Solids 183 (1995) 61–72.
[31] K. Fukumi, S. Sakka, Raman spectroscopic study of the structural role of alkaline- earth ions in alkaline-earth gallate glasses, J.
Non-Cryst. Solids 94 (1987) 251–260.
[32] T. Rouxel, Elastic properties and short-to medium-range order in glasses, J. Am.Ceram. Soc. 90 (2007) 3019–3039.
[33] C.S. Ray, K.S. Ranasinghe, D.E. Day, Determining crystal growth rate-type of curves in glasses by differential thermal analysis, Solid
Fig. 1. DSC thermograms of the GGBKx glass samples recorded at 10 °C/min. Traces were vertically translated for better reading.
Fig. 2. TMA curves recorded on the GGBKx glass samples.
Fig. 3. Viscosity-temperature curves (in log(Poise)) of the GGBKx samples measured by the parallel plate method between 770 °C and 795 °C. The plain lines represent the experimental data whereas the dotted lines correspond to their respective linear extrapolation.
Fig. 4. (a) Transmission spectra in the short wavelength range of the GGBKx glass samples. Samples thickness is about 1 mm. (b) Transmission window of the GGBK17 glass sample (thickness is about 5 mm).
Fig. 5. Variation of refractive index measured at different wavelengths of the GGBKx glass samples as a function of their nominal potassium oxide content (KO1/2 in mol.%).
Fig. 6. Raman spectra of the studied GGBKx glasses normalized at their main peak intensity (~ 500 cm−1).
Fig. 7. Powder XRD diffraction patterns recorded on GGBK17 glass powder and bulk samples annealed at 825 °C for 30 min, with the peak positions related to the KGaGeO4, BaGa2O4 and α-BaGa2O4 crystalline phases.
Fig. 8. Representations of the heat-treatment applied on the GGBK17 glass with the corresponding effect on the DSC curve for: a) the nucleation-like curve determination, and b) the growth-like curve determination.
Fig. 9. Volume nucleation (black curve) and growth (red curve) curves for the GGBK17 glass obtained on one or two glass pieces with the isothermal technique. TNmax is the maximum nucleation temperature and TGmax is the maximum growth temperature. (For interpretation of the
Fig. 10. Powder XRD diffraction patterns recorded on GGBK17 glass powder sample annealed at 710 °C for 5 and 72 h. The observed peaks are attributed to the KGaGeO4 and/or BaGa2O4 crystalline phases (see Fig. 7).
Fig. 11. TEM micrographs and electron diffraction patterns (in inset) of GGBK17 glass pieces: a) without heat-treatment, b) treated at 710 °C for 5 h, and c) treated at 710 °C for 72 h.
Fig. 12. SEM observations: a) in Back Scattered Electron mode of the GGBK17 glass surface after a heat-treatment at 710 °C for 72 h; b-c) of the section of the GGBK17 glass treated at 710 °C for 72 h at two different magnifications with the localization of the EDX analysis spots and
the corresponding spectra (d).