The Costs of Environmental Protection by
Richard Schmalensee
MASSACHUSETTS INSTITUTE
SEP 0 5 1996
October 12, 1993
The Costs of Environmental Protection
Richard Schmalensee
Massachusetts Institute of Technology
INTRODUCTION
In the 1990 Economic Report of the President, the Bush Administration asserted that economic growth and environmental protection are not necessarily incompatible:'
Economic Prosperity and environmental quality are widely regarded as two of this Nation's most important goals. Some view these as competing goals and argue that economic growth begets environmental degradation. Increasingly, however, this conventional wisdom is being questioned, and a new consensus is emerging that economic growth and environmental quality are in many respects complementary. For example, economic growth provides the opportunity for firms to invest in new facilities that are cleaner and more efficient. It is no coincidence that the wealthy societies are the ones that are both willing and able to devote
substantial resources to environmental protection.
Compatibility between economic growth and environmental improvement is far from automatic, however, it depends on selection of appropriate goals and careful design of regulatory programs.
In his Earth Day speech this April, President Clinton also argued for the compatibility of these goals:2
First, we think you can't have a healthy economy without a healthy environment. We need not choose between breathing clean air and bringing home secure paychecks. The fact is, our environmental problems result not from robust growth, but from reckless growth. The fact is that only a prosperous society can have the confidence and the means to protect its environment. And the fact is that healthy communities and environmentally sound products and services do best in today's economic competition.
That's why our policies must protect our environment, promote economic growth, and provide millions of new high-skill, high-wage jobs.
Though they make the same basic point, these passages differ importantly. The thrust of the Bush argument is that environmental protection is important but expensive, so that both robust economic growth and careful policy design are necessary to make it affordable. President Clinton, on the other hand, seems to hint that these two goals are automatically compatible because environmental regulation produces important economic benefits in addition to preserving natural systems and protecting public health.
A similar hint appears later in the President's Earth Day speech, when he defends signing "an executive order which commits the federal government to buy thousands more American made vehicles, using clean, domestic fuels...." in part by asserting that
This will reduce our demand for foreign oil, reduce air pollution, promote
promising technologies, promote American companies, create American jobs, and
save American tax dollars.3
The President goes on to defend "an executive order committing every agency of the national
government to do more than ever to buy and use recycled products" as follows:
4This will produce a market for new technologies, make better use of recycled
materials, and encourage the creation of new products that can be offered to the
government, to private companies, and to consumers. And again, it will create
jobs through the recycling process.
Though such hints of green free lunches abound in Administration rhetoric, however, neither
President Clinton nor Vice-President Gore seems ever to have asserted explicitly that these sorts
of economic side effects make the net costs of environmental regulation zero or negative.
5Not everyone is so careful to avoid crossing the line from hint to assertion, however.
Some environmentalist rhetoric even seems to transmute the costs of protecting the environment
into benefits, using something like the following logic. The U.S. economy needs new technology
and "good" jobs, and tougher environmental standards would lead to innovation and create good
jobs in pollution prevention and control. Moreover, these innovations can be exported, creating even more good jobs, raising exports, and reducing the balance of payments deficit. On this logic, these side effects make environmental protection even better than a free lunch -- it's a lunch we all get paid to eat.
This essay provides an overview of what is known about the costs of environmental protection in the U.S. and shows why attempts to transmute those substantial costs into benefits are invalid. In particular, I argue that environmental protection is neither a possible cure for unemployment nor a plausible route to enhanced overall U.S. competitiveness. It of course does not follow that because there is no green free lunch, U.S. environmental standards should be relaxed. Most environmental programs produce real benefits, and I have nothing to say here about how the benefits of any particular program relate to its costs. Whatever the associated benefits, however, protecting the environment in the U.S. is expensive. Pretending -- or, perhaps, even hinting -- that such protection is free risks the adoption of policies that will needlessly slow economic growth and lower U.S. living standards without providing commensurate benefits. Such rhetoric distracts from the important task of devising environmental policies that are both affordable and effective.
ESTIMATES OF DIRECT COSTS
The natural starting point for an analysis of the costs of environmental protection is the estimates of U.S. pollution abatement and control expenditures compiled regularly by the Bureau of Economic Analysis (BEA) of the Department of Commerce and published in the Survey of
Current Business.6 These estimates are based on surveys conducted by the Bureau of the Census and the Energy Information Agency of the Department of Energy and on data provided by the Environmental Protection Agency (EPA) and other sources.7 The BEA seeks to measure expenditures that U.S. residents make to produce cleaner air and water and to manage solid
waste.
These expenditures include personal consumption (household purchase and operation of motor vehicle abatement devices), private investment (business purchases of plant and equipment aimed at reducing emissions), and government purchases (investment and operation of sewer systems, outlays for R&D and for regulation and monitoring activities). All of these outlays appear in the national income accounts as components of final demand and thus of GDP. In addition, the BEA estimates include business spending on current account (e.g., for operating pollution control devices and for R&D) that are not part of final demand in the national accounts. Business spending on current account amounted to 43% of total estimated pollution abatement and control expenditures in 1990."
In a much-cited report published in 1990 (and, unfortunately, not updated since), the EPA provided alternative estimates of historical expenditures and projections to the year 2000.9 This reports also provides cost estimates and projections obtained by replacing capital outlays with the corresponding annualized costs. While the EPA relied on many of the same data sources as BEA, EPA constructed its own estimates of motor vehicle emission abatement cost, and it
included some environmental activities not covered by BEA -- notably drinking water and Superfund programs.
Economy-Wide and Industry-Specific Estimates
The BEA and EPA estimates for 1990 disaggregated by medium and expressed as percentages of 1990 GDP are shown in Table 1.1o The excess of costs over expenditures in the EPA data reflects a decline in pollution environmental investment relative to GDP during the 1980s. (See Figure 2, below.) The difference in "Air" expenditure estimates reflects the EPA's significantly lower estimate of the cost of abating motor vehicle emissions, and the difference in estimated expenditures for "Land and Other" seems to reflect the greater programmatic coverage of the EPA study. Expressed as percentages of GDP, official estimates of environmental expenditures in other OECD nations tend to be slightly below the figures for the United States, and this seems likely to mirror differences in overall regulatory stringency."
As noted above, both the BEA and EPA spending estimates include business expenditures on current account, which do not appear in the GDP accounts as final demand. Thus the figures in Table 1 are not percentage shares, and it is accordingly inappropriate to treat them as percentages of GDP "devoted to" environmental protection. Under some conditions, these percentages can significantly overstate the relative importance of environmental expenditures.'2 In a recent draft EPA report, Nestor and Pasurka attempt to improve upon this measure by using input-output analysis to estimate the value-added devoted directly and in total to environmental protection.'3 For 1982, the most recent year for which the necessary data are available, Nestor and Pasurka find direct environmental value-added amounted to only 0.67 percent of GDP. Since GDP is the sum of direct value-added across industries, this establishes that the environmental protection industry is small relative to the economy, but it clearly understates the overall economic importance of environmental protection activities. If, for
instance, environmental regulation requires electric utilities to bum coal less efficiently and thus increases fuel expenditures per unit of output, there is a clear social cost but zero direct value-added.'4
A better measure of the resources required to support environmental protection activities is total value-added, which Nestor and Pasurka find amounted to 1.62 percent of GDP in 1982."5 The EPA and BEA estimates of 1982 environmental expenditures average 1.79 percent of
GDP.6 The relatively small difference between these numbers suggests that the double-counting problem that in principle affects the BEA and EPA estimates is relatively sma' so these estimates can be usefully compared with GDP.
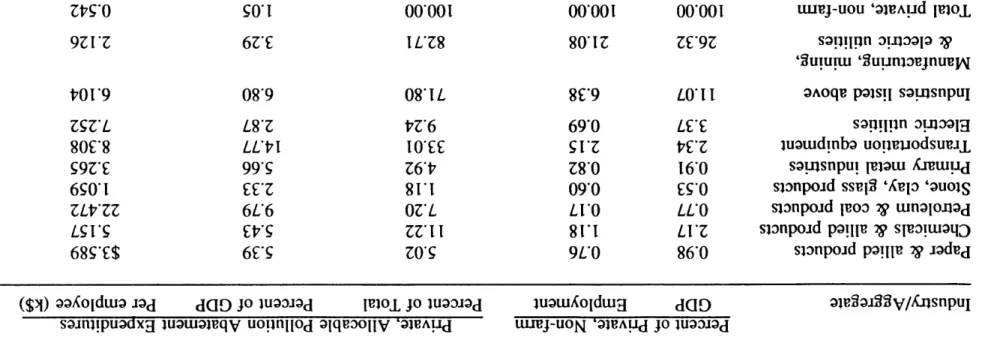
Not only is the total direct cost of environmental protection thus substantial relative to GDP, it is distributed very unevenly across sectors of the economy. The service sector, which currently accounts for about 2/3 of private non-agricultural employment, bears essentially no direct costs. At the other extreme, the industries listed in Table 2 each had direct costs of more than $1,000 per employee in 1990. These industries accounted for 11.07 percent of U.S. private, non-farm GDP and 6.38 percent of private, non-farm employment. (The difference shows that they were more capital-intensive than average.) Despite their relatively small share of aggregate economic activity, these industries accounted for over 70 percent of private sector pollution abatement expenses that can be allocated to particular industries, and they devoted over $6,000 per employee to pollution abatement."
It is important to recognize that some components of the direct cost of environmental protection are not included in the official estimates.18 The boundary between environmental
regulation and regulation concerned with related goals, particularly public health, is of course somewhat fuzzy. Nonetheless, there is a good case for including, as EPA does but BEA does not, spending mandated by drinking water and Superfund programs. Both compilations exclude reductions in agricultural yields and manufacturing efficiency arising because chemical uses have been restricted, as well as the cost of complying with aircraft noise regulations. Some have argued that the questionnaires used by Census are badly in need of updating to reflect the greatly increased scope of environmental programs. Volunteer efforts (e.g., in highway litter removal) are not valued in any official cost estimates (though voluntary expenditures are included).
Finally and perhaps most importantly, no attempt is made in any official statistics to include legal fees and paperwork costs incurred or management time lost due to environmental regulation. Observers often note that environmental regulation in the U.S. tends to be more adversarial and to involve more litigation and other formal (i.e., lawyer-intensive) proceedings than elsewhere, so these omitted costs are likely to be particularly important in the United
States."9
It is also important to note the difficulty of estimating some included components of direct cost.20 In principle, estimating the current cost of complying with automobile emissions limits is a complex exercise requiring a description of how the auto industry and its technology would have evolved over time in a world without emission limits. Because of differences in the amount of "technology forcing" credited to environmental regulation, the BEA and EPA estimates of this cost differ substantially.
The complexity of estimating compliance cost and the difficulty of defending any particular non-zero estimate may lead to non-reporting of particular cost categories in some cases. It is difficult to imagine a lumber firm, for instance, devoting significant resources to computing the increased logging costs associated with spotted owl protection if those costs will only be used to reply to a Census questionnaire. Of course, if a firm expected that its reported expenditure would influence some future regulatory or legislative decision, it would tend to inflate its report. But such expectations are rarely plausible, since the Census reports only figures that cover broad industry aggregates and thus reflect the impact of many programs and regulations. Generally, then, it would seem rational for firms to behave non-strategically in responding to the Census and thus to ignore costs that are difficult to estimate and report only easily identifiable, out-of-pocket expenditures.
The acid rain program established by the 1990 Clean Air Act Amendments provides a particularly important example. This program gives electric utilities great flexibility in deciding how to reduce sulfur dioxide emissions. Individual utilities may install control devices (flue gas scrubbers), shift to fuels with less sulphur, use conservation programs to reduce demand, and run dirty generating units less. Since spending on conservation programs serves other ends as well, and since the costs of changing generating unit dispatch patterns may be hard to compute, it is difficult to imagine that either of these costs will show up as reported costs of sulfur dioxide emissions control.
The acid rain program exemplifies a desirable recent trend toward more flexibility in environmental regulation. If this trend persists, the problem of measuring direct cost will worsen.2' When compliance requires purchase and operation of specified treatment equipment,
costs are easy to measure and are likely to be reported reliably. If instead firms can comply by redesign of products or processes, with an eye to pollution prevention instead of abatement or cleanup, the costs of environmental protection will generally be reduced, sometimes substantially. But those costs will also become much harder to define, let alone to measure. The design of a new chemical plant, for instance, will reflect the value of economizing on capital, labor, and materials, as well as the various benefits of preventing pollution. It is difficult in principle to see how one would separate out the environmental component of total cost, and it is even more difficult to imagine that firms would allocate scarce talent to doing so simply for the satisfaction of filling out a Census form well. As pollution prevention becomes more important, it will be conceptually and mechanically more difficult for firms to isolate the direct costs of environmental regulation. In the absence of implausible incentives for strategic behavior, the profit-maximizing response to Census forms may well be simply to forget about any cost component that cannot easily be estimated from available records.
Direct Effects
How does the direct cost of environmental protection, which is mainly paid out by businesses and governments, affect households? In the first instance, holding constant technology and unemployment, protecting the environment consumes scarce resources, which the direct cost estimates attempt to value. These resources are then not available to produce the non-environmental goods and services that households, firms, and governments demand in the marketplace. Construction workers who build structures to house emissions control equipment are not available to build houses, factories, or schools. Conventional measures of living standards
(which exclude benefits of environmental protection) are necessarily reduced. In the absence of changes in technology, environmental regulation that requires changes in production processes or final products necessarily reduces conventional measures of productivity and households' real incomes. The direct cost of environmental protection is a reduction in the economy's capacity to meet other, non-environmental demands.
Figure 1 illustrates this central effect for a simple economy -- one that produces cars and burgers instead of the familiar guns and butter. Before regulation, the technology and productive resources available to this economy are capable of producing any combination of cars and burgers along or inside the "production possibility frontier" AB. Suppose now that each car produced must be equipped with a specified emissions control device. This will increase the cost of producing cars and shift the economy's production possibility frontier in, to a curve like AB'.
(Note that the maximum number of burgers that could be produced does not change, while the maximum number of cars falls.) Because of regulation, consumers in this economy must make do with fewer cars, fewer burgers, or fewer of both goods. If production was initially at point
P, for instance, a shift to P' would result in both fewer cars and fewer burgers. Real GDP falls
as a consequence, as do conventional measures of productivity and living standards. Correctly measured living standards may rise on balance, of course: the benefits of reduced emissions may more than offset the reduction in real consumption.2 2
If instead of requiring emissions control devices on cars, the government in this simple economy had decided to build sewage treatment facilities, the burgers/cars frontier in Figure 1 would again be shifted inward, and the economy's ability to satisfy demands for burgers and cars would again be reduced. Real GDP would not generally fall in this case, however, since
spending on sewage treatment facilities is itself a component of GDP. In general, allocating resources to environmental protection reduces real GDP only when it reduces productive efficiency or requires product attributes for which the private market is unwilling to pay. It
always reduces the economy's capacity to satisfy non-environmental demands.
FROM DIRECT COST TO TOTAL COST
The officially estimated direct costs of environmental regulation are significant on an economy-wide basis, are disproportionately high in some major industries, and seem likely to underestimate the true direct costs. We now consider the relation between those direct costs and
the total -- direct plus indirect -- social cost of environmental protection. The next two sections
will consider the implications of relaxing the assumptions of constant unemployment and constant technology, respectively. Maintaining those assumptions here simplifies discussion of some important reasons why the total social cost of environmental regulation is likely to exceed substantially its direct cost.
Reductions in Output and Direct Cost
The first of these reasons reflects the uneven distribution of direct costs throughout the economy. Environmental policies shift relative prices and thus the mix of outputs produced by the economy. The higher an industry's per-unit compliance costs, all else equal, the more its price must increase to cover those costs, the greater the induced reduction in its output, and the lower its total measured compliance costs. Output reductions that lower environmental spending,
however, also reduce consumers' surplus, and this component of social cost is necessarily omitted from the official statistics. In the limit, if environmental regulation forces an industry to shut down entirely, no direct compliance costs are reported, but consumers and workers may suffer substantial losses. (Neither BEA nor EPA estimates include costs associated with plant closings.) This output reduction effect is illustrated in Figure 1. If regulation caused the economy to shift from point P to point P", at which the same number of cars were produced, the direct cost, measured in terms of the reduction in burger consumption, would be C. Because cars are now more expensive relative to burgers, however, one expects the number of cars demanded and produced to fall and the economy to end up at some point like P'. At that point the vertical distance between the two curves, C', which measures the direct cost of regulation, is lower than
at P.
Table 3 illustrates this effect numerically for the (partial equilibrium) case of a single competitive market in a large economy, assuming linear demand and constant unit cost in the affected market. When large increases in cost occur in markets with highly elastic demand, the social cost ultimately borne by households can substantially exceed the direct compliance cost primarily paid by businesses. Recent general equilibrium analysis by Hazilla and Kopp finds that this output reduction effect has been quantitatively important in the United States.'
Reductions in Investment and Growth
A second reason why the total cost of environmental protection is likely substantially to exceed the direct cost is that environmental regulation acts to inhibit investment in productive capital. Requiring modifications or additions to new plant and equipment acts like a tax on new
investment by reducing the amount of productive capacity acquired per dollar of investment. This directly discourages investment in new capacity. In addition, regulation that requires the addition of abatement and monitoring equipment to existing capacity tends to crowd out productive investment. Thus environmental regulation necessarily acts to discourage capacity expansion and to slow economic growth.
Figure 2 shows that pollution abatement has consumed a significant fraction of U.S. investment spending. While that fraction declined somewhat during the 1980s, it rose noticeably in 1990 and 1991, the last two years for which we have data. Table 4 shows that capital expenditures for pollution abatement averaged almost 8 percent of total capital spending in the seven highly regulated industries considered in Table 2. Those relatively capital-intensive industries account for only about 15 percent of total private non-residential investment but almost 70 percent of investment in pollution abatement. It is clear that capacity expansion in these industries, at least, could be significantly slowed by environmental regulation.
The general equilibrium analysis of Jorgenson and Wilcoxen confirms this expectation and finds a significant economy-wide growth slowdown as a result of environmental programs." They find that the cumulative effect of environmental regulation was to lower total U.S. GNP by about 2.6 percent in the late 1980s, and they project a 3.0 percent reduction in output by 2005, when the 1990 Clean Air Act Amendments are fully phased in. Note that this is not a static diversion of GDP of the sort that the direct cost estimates capture; it is a reduction in the capacity of the economy to produce GDP. Models based on the "new growth theory," in which capital investment plays a more important role in growth than in the Jorgenson-Wilcoxen model,
Reductions in Total Factor Productivity
Additional reasons for a significant gap between the social and direct costs of
environmental regulation are suggested by the recent work of Gray and Shadbegian.
6They
examine plant-level inputs and output in the paper, oil, and steel industries between 1979 and
1985 and find that a $1 increase in compliance costs is associated with a reduction in total factor
productivity equivalent to between $3 and $4. Since total factor productivity reflects the
productivity of capital, not the amount of capital, this effect is in principle additive to the reduced
investment effect just discussed.
If this extraordinarily large productivity effect holds up under further analysis (particularly
analysis using additional variables to control for the possibility that high compliance costs and
low productivity growth have a common cause), it will imply social costs that are a substantial
multiple of direct cost, at least in these heavily-regulated sectors. It seems plausible to conjecture
that this effect, whatever its true magnitude, could capture the indirect costs of devoting valuable
managerial and technical resources to environmental compliance instead of production or
innovation.
International Markets
Industry often points to loss of competitiveness in world markets as an additional cost of
environmental protection. For the economy as a whole there is no such additional cost except
in the short run, though trade can magnify direct impacts on individual firms and their workers.
Figure 3, another burgers/cars diagram, illustrates the argument. As before, environmental
regulation requiring that cars have emissions control devices shifts the production possibility
frontier inward from AB to AB'. Unlike the economy depicted in Figure 1, this economy can trade cars and burgers internationally at constant prices given by the slope of the dashed line XY. That is, by producing at point
Q
and trading, the economy could consume at any point along XY. For simplicity, however, suppose that demand conditions are such that consumption and production are both initially atQ;
the economy does not exercise its option to tradeinternationally.
If trade were impossible after regulation, the economy's consumption would be expected to shift from
Q
to some point like Q', with fewer cars, fewer burgers, and more auto emissions control devices. If trade is possible, however, and regulation does not change world prices, the economy as a whole can do better by producing atQ"
and trading internationally. This would permit consumption to be at any point along the line X'Y', parallel to XY. In particular, by exporting burgers and importing cars, the economy can consume at point P", with more cars andmore burgers than at
Q'.
Just as the ability to trade internationally always produces overall gains for any market economy, so the ability to change trade flows in response to tightened environmental standards tends to reduce the long-run total cost of those standards. Intuitively, participation in world markets makes it less costly for the economy as a whole to increase or decrease production of particular products. The wider world market can absorb production increases with smaller price declines than the domestic market, and foreign suppliers can step in to replace decreases in domestic production.
The story is different in the transition between the old and new patterns of resource use, however. Movement from
Q
toQ"
in Figure 3 requires a much greater shift of resources fromcars to burgers than movement from
Q
toQ'.
Normally, inter-industry resource shifts of this sort produce transitory, frictional unemployment (as discussed at greater length in the next section). Trade serves to reduce the long-run cost of regulation to the economy as a whole by allowing the pattern of production to respond more fully to changes in relative costs, but the unpleasant other side of this coin is that transitional costs, particularly unemployment, are increased by the greater response. In this simple economy, the trade-induced shift of production fromQ'
toQ"
makes burger producers and consumers in general better off but magnifies the transitional pain borne by the car industry and its workers.
It is certainly not inconceivable that the increase in transitional cost attributable to trade swamps the associated longer-run gain in some cases, since neither can be reliably estimated at present. The available data simply do not permit reliable estimation of the trade impacts of environmental regulation." It is in any case clearly incorrect to focus on either individual component of the total effect while ignoring the other.
Overall, the indirect effects examined in this section indicate that the total social cost of environmental protection, while difficult to estimate reliably, is likely to be well are well in excess of its substantial direct cost. The remainder of this paper considers additional effects involving creation of jobs and stimulation of innovation that are alluded to in the President's Earth Day speech. Neither of these effects can be relied upon to produce net gains for the economy as a whole or to lower the total cost of environmental protection relative to its direct cost. In fact, regulation-induced changes in patterns of employment and innovation are more
EMPLOYMENT EFFECTS
Those who feel that environmental protection is a green free lunch are right that environmental regulation is likely to create jobs somewhere in the economy, just as the President asserted in his Earth Day speech. As job creation is usually measured, most government programs create jobs somewhere in the economy -- just as they destroy jobs elsewhere. Suppose, for instance, that the government decided to require car manufacturers to dig and fill a round hole one meter deep for every vehicle sold. This would without question create jobs in digging and filling. But that would be a cost, not a benefit.
Job Shifting versus Job Creation
In a well-functioning market economy like ours, using workers to dig holes and fill them up again or to produce emissions control devices means that those workers will be unavailable to produce cars, teach school, or meet other non-environmental demands. It makes every bit as much sense to say that the jobs these workers held or would have held are "destroyed" by regulation as to say that their new jobs are "created" by regulation. This sort of job destruction, which reflects the scarcity of productive resources or, equivalently, the fact that consumers must cut back when product costs are driven up, is nearly impossible to isolate, but it is no less important for that. Jobs "destroyed" in this fashion correspond to non-environmental wants not satisfied. There is no justification of which I am aware for assuming that jobs created by environmental programs are especially likely to be filled by workers who would otherwise be unemployed.
If the costs of producing automobiles are increased in order to protect the environment, the prices of automobiles must rise, and the resulting decrease in demand would likely "destroy" jobs in auto assembly while creating jobs in emissions control. And, as in the shift from point
P to point P' in Figure 1, jobs could well be destroyed in other sectors as well. But this does
not mean that emissions control destroys jobs on balance in any meaningful, enduring sense either.
Ours is a dynamic economy. As government, business, and consumer demands change, as new products come to market, as new production processes are commercialized, and as new regulations of all sorts are imposed, jobs are continually created and destroyed. The gross flows of job creation and job destruction in the U.S. economy are generally far in excess of the net changes in economy-wide employment. During the two contractions between January 1980 and November 1982, for instance, total employment fell by 2.1 million, even though about 700,000 jobs were created outside the manufacturing sector." To take another example, about 3.0 million of the 6.5 million workers unemployed in November 1988 had left unemployment by December, but about 1.5 million previously employed workers became unemployed, and another
1.5 million people joined the labor force and began looking for a job. Overall, studies estimate that the average worker holds more than 10 jobs in a lifetime, and every year about 3 percent of the population moves to a different state. Environmental programs clearly play a relatively small role in the overall process of job creation and job destruction.
Frictional Unemployment
One who believes in green free lunches might respond to the foregoing discussion by first noting that it focuses on employment, not unemployment. Suppose the economy is initially at a point like U in Figure 1, inside its AB frontier. At U there is unemployment, which has important social costs. If by tightening environmental regulation the economy could move from
U to P', say, it could remove unemployment and clean up the environment with only a relatively
tiny drop in the consumption of burgers and cars. This makes environmental protection a very cheap lunch. Indeed, if the initial point U were located inside AB', it would be a lunch we would
be paid to eat.
The basic flaw in this response is that moves like that from U to P' are not feasible. There is no reason why tightening environmental regulation would in any way weaken the economy-wide forces that produced unemployment in the first place. In fact, those forces are likely to be strengthened for a time. As the economy responds to shifts in demand, like those that would be produced by more stringent environmental protection, jobs shift among industries and, often, among regions. Though U.S. labor markets are highly flexible, they are not perfect. Frictional unemployment generally emerges as displaced workers search for new jobs. This unemployment may be long-lived, particularly if the displaced workers lack marketable skills or live in declining regions. (Consider, for instance, the effects of reducing timber harvests to protect the spotted owl on small isolated logging towns in the Pacific Northwest.) However, the overall flexibility of U.S. labor markets, indicates that environmental programs generally do not produce severe, protracted frictional unemployment, though the existing tools of economic analysis do not permit reliable estimation of these transitional costs. In any case, the important
point is that the net short-run impact of tightening environmental standards is likely to be an increase overall unemployment in the process of shifting jobs within the economy.
In the longer run, after adjustment to regulation-induced demand shocks is largely complete, the total number of jobs in the economy will be primarily determined by overall macroeconomic conditions, which determine the balance between aggregate demand and the economy's productive capacity. Macroeconomic conditions are affected by, among other things, monetary and fiscal policies, changes in exchange rates, changes in foreign economic policies and economic conditions, and expectations of firms and households. With all these forces in play, there is no reason to expect changes in environmental policies to have any discernable effect on macroeconomic conditions and thus no reason to expect any detectable impact on aggregate employment after adjustment frictions have been overcome." Economic forecasters are right to concentrate on the behavior of the Federal Reserve, not the EPA, when they try to predict economy-wide employment and unemployment.
In terms of Figure 1, the conclusion is that tighter environmental regulation is much more likely to move the economy from U to a point like U', with at least comparable aggregate unemployment, than from U to a full-employment point like P'. There is absolutely no reason to expect tighter regulation to increase employment to offset the decline in measured productivity and living standards it will cause directly. Indeed, one can expect a short-run transitional decline in total employment.
In contrast to tightening regulation, increasing government spending on environmental projects without cutting spending elsewhere will tend to stimulate employment in the short run. Of course, spending on paving wetlands will have exactly the same sort of Keynesian
expansionary effects. In both cases, the net effect on short-run employment is likely to fall well short of the number of people directly employed, unless the economy is in a severe recession. Even then, most new jobs are not filled by the long-term unemployed.
Environmental Employment Levels
The notion that environmental protection can be a significant net source of jobs fails on empirical as well as logical grounds. A recent draft EPA study estimates that 662 thousand workers were directly employed in environmental protection activities in 1982.30 This was only 0.65 percent of total U.S. employment that year, only about a quarter of the average annual increase in U.S. employment between 1982 and 1990, and only about 60 percent of the decline in employment between 1990 and 1991.31 Indeed, to return to an example above, this is less than half the number of unemployed workers who found jobs between November and December 1988. Total direct and indirect employment, including those in construction and other industries engaged in supplying inputs for environmental protection, was estimated at 1.47 million, less than 1.5 percent of the economy-wide total. In short, plausible increases or decreases in employment associated with environmental protection will be swamped by other forces causing year-to-year changes in aggregate employment. Even if it were possible to increase total employment by
tightening environmental regulation, it would clearly take an incredibly dramatic -- and rapid
The Wrong Currency
None of the arguments in this section will generate surprise or controversy among economists who have thought about these issues. Environmental programs should be valued in terms of costs and benefits, not in terms of job creation and job destruction. The main reason jobs are nonetheless the standard currency in the political marketplace is the enduring appeal of
what a friend calls the political machine theory of employment: everybody is somebody's idiot relative and wouldn't have a job unless a politician provided it. Many politicians seem to find this theory congenial and, as President Clinton did in his Earth Day speech, eagerly take credit for any job creation and happily ignore all associated job destruction.3 2 On the other side of the
fence, the business community has long implicitly supported the political machine theory by looking for job destruction they could blame on heartless politicians and overzealous regulators. It should hardly come as a surprise that environmentalists now seek to hoist industry on its own petard by pointing to job creation associated with environmental regulation.
I am under no illusion that my critique of this popular political game will have much effect on the players. Still, the political machine theory is economic nonsense: the private sector, not the government, is the engine that drives the U.S. economy. Tightening environmental regulation generally reduces overall employment (to an unquantifiable extent) in the short run and has approximately zero net effect on employment beyond the short run.
INNOVATION AND INTERNATIONAL TRADE
Those who believe that environmental protection is a green free lunch assign great importance to the kinds of positive effects on innovation and competitiveness in world markets alluded to in President Clinton's Earth Day speech. As in the case of employment, however, the argument that these effects can be significant offsets to the real costs of environmental programs often rests on a variant of the political machine theory, on a fundamental confusion between creation and shifting.
In its simplest form, the innovation/trade strand of the free lunch argument goes more or less as follows. If we tighten our environmental standards, U.S. firms will develop new technologies to reduce the cost of meeting them. As other nations tighten their standards, those new technologies will translate into exports, particularly in the world market for environmental equipment. Thus, it is argued, innovation and trade can get us out of the static box depicted in Figures 1 and 3: the new technologies produced by regulation-induced innovation expand production possibilities, and trade permits us to profit handsomely from them.
Innovation Creation versus Innovation Shifting
The first step in this argument is basically correct: tightening environmental standards can increase the resources devoted by affected firms and their suppliers to seeking innovations that will lower compliance costs. Regulations that specify compliance technologies (e.g., by requiring electric utilities to use flue-gas scrubbers) can have just the opposite effect, of course, but performance standards and market-based approaches do reward cost-reducing innovation.
Businesses make research and development decisions, like other decisions, with an eye to profit. Under regulatory regimes that reward innovation, as firms find that environmental compliance accounts for a larger fraction of total cost, both they and their suppliers will find it more attractive to seek new, green technologies that reduce compliance cost through pollution abatement or prevention. Even if increased environmental innovation flows from such increases in research and development, however, it does not follow that there is a net economy-wide gain. It is useful to establish first that unless an affected firm is making systematic errors (a possibility considered below), even if tighter environmental standards induce innovation, they will
reduce the firm's profit." Suppose tighter standards induce a firm to undertake an R&D project with known cost to develop a new production or abatement technology that has lower compliance costs. For this project to represent induced innovation, it project must have been feasible but not optimal before standards were tightened. Since for any given technology tighter standards must reduce profit, it follows that profit with the new technology (net of R&D cost) and tight standards must exceed profit with the old technology and looser regulation." If firms were making systematic mistakes, of course, tighter standards might goad them into actions they should have taken anyway, and R&D projects sometimes yield much larger payoffs (and sometimes much smaller payoffs) than expected. But tighter standards cannot stimulate a firm that is not making systematic mistakes into undertaking a R&D project with an expected payoff that will raise profit above the initial level.
This argument does not apply to actual or would-be suppliers of affected firms. Stricter emissions standards for electric utilities, for instance, may very well both raise the profits of producers of emissions control equipment and increase their R&D budgets. Similarly, this
argument deals only with use of new technology by regulated firms, not with export sales. But it does serve usefully to bound the discussion.
The next and most important point is that there is no reason at all to think that tightening environmental standards will increase total, economy-wide private R&D effort.3 5 Firms' R&D efforts are shaped by all the challenges and opportunities they perceive. Changes in technologies, market conditions, or regulations can be expected to shift the optimal mix of R&D projects. But changes in challenges and opportunities do not in general lead to increases in innovative effort. If they did, since the world is constantly changing, we would observe a steady increase in the research intensity of the private sector over time, and we do not. Firms affected by tighter environmental regulation may shift scientists and engineers to work on green technologies or even increase their overall R&D budgets despite the short-run profit reduction that higher compliance costs imply. But it is unlikely that the scientists and engineers involved would otherwise have been unemployed or underemployed, and there is absolutely no reason to think that the total amount of R&D done in the economy is more likely to increase than to decrease. It accordingly seems most reasonable to assume that an increase in the stringency of environmental standards will simply produce a shift in private R&D spending to "green technologies" of various sorts from other products and processes, with no change in total economy-wide spending. Before taking up the general question of whether such a shift is likely to be on balance desirable, it is useful to deal first with the assertion that it can be expected to improve the U.S. balance of payments. Doing so serves to clear away some underbrush that often obscures the real issues.
Another Wrong Currency
For purposes of exposition only, suppose that tighter environmental regulation leads to increased innovation in green technologies and does not reduce innovation elsewhere in the economy. Suppose further that there is an open, growing world market for green technologies. Under these assumptions, it is likely that exports of products embodying new green technologies will increase and that the U.S. will be better off as a consequence. If the U.S. balance of payments improves as a consequence, however, the value of the net improvement is likely to be much smaller than the increase in green exports. Moreover, there is no guarantee that there will be any net improvement. Like jobs, exports are also the wrong currency.
Economists are generally agreed that the any nation's balance of payments is ultimately determined by the balance between domestic saving and investment, which in turn is affected by a host of macroeconomic forces, including in particular monetary policy and aggregate saving behavior.3" In the simplest model, an innovation that increases demand for U.S. green exports will simply produce an increase in the foreign exchange value of the dollar, which will make U.S. exports more expensive abroad and lower the prices of imported goods in the U.S. With macroeconomic conditions unaffected, other exports fall, imports will rise, and the original balance of payments will be restored." Because the dollar is more valuable, imports are correspondingly cheaper, and U.S. citizens are on balance better off. But this benefit is not measured by the balance of payments, which has not changed.
On the empirical side, the EPA has recently estimated that even though the U.S. led the world in exports of environmental protection equipment in 1991, such exports constituted less than one half of one percent of U.S. merchandise exports.3" By way of comparison, total U.S.
merchandise exports fell by about 8 percent per year between 1981 and 1983 and, despite a fall between 1984 and 1985, rose by over 9 percent per year between 1983 and 1991.39 Even if increasing exports of environmental protection equipment could improve the U.S. balance of payments dollar-for-dollar, anything but an implausibly enormous percentage increase would be swamped by the effects of all the other forces that determine the overall balance.
Effects of Innovation Shifting
Let us return to the most plausible starting point for further analysis and assume that tighter environmental regulation produces a shift of private research and development toward green technologies but does not affect the total level of private R&D spending. Focusing on real output and living standards, such a shift will produce an overall net gain only if the resulting pattern of spending is more profitable for the economy as a whole than the pattern private firms would have chosen without tighter regulation.
The fact that there is apparently considerable political support for such a shift says little about its economic merits. The U.S. government has not shown itself particularly skilled at picking winners among potential new technologies or at spending tax dollars to accelerate the commercialization of those it has selected. In general, government R&D decision-makers have not performed well relative to private firms operating without political constraints and with their own money on the line.40 Only strong faith and a willful disregard of history, or a strong belief
that the research involved is fundamentally different from other research, would lead one to believe that the government can nonetheless improve private R&D spending patterns as an almost incidental byproduct of enhancing environmental protection.
Some have indeed argued that research stimulated by environmental regulation is fundamentally different from other research.4' The contention is that tighter regulation will often induce research aimed at minimizing waste, and such research, though almost magical in its ability to reduce pollution and increase profit, is systematically neglected by U.S. firms.42 It is
perhaps worth noting at the outset that not all pollution is waste: NOx (oxides of nitrogen), for instance, is both a precursor of smog and a byproduct of efficient combustion. Thus even if this argument is correct, it does not apply to all environmental programs.
The argument that the private sector underinvests in research in waste reduction is generally supported by citing examples of a few private firms who have found such investments highly profitable.43 If it really is clear that others can travel this same road to profit, however, it is correspondingly unclear why tightening environmental standards is likely to be a more cost-effective means of inducing others to emulate those successful firms than further publicizing their experiences.
It is almost certainly true that some firms, here and abroad, were quicker than others to see profitable opportunities to innovate in this way. There are leaders and laggards in any line of research or development, however, and by itself this signifies nothing. There is no reason to think that U.S. firms have been slower to recognize ways of increasing profit by reducing waste than, for instance, ways of increasing profits by reducing labor usage. Indeed, the widespread recent flattening of U.S. business organizations suggests the long-term neglect of major opportunities for reductions in the cost of middle management. But only if there is are good reasons to think that barriers to innovation and lags in its diffusion are unusually and inefficiently large as regards waste minimization is there any argument for using any of the instruments of
public policy to tilt private R&D spending in this direction. To my knowledge, no such reasons have been advanced.
A glance at what is known about the world market for environmental technologies supplies further reason for doubting that the private sector is grossly underinvesting in green research. As in any other market, there is no guarantee that green R&D will produce workable new technology or that such technology can be protected from imitation. The idea of creating emissions inventories to facilitate efficient emissions reduction, for instance, is now very firmly in the public domain, as is the notion that pollution prevention can be profitable.
As noted above, the world market for environmental technologies is small. While this market is generally expected to grow, it is important to recognize that its evolution will depend critically on political decisions by foreign governments, so there is an element of political risk not present in many other markets. If the U.S. leads in making standards tough, there is always a risk, particularly if U.S. standards don't make cost-benefit sense, that foreign governments will not soon adopt similar standards. Thus, no other nation is rushing to adopt a Superfund program even resembling ours in scope or form." Until foreign governments adopt similar standards, U.S. firms will be disadvantaged in international competition without any offset from exports of innovative environmental technologies. If foreign governments follow with a long lag, U.S. firms may find themselves locked into compliance technologies made obsolete by subsequent research. If they never follow, domestic firms will remain disadvantaged indefinitely.
To be clear, despite all these risks and uncertainties, research on environmental products and environmentally benign technologies that is stimulated by tight environmental standards can on occasion be highly profitable. My point is simply that there is no reason to think that it is
likely to be more profitable on average than the R&D that private firms would have chosen to do without the prod of government regulation. Because tighter environmental regulation is unlikely to increase total private innovative effort, it then follows that one can at best be agnostic about the possibility of any net innovation-related benefit of environmental regulation that might
in part offset its substantial direct and indirect costs.
The Porter Critique
A one-page informal essay by Michael Porter is often cited as showing that Porter supports the innovation/trade argument for a green free lunch, but I believe this interpretation is a bit strained.4 5 This essay is clearly an extension of Porter' massive study The Competitive
Advantage of Nations, in which he argues that particular national industries generally enjoy
sustained prosperity on world markets only when they have qualitatively superior products, processes, or inputs (particularly skilled labor) and when they engage in relentless improvement. He finds that sustained prosperity requires sustained innovation. Firms or industries can of course enjoy short-run profits by having lower input costs (particularly labor costs) than others. Those profits will disappear as soon as production shifts to even lower-wage areas or more efficient technologies, however, and national prosperity cannot be built on permanently low wages. Similarly, true prosperity cannot be built on a national policy of offering the waste disposal services of the environment to firms on terms that do not reflect the damages done by pollution. As many have argued, any apparent prosperity that might result from such a strategy would merely reflect shortcomings in the GDP accounts.6
Thus Porter stresses, and I agree, that a national policy of trying to remain competitive in world markets by having looser environmental standards than our competitors would be undesirable because it could, at best, produce short-lived profits. Porter seems to feel that such a policy was being pursued in the early 1990s and that U.S. competitiveness in environmental technology suffered as a result. In fact, the United States is and has been a world leader in environmental standards and in both gross and net exports of environmental protection equipment.4 Thus a good deal of Porter's fire appears to be directed at a target that simply isn't there.
Porter seems to be addressing the business community as well as public policy-makers, however. His message to this audience appears to be that the social and political demand for environmental protection is unlikely to diminish and that "Just Say No!" is unlikely to be the profit-maximizing response strategy, particularly for firms committed to the sort of sustained innovation necessary to be and remain competitive in world markets over time. It is difficult to disagree with this message.
Porter contends that induced innovation will generally offset, at least in part, the cost to individual firms of complying with environmental regulation. Though this may be true, as I argued above, a regulation-induced shift in the pattern of innovation is unlikely to provide a net offset for the economy as a whole. I find Porter easier to agree with when he argues that environmental "standards must be sensitive to the costs involved and use market incentives to contain them."48 He is also correct to stress that environmental standards "must not constrain the technology used to achieve them, or else innovation will be stifled." Traditional command and control regulation not only raises overall compliance cost, it favors least-common-denominator
compliance and may remove any incentive to search for economic ways to meet or beat the standard. While environmental regulation is unlikely to stimulate innovation that will outweigh its cost, there is surely no reason to shackle the power of research by unnecessarily restricting compliance options.
CONCLUSIONS
Broadly speaking, both quotations at the start of this essay are correct: strict environmental protection is compatible with economic growth and prosperity. Those who argue that caring responsibly for our environment will necessarily bankrupt us are as wrong as those who argue that it will magically make us rich. We are a wealthy nation and can afford to spend the many billions it takes to preserve the environment for ourselves and our children.49 But,
despite the recent popularity of green free lunch assertions, compatibility between a growing economy and a healthy environment is not automatic; it requires sound environmental policies. Environmental protection consumes valuable resources and lowers measured productivity and living standards. Tighter environmental standards will not reduce unemployment or automatically increase exports, competitiveness, or economy-wide technical progress. As common sense suggests, we cannot regulate ourselves to prosperity. Rather than pretend that environmental protection is a green free lunch, we should acknowledge its substantial cost, recognize that this cost is ultimately paid by real people, not abstract corporations, and try to get as much as possible for our money. This means using market-based incentives whenever possible instead of rigid command and control regulation. It also means choosing environmental
objectives carefully and rejecting programs for which real, substantive benefits, quantifiable and nonquantifiable, fall short of costs.
Despite some recent rhetoric, trying to "create jobs" or "become competitive" by digging holes and filling them up again or by wasting money on unproductive environmental programs is not the way to build or maintain a world-class economy. It is certainly not the way to ensure that our grandchildren will enjoy both high living standards and a healthy environment.
Table 1
Estimated 1990 Direct Environmental Costs and Expenditures,
Percentages of GDP
Costs: Expenditures:
Medium EPA EPA BEA
Air Water
Land and Other
0.59
0.88
0.63
0.42 0.68 0.83 0.55 0.70 0.42 Solid Waste Hazardous Waste LUST SuperfundOther
Total 0.37 0.09 0.07 0.04 0.07 2.110.34
0.14
0.16
0.08
0.11
1.93 1.67Sources: EPA cost and expenditure estimates in 1986 dollars are from Tables 8-3A and 8-19A
of U.S. Environmental Protection Agency, Environmental Investments: The Cost of a Clean
Environment (Washington, D.C.: U.S. Environmental Protection Agency, November 1990).
"Present implementation" is assumed, and costs are obtained by EPA from expenditures by annualizing investment outlays at a 7% discount rate. BEA expenditure estimates in 1987 dollars and the price indices to convert the EPA numbers to 1987 dollars were taken from Table 7 of G.L. Rutledge and M.L. Leonard, "Pollution Abatement and Control Expenditures, 1987-91,"
Survey of Current Business (May 1993): 55-62. GDP in 1987 dollars was taken from the 1993 Economic Report of the President.
Table 2
Inter-Industry Differences
in Private,
Allocable Pollution
Abatement Expenditures,
1990
Percent of Private, Non-farm Private, Allocable Pollution Abatement Expenditures Industry/Aggregate GDP Employment Percent of Total Percent of GDP Per employee (k$) Paper & allied products 0.98 0.76 5.02 5.39 $3.589 Chemicals & allied products 2.17 1.18 11.22 5.43 5.157 Petroleum & coal products 0.77 0.17 7.20 9.79 22.472 Stone, clay, glass products 0.53 0.60 1.18 2.33 1.059 Primary metal industries 0.91 0.82 4.92 5.66 3.265 Transportation equipment 2.34 2.15 33.01 14.77 8.308 Electric utilities 3.37 0.69 9.24 2.87 7.252 Industries listed above 11.07 6.38 71.80 6.80 6.104 Manufacturing, mining, & electric utilities 26.32 21.08 82.71 3.29 2.126 Total private, non-farm 100.00 100.00 100.00 1.05 0.542 Sources: Pollution abatement capital spending and operating cost from Pollution Abatement Costs and Expenditures, 1990; electric utility operating costs and fuel differential, and total private business current and capital account spending for plant and equipment in 1990 dollars from unpublished BEA estimates; motor vehicle abatement costs (allocated to transportation equipment) and industry gross product originating data from the May, 1993 Survey of Current Business; employees from the March, 1991 Employment and Earnings. Spending per employee is in thousands of 1990 dollars. About 55 percent of BEA-estimated pollution abatement expenditures are covered; major unallocated expenditures include those related to sewer systems, regulation and monitoring, and research and development.Table 3
Ratios of Actual (Partial Equilibrium) Social Cost
to Measured Environmental Expenditures
Percentage
Increase in Demand Elasticity
Unit Cost 0.5 1.0 2.0 4.0 1.01 1.03 1.06 1.12 1.03 1.06 1.12 1.33 1.06 1.12 1.33 3.00 1.12 1.33 3.00 c0
Source: Let the demand curve be
Q
= a -bP, where a and b are positive constants, let C be theinitial constant unit cost (equal to price under competition), and let X be the increase in unit cost mandated by environmental regulation. Assuming both initial quantity,
Q
0 = a -bC, and finalquantity,
Q,
= a - b(C+X), are positive, measured expenditure is XQ,, and total cost (lostconsumers' surplus) is X(Qo +
Q,)/2.
(The absolute value of) demand elasticity at the initial price is E = bCIQo. The ratio of social cost to measured expenditure under these assumptionsis [1 - .E(X/C)]/[1 - E(X/C)]. When demand elasticity is 4.0 and unit cost is increased by 40
Table 4
Inter-Industry Differences in Pollution Abatement (PA)
Capital Expenditures, 1990
PA Investment Percentage Share of as a percentage of Industry/Aggregate Total Investment PA Investment Total Investment Paper & allied products 1.84 10.48 9.95
Chemicals & allied products 2.59 18.06 12.18 Petroleum & coal products 0.71 8.94 22.05 Stone, clay, glass products 0.46 1.24 4.67
Primary metal industries 0.99 4.87 8.62
Transportation equipment 1.80 3.85 3.74
Electric utilities 6.69 20.58 5.38
Industries listed above 15.08 68.03 7.88
Manufacturing, mining,
& electric utilities 25.60 81.84 5.58
Total private business 100.00 100.00 1.75
Sources: Industry data are from Pollution Abatement Costs and Expenditures, 1991; total business
capital account pollution abatement spending for plant and equipment is an unpublished BEA estimate; total gross private non-residential fixed investment is from the 1993 Economic Report
of the President. Spending for acquisition of motor vehicle emission abatement devices is
excluded, along with investments by agricultural and residential (septic systems) business; about 60 percent of business capital account spending for pollution abatement is included.
Figure 1
Protecting the Environment Lowers
The Capacity to Meet Other Demands
A
Burgers
Figure 2
Business Capital Account Spending on Pollution Abatement as a
Percentage of Gross Private Fixed Nonresidential Investment
Year 5 4.5 4 3.5 3 2.5 2 1.5 1 0.5 SI I I I I I i I i I t I i '
Figure 3