HAL Id: hal-02011117
https://hal.archives-ouvertes.fr/hal-02011117
Submitted on 7 Feb 2019
HAL is a multi-disciplinary open access
archive for the deposit and dissemination of
sci-entific research documents, whether they are
pub-lished or not. The documents may come from
teaching and research institutions in France or
abroad, or from public or private research centers.
L’archive ouverte pluridisciplinaire HAL, est
destinée au dépôt et à la diffusion de documents
scientifiques de niveau recherche, publiés ou non,
émanant des établissements d’enseignement et de
recherche français ou étrangers, des laboratoires
publics ou privés.
Integration of fiber Bragg grating temperature sensors
in plasma facing components of the WEST tokamak
Yann Corre, Guillaume Laffont, Christine Pocheau, Romain Cotillard,
Jonathan Gaspar, Nicolas Roussel, Mehdi Firdaouss, J.L. Gardarein,
Dominique Guilhem, Marc Missirlian
To cite this version:
Yann Corre, Guillaume Laffont, Christine Pocheau, Romain Cotillard, Jonathan Gaspar, et al..
In-tegration of fiber Bragg grating temperature sensors in plasma facing components of the WEST
tokamak. Review of Scientific Instruments, American Institute of Physics, 2018, 89 (6), pp.063508.
�10.1063/1.5024514�. �hal-02011117�
AUTHOR QUERY FORM
Journal: Rev. Sci. Instrum. Please provide your responses and any corrections by annotating this PDF and uploading it according to the instructions provided in the proof notification email.
Article Number: 069806RSI
Dear Author,
Below are the queries associated with your article. Please answer all of these queries before sending the proof back to AIP.
Article checklist:In order to ensure greater accuracy, please check the following and make all necessary corrections before returning your proof.
1. Is the title of your article accurate and spelled correctly?
2. Please check affiliations including spelling, completeness, and correct linking to authors. 3. Did you remember to include acknowledgment of funding, if required, and is it accurate?
Location in article
Query/Remark: click on the Q link to navigate
to the appropriate spot in the proof. There, insert your comments as a PDF annotation.
Q1 Please check that the author names are in the proper order and spelled correctly. Also, please ensure that each author’s given and surnames have been correctly identified (given names are highlighted inredand surnames appear inblue).
Q2 We have reworded the sentence beginning “The sensors used in...” for clarity. Please check that your meaning is preserved.
Q3 We have reworded the sentence beginning “Although the accuracy of...” for clarity. Please check that your meaning is preserved.
Q4 In the sentence beginning “In remote areas...,” please suggest if “path” can be changed as “pass.”
Q5 Please reword the sentence beginning with “As the completion...” so that your meaning will be clear to the reader.
Q6 Please define SGL at first occurrence.
Q7 In the sentence beginning “the main issues are...,” please check the usage of “in one side” and “in the other side” for clarity.
Q8 We have reworded the sentence beginning “Standard multiplexed FBGs...” for clarity. Please check that your meaning is preserved.
Q9 In the sentence beginning “The thermal condition...,” please confirm that “the previous section” refers to Sec. III.
Q10 In the sentence beginning “The temperature is first...,” please check the usage of “heating is switch-off” for clarity.
Q11 Please check the definition of CAD.
Q12 In the sentence beginning, “The overall is...,” please check the usage of the word “overall.”
Q13 In the sentence beginning “Among the tested...,” please check and suggest if the phrase “temperature furnace” can be changed to “furnace temperature.”
Q14 In the sentence beginning with “After the test and...,” please check the usage of “standalone” for clarity.
Q15 Please reword the sentence beginning with “The full FBG system...” so that your meaning will be clear to the reader.
Q16 In the sentence beginning “The reflected power...,” please check the usage of “the two first” for clarity.
Q17 Please define TTBB at first occurrence.
Q18 In the sentence beginning “Figures 15(a) and...,” please check the usage of “temperature rise” for clarity.
Q19 Please define TCI at first occurrence.
Q20 In the sentence beginning “Such a temperature rise...,” please check the usage of “temperature rise” for clarity.
Q21 We have reworded the sentence beginning “Four high temperature...” for clarity. Please check that your meaning is preserved.
Q22 We have reworded the sentence beginning “This work has been...” for clarity. Please check that your meaning is preserved.
Continued from previous page.
Q23 We were unable to locate a digital object identifier (doi) for Refs. 8, 10, 13, and 14. Please verify and correct author names and journal details (journal title, volume number, page number, and year) as needed and provide the doi. If a doi is not available, no other information is needed from you. For additional information on doi’s, please select this link: http//www.doi.org/.
Q24 Please confirm the page number in Ref. 17, as we have inserted the required information.
Q25 Footnote to the text is not allowed as per journal style. Therefore, we have added it to the reference list as Ref. 19 and updated the citations in text. Please check and confirm.
REVIEW OF SCIENTIFIC INSTRUMENTS 89, 000000 (2018)
Integration of fiber Bragg grating temperature sensors
in plasma facing components of the WEST tokamak
Y.Corre,1,a)G.Laffont,2C.Pocheau,1R.Cotillard,2J.Gaspar,1N.Roussel,2
M.Firdaouss,1J.-L.Gardarein,3D.Guilhem,1andM.Missirlian1
Q1
1CEA, IRFM, F-13108 Saint-Paul-lez-Durance, France 2CEA, LIST, Gif-sur-Yvette Cedex 91191, France
3Aix-Marseille Universit´e, CNRS, IUSTI UMR 7343, 13013 Marseille, France
(Received 1 February 2018; accepted 4 June 2018; published online XX XX XXXX)
Plasma Facing Components (PFC) temperature measurement is mandatory to ensure safe high power and long pulse tokamak operation. IR thermography systems which are widely used in magnetic fusions devices become challenged with the choice of tungsten as a PFC material in the ITER tokamak, mainly due to emissivity uncertainties and reflection issues in a hot environment. Embedded temperature measurements are foreseen to cross-check the IR thermography measurements. Fiber Bragg grating sensors are potentially of great interest for this application because they are immune to electromagnetic interference and allow the measurement of a large number of temperature spots on a single fiber. Four optical fiber temperature sensing probes, each of them including 11 regenerated fiber Bragg gratings equally spaced by 12.5 mm (equivalent to one ITER-like tungsten monoblock), have been specifically designed and manufactured for the WEST project (W-tungsten Environment and Steady State Tokamak). The four probes are embedded in W-coated graphite components at two different distances from the surface, 3.5 mm and 7 mm, to cover a wide range of temperatures up to 900
◦
C. This paper addresses the design and integration issues and the qualification and performance assessment performed in the laboratory. It also shows the first measurements of this new diagnostic achieved in a tokamak environment during baking of the machine and during early diverted plasma exposure. Published by AIP Publishing.https://doi.org/10.1063/1.5024514
I. INTRODUCTION
Fiber Bragg Gratings (FBGs) are well-established strain and temperature transducers finding numerous applications in both scientific and industrial fields.1They present great inter-est in the field of nuclear fusion research because they are immune to electromagnetic interference (EMI). FBG strain or temperature sensors are foreseen in the ITER tokamak in the magnet structure (temperature between 4.5 K and 300 K),2 in the helium cooled lithium lead Test Blanket Module3 and also in the vacuum vessel.4Such applications rely on specif-ically developed optical fiber-based sensors that should be tested in a real tokamak environment before integration in the ITER environment. FBG strain gauges and temperature sensors have successfully been developed and installed in the Joint European Torus (JET)5 and ASDEX Upgrade (AUG)6 tokamaks to measure forces induced on the vacuum vessel during disruption and deformation of the passive stabilizing loop induced during plasma experiment, respectively. In both cases, FBG sensors were fixed to components located in remote areas, not directly exposed to the plasma heat load: on the top and bottom vessel restraints support (legs) in JET and on the copper surface of the stabilizing loops in AUG. The Q2
sensors used in JET and AUG are therefore working mainly in the low temperature or medium range, typically below 400◦C; thereafter, the Bragg grating may vanish.7FBG tem-perature measurement beyond 400◦C is a challenging task
a)Author to whom correspondence should be addressed: yann.corre@cea.fr
and currently a major research topic. Among the various solu-tions considered to develop temperature-resistant FBGs, the regeneration process1 shows that the FBG can survive above 900◦C with long-term use (>9000 h). This is potentially of great interest to monitor the bulk temperature of the Plasma Facing Components (PFCs) and what we propose to test in the WEST (W-tungsten Environment and Steady State Tokamak) project.8
The WEST project consists in transforming the Tore Supra tokamak in an X-point divertor configuration while keeping its long pulse capability, in order to test the ITER divertor tech-nology.8The main goal is to test the actively cooled tungsten (W) Plasma Facing Units (PFUs) representative of the ITER divertor target9,10under high heat load (in the 10-20 MW m−2 range). In WEST, each PFU is composed of 35 W monoblocks of individual size 28 mm × 12 mm × 26 mm (width × depth × height) assembled with a gap of 0.5 mm on a CuCrZr heat sink tube.11 As the completion of the ITER-like target in WEST is expected to require more time than the tokamak platform, it is planned to start the operation in 2017 with a mix of actively cooled ITER-like PFUs made of tungsten and non-actively cooled PFUs made of graphite with a thin coating of tungsten (∼15 µm) in the lower divertor.12Under high heat load, the W-coated graphite component will rapidly heat, which affords an opportunity to test the regenerated FBG technology in a real tokamak environment with high temper-ature excursion (up to or beyond 1000◦C). Graphite is easy to machine, it is a low cost component, and it has no risk of crack formation such as tungsten after machining the space to
0034-6748/2018/89(6)/000000/10/$30.00 89, 000000-1 Published by AIP Publishing.
1 2 3 4 5 6 7 8 9 10 11 12 13 14 15 16 17 18 19 20 21 22 23 24 25 26 27 28 29 30 31 32 33 34 35 36 37 38 39 40 41 42 43 44 45 46 47 48 49 50 51 52 53 54 55 56 57 58 59 60 61 62 63 64 65 66 67 68 69 70 71 72 73 74 75 76 77 78 79 80
000000-2 Corre et al. Rev. Sci. Instrum. 89, 000000 (2018)
house the diagnostic (hole or groove). In order to test the feasi-bility to monitor the PFU bulk temperature, we have designed and manufactured 4 temperature sensors including 11 gratings. Probes are embedded in a side groove of the graphite compo-nent at two different distances from the surface. One groove is machined at 7 mm from the surface to test the FBG below 800◦C (lower FBG) and ensure the proper functioning of the FBG diagnostic and one groove at 3.5 mm to test the FBG beyond 800◦C (upper FBG) in order to find the maximum temperature threshold with the FBG system developed for WEST.
This paper is organized as follows. The diagnostic spec-ification, WEST environment, and thermal behavior of the W-coated graphite PFU are summarized in Sec.II. The FBG design and setup optimized according to the thermal behavior of the components, as well as the signal processing, are pre-sented in Sec.III. The integration of the fiber in the W-coated graphite PFU and the cabling through the tokamak environ-ment are presented in Sec.IV. The FBG system, standalone or mounted in the PFU, is tested and characterized in laboratory experiments with the thermostatically controlled water bath, tubular furnace, and halogen lamps (Sec.V). First experimen-tal results obtained during baking and early diverted plasma exposure with the FBG diagnostic installed in the WEST tokamak are presented in Sec.VI.
II. SPECIFICATION AND ENVIRONMENT OF THE WEST FBG DIAGNOSTIC
A. Diagnostic specification and requirements
The goal of the FBG diagnostic (called DTFIB#1) in WEST is to monitor the bulk temperature in order to (1) protect the component and its coating to avoid any excessive ther-mal dilatation and cracks formation,12(2) cross-calibrate the IR thermography system which is disturbed by the emissivity uncertainties and potential reflection in the hot environment,13 (3) compute the plasma heat load as depicted in Ref.14, and finally (4) test the feasibility to use an FBG system directly into the PFCs. In this context, the diagnostic specifications and requirements are defined as follows:
• The number of fibers to be installed in the tokamak is 4 in order to focus on the feasibility first and investi-gate the stability of the measurement at different toroidal locations, assuming that the heat load is the same (toroidal symmetry) before any further deployment in the machine which is foreseen after the completion of the full actively cooled divertor (DTFIB#2 project currently under progress).
• Temperature measurement is in the range of 70◦C
with-out any plasma (minimum temperature of the machine foreseen in ITER) and 1200◦C during plasma discharge. The accuracy of the system should be about 20◦C at high temperature.
• The size of the grating and positioning of the Bragg peaks in the spectral bandwidth have to be defined in order to measure the temperature gradient at the FBG sensor up to 45◦C/mm (because the plasma heat load is peaked on the surface14).
• The number of FBGs is 11 by fiber to cover the spa-tial extent of the plasma heat load along the W-coated graphite PFU. Each of them is equally spaced by 12.5 mm which is the typical width of W monoblocks in ITER.11
• The optical fiber should be free (to avoid any mechan-ical strain) and is inserted in a metallic capillary for protection during manipulation and also for the setting in the component (using graphite adhesive). The diam-eter of the capillary should be of the order of the mm to minimize the intrusive effect of the FBG on the thermal behavior of the component. The total fiber length from the sensors up to the sealing flange should be ∼3 m to reach the port flange (which is then connected to another optical fiber to join the electronic gallery where the FBG interrogator and acquisition system are based).
• The time duration of acquisition is expected to be cou-ple of minutes with the non-actively cooled components (plasma experiment will be limited in time to avoid excessive temperature of the component12). Data acqui-sition should be 10 Hz at minimum (set by the thermal time response of the graphite component and a relatively short time duration of the experiment expected before the completion of the fully actively cooled divertor). • The expected number of cycles during WEST phase I
(with inertial W-coated graphite PFUs) is 2000. The diagnostic must survive for about 2 years in the tokamak. • Acceptable degradation of the measurement (long-term drift) along the expected operation period is about 10◦. Most of these requirements were achieved or are expected to be feasible based on initial testing. Although the accu- Q3 racy of the measurement at high temperature and long-term drift cannot be evaluated yet, this would require high power and repetitive plasma experiments which are foreseen later on during the WEST experimental program.
B. WEST environment
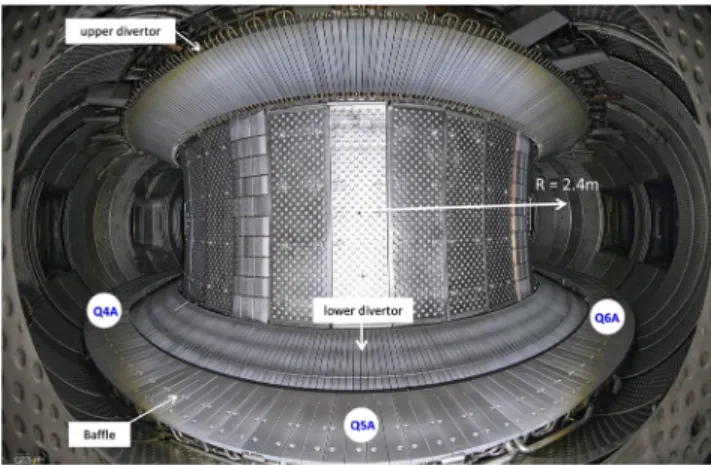
WEST is based on the “tokamak” concept of plasma magnetic confinement, in which the plasma is contained in a doughnut-shaped vessel (Fig.1). The plasma is kept away from
FIG. 1. Interior picture of the WEST tokamak showing the upper and lower divertor, the baffle, and port plug numbers (Q4A, Q5A, and Q6A).
81 82 83 84 85 86 87 88 89 90 91 92 93 94 95 96 97 98 99 100 101 102 103 104 105 106 107 108 109 110 111 112 113 114 115 116 117 118 119 120 121 122 123 124 125 126 127 128 129 130 131 132 133 134 135 136 137 138 139 140 141 142 143 144 145 146 147 148 149 150 151 152 153 154 155 156 157 158 159 160 161 162 163 164 165 166 167 168 169 170 171 172 173 174 175 176
000000-3 Corre et al. Rev. Sci. Instrum. 89, 000000 (2018)
the walls by strong magnetic fields produced by supercon-ducting coils surrounding the vessel and an electrical current driven in the plasma. WEST is characterized by a strong mag-netic field (3.8 T maximum) in the plasma chamber, a vacuum condition (of the order of 10−5 Pa), an ambient temperature
of 70◦C during plasma operation and 200◦C during baking,
thermo-mechanical displacement (up to few mm) and vibra-tion due to plasma instabilities, and radiavibra-tion exposure such as photons, neutral particles, and neutrons. The fuel—a mixture of deuterium and hydrogen, or helium—is heated to tempera-tures in excess of 50 × 106degrees in the core plasma. Contrary to ITER, WEST is a non-active tokamak device (there is no tri-tium injection), and therefore, it is not exposed to high nuclear radiation background. In WEST, the heat flux attributed to the plasma is of the order of 10 MW m−2 on targets. In remote areas, between the divertor and baffle where the cabling has to path through, the heat flux attributed to radiation and neutral particles is of the order of 10 kW m−2.15 The device should achieve steady-state and high power plasma operation up to 1000 s after the completion of the full actively cooled divertor target. The diagnostic sensor should be installed in the lower divertor, while the acquisition system (FBG interrogator) is located outside the vacuum chamber (after passing through the vacuum-tight access), in the electronic gallery about 50 m away from the machine.
C. WEST lower divertor and thermal behavior of the W-coated graphite PFUs
The Q4
lower divertor is made of 12 sectors of 38 PFUs each (each sector having 30◦toroidal extension). As the completion Q5
of the ITER-like target is expected to require more time than the tokamak platform, it is planned to start the operation in 2017 with 6 actively cooled ITER-like PFUs (in which three are manufactured by Japanese industrial and three by Chinese industrial) and 450 non-actively cooled PFUs made of graphite with a thin coating of tungsten (∼15 µm) in the lower divertor (see Fig.1). Each individual graphite PFU is divided into two
parts, the High Field Side (HFS) and Low Field Side (LFS) PFU. The size of the W-coated graphite PFUs is about 30 mm large, 26 mm thick (height), and 326 mm and 256 mm long for the HFS and LFS PFU, respectively. The FBG diagnostic is installed in the LFS PFU because the heat load is expected to be higher on this part. The material used is graphite R6710 from SGL(with the thermal conductivity of K ∼ 82 W m−1K−1 Q6 at T = 200◦C), and the W-coating is about 15 µm thick. Sur-face temperature should be limited to 1200◦C for standard operation and further (up to 1800◦C) for a limited number of experiments to avoid delamination of the W-coating.12
The thermal behavior of the W-coated graphite PFU is simulated with finite-element calculation performed with the ANSYS code, as depicted in Ref.14. The plasma heat load dis-tribution, qn(MW m−2), in the poloidal direction is computed
with the heuristic formulation (Gaussian-like distribution), built with IR thermography measurement during carbon-wall operation,16 qn(x) ∝ exp S 2λq !2 −x − x0 λqfx erfc S 2λq −x − x0 Sfx ! , where x is the position along the target, x0 is the strike point
position (i.e., the connection of the separatrix with the target), λqis the heat flux decay length parameter in the edge plasma region19at the outboard midplane (usually called the scrape-off layer width of the order of few mm size), S is the power spreading factor in the “private” region (i.e., the magnetically shadowed region), and fxis the magnetic flux expansion from
the outboard midplane to the PFU. The temperature distribu-tions reported at three different depths (surface, FBG upper, and FBG lower locations) in the graphite PFU located on the LFS are presented in Fig. 2 for the nominal high heat flux scenario (i.e., with peak heat load qn = 10 MW m−2) and
standard magnetic field configuration. After 5 s of heating, the surface temperature reaches almost 1400 ◦C, while the
bulk temperature is expected to be about 850◦C and 600◦C
at 3.5 mm (FBG upper) and 7 mm (FBG lower) depths,
FIG. 2. (a) Temperature profile at three different locations from the surface (z = 0, z = 3.5 mm, and z = 7 mm) on the W-coated graphite PFU located on the Low Field Side (LFS). After 5 s heating, the surface temperature goes up to almost 1400◦C, while temperatures reported at few mms away from the sur-face are lower (below 1000◦C). (b) The
poloidal section of WEST showing the magnetic flux surfaces, the inner wall, and the graphite PFU housing the FBG sensor. 177 178 179 180 181 182 183 184 185 186 187 188 189 190 191 192 193 194 195 196 197 198 199 200 201 202 203 204 205 206 207 208 209 210 211 212 213 214 215 216 217 218 219 220 221 222 223 224 225 226 227 228 229 230 231 232 233 234 235 236 237 238 239 240 241 242 243 244 245 246 247 248 249 250 251 252 253 254 255 256 257 258 259 260
000000-4 Corre et al. Rev. Sci. Instrum. 89, 000000 (2018)
FIG. 3. Schematic picture of FBG showing the transmitted and reflected spectrum.
respectively. The predicted plasma heat flux distribution leads to a very steep temperature gradient in the component, about 45◦C/mm and 25◦C/mm in the private flux region for the upper
and lower FBGs, respectively (at 3.5 mm and 7 mm below the surface). Such temperature gradients represent a challenge for the design of the multiplexed FBG; the main issues are the choice of the Bragg wavelengths in one side and the position and length of the FBG in the other side.
III. FBG DESIGN AND SETUP FOR WEST A. Multiplexed FBG design for WEST
A FBG Q7
consists of a spatially periodic modulation of the refractive index created along a desired length of the core of an optical fiber. A narrow spectral band of the incident light within the fiber is reflected by successive coherent scattering from the index variations.17The strongest interaction or mode coupling occurs at the Bragg wavelength given by
λB= 2 neΛ,
where ne is the effective index of refraction (∼1.46) and Λ
is the grating period. This leads to a single peak and valley in reflected and transmitted light through the optical fiber (as shown in Fig.3). The principle of the strain or temperature measurement is based on the determination of the wavelength shift of the Bragg peak reflected by the grating that is induced by the changes of the grating period and by the thermo-optic and elasto-optic coefficients. This “peak tracking” function is ensured by using the FBG interrogator device using a wave-length tunable laser and logarithmic trans-impedance circuits for the photo-detection. The most commonly used method to write the FBG on the fiber core is based on conventional interferometric setup with ultraviolet light taking advantage of the photosensitivity of the germano-silicate optical fiber. Multiplexed FBG aims to daisy chain multiple sensors with
different Bragg wavelengths (chosen in the spectral bandwidth of the tunable laser) in order to get simultaneous measurements at different locations along a single optical fiber. Standard multiplexed FBGsfor temperature measurements are commer- Q8 cially available below 500◦C; thereafter, Bragg grating may
vanish due to the erasure of the photowritten refractive index modulation. One way to extend the temperature measurement range is the regeneration process which allows increasing the temperature measurement beyond 900◦C, while keeping good metrological performances.1 Thethermal condition foreseen Q9 in WEST and depicted in Sec.III(Fig.2) requires the develop-ment of specific multiplexed and regenerated FBG temperature sensors. This has been carried out in the CEA List Institute which is committed to technological innovation in digital sys-tems including architecture, hardware, and software applied to embedded systems.
The FBG diagnostic developed in WEST is equipped with an industrial multichannel FBG interrogator, based on a wave-length tunable laser, featuring full spectrum analysis with data rate at 10 Hz. The spectral bandwidth available to encode the FBG array is 120 nm covering the wavelength range from 1500 up to 1620 nm with a spectral resolution of 8 pm. In such a wavelength range, the thermal response of the Bragg shift varies from 10 pm/◦C at 50◦C up to 20 pm/◦C at 800◦C (as derived from the calibration curves), and the average value is of 14 pm/◦C. To cover the 70-1200◦C temperature range expected in the bulk of the W-coated graphite PFU, the max-imum shift of the Bragg peak is 15.8 nm. Due to the limited spectral bandwidth available, it was not possible to include 11 FBG arrays with such a gap between each FBG. The maxi-mum temperature gradient expected between two consecutive FBGs is about 500◦C, which corresponds to about 7 nm shift
of the Bragg peak. The Bragg wavelengths of two consecutive FBGs are therefore spatially spaced by 7 nm to avoid spectral overlapping. The Bragg wavelengths at room temperature are given in TableI.
The typical size of the gratings is about 3 mm, and the space between two consecutive FBGs is 12.5 mm. The eleven 12.5 mm spaced FBGs are simultaneously regenerated using a high-temperature annealing process, as depicted in Ref.1. The process is performed with a homemade tubular furnace and uses a thermocouple near the FBG in order to control the temperature during the thermal treatment. During the regen-eration protocol, the temperature of the furnace is raised to 920 ◦C which is the point triggering the regeneration for all the multiplexed FBGs. The full process, FBG photowrit-ing, followed by the regeneration process, has been applied successfully to the four dedicated temperature probes. The FBGs are photowritten onto a 150 µm diameter single-mode polyimide-coated silica-glass optical fiber inserted within a 1 mm diameter metallic capillary hermetically sealed at its extremity. The reflected spectrum measured at 70 ◦C
TABLE I. Bragg wavelengths of the FBGs at room temperature.
FBG #1 #2 #3 #4 #5 #6 #7 #8 #9 #10 #11 λBragg(nm) 1512 1519 1526 1533 1540 1547 1554 1561 1568 1575 1582 261 262 263 264 265 266 267 268 269 270 271 272 273 274 275 276 277 278 279 280 281 282 283 284 285 286 287 288 289 290 291 292 293 294 295 296 297 298 299 300 301 302 303 304 305 306 307 308 309 310 311 312 313 314 315 316 317 318 319 320 321 322 323 324 325 326 327 328 329 330 331 332 333 334 335 336 337 338 339 340 341 342 343 344 345 346 347 348 349 350 351 352
000000-5 Corre et al. Rev. Sci. Instrum. 89, 000000 (2018)
FIG. 4. Reflected spectrum as measured by the upper FBG installed in the WEST tokamak with a coolant loop at 70◦C.
(the standard temperature of the machine before plasma opera-tion) is presented in Fig.4for one of the two upper FBGs (once regeneration has been realized). Even if the overall reflected signal is low due to the regeneration process, the Bragg peak is about 5 dB higher than the baseline which is enough for peak detection. The baseline reflected light also shows some fluc-tuation attributed to back (Fresnel) reflection at the extremity of the fiber.
B. Signal processing and temperature calibration
The first step which further defines the accuracy of the temperature measurement is to get the position of the Bragg peaks in the experimental spectrum (see Fig. 3). For each FBG, the peak is detected using a Gaussian-shape function (non-linear regression) combined with data filtering and ampli-fication due to the relatively low reflectivity of the gratings and the Fresnel reflection introduced at the extremity of the fiber. The following step is the temperature calibration of the sensing line. The sensing lines are positioned in a high temper-ature furnace together with a bundle of thermocouples to get the temperature distribution along the furnace. The
Q10
tempera-ture is first raised to 800◦C, and then heating is switch-off in order to get a slow and regular temperature decrease. The log-arithm decrease in the furnace temperature is fitted for all the Bragg wavelengths using a fifth-order polynomial function. Figure5shows the 11 calibration curves, one curve for each
FIG. 5. Calibration curve for one of the 4 sensing lines developed and manufactured for WEST.
FBG, for one of the four sensing lines developed for WEST. Above 800◦C, the calibration curve can be extrapolated based on the polynomial function.
IV. INTEGRATION OF THE FBG DIAGNOSTIC IN WEST
A. Integration in the W-coated graphite PFU
The FBG temperature probe is inserted in the LFS graphite PFU through a 4 mm deep 1.2 mm thick lateral groove, as shown in Fig.6(a). The probe has a diameter of 1 mm (due to the capillary), is 150 mm long, and has curvature of R = 62 mm downward toward the pumping duct [Fig.6(b)]. The 4 mm deep lateral groove is shown in Fig.6(c) for the upper FBG (the center located at 3.5 mm from the surface). The temperature probe is fixed to the component with graphite adhesive made for use up to 1300◦C. After assembling of the instrumented
PFU, the connector is clamped to the divertor support plate to prevent any excessive vibration and stresses on the graphite adhesive. A stainless steel box is finally used to protect the overall system from accidental impact during the introduction of the fully equipped divertor sector into the machine. The computer aided design (CAD) view and picture of the FBG Q11 system after assembling are presented in Fig.7. The deploy-ment of the FBG system in WEST is based on one set of two optical fibers, upper and lower FBG which are installed in two adjacent PFU, duplicated in two different divertor sectors (each sector having 30◦toroidal extension).
The four temperature probes are connected to a 3 m long optical fiber with a protective sheath made of PEEK compos-ite, one of the few plastics compatible with high vacuum and high temperature applications. The overall isprotected by a Q12 flexible stainless steel creased hose Ø = 2.3 mm, up to the sealing flange. In the region between the stainless steel box and the entrance of the pumping duct, the flexible stainless steel creased hose might be exposed to plasma radiation and neutral particles up to 10 kW m−2, as shown in Ref.15which is acceptable for the temperature behavior of the cable. Each sensing line is connected to a vacuum feedthrough (10−8mbar l/s) located few meters below the machine. At the outside of the vacuum vessel, the system is connected to the FBG inter-rogator and acquisition system with a 60 m long remote fiber cable (see Fig.8).
353 354 355 356 357 358 359 360 361 362 363 364 365 366 367 368 369 370 371 372 373 374 375 376 377 378 379 380 381 382 383 384 385 386 387 388 389 390 391 392 393 394 395 396 397 398 399 400 401 402 403 404 405 406 407 408 409 410 411 412 413 414 415 416 417 418 419 420 421 422 423
000000-6 Corre et al. Rev. Sci. Instrum. 89, 000000 (2018)
FIG. 6. Fabrication plan for the FBG upper diagnostic embedded in a 1.2 mm diameter lateral groove at 3.5 mm below the surface. (a) Drawing showing the sensing line integrated in the W-coated graphite component (side view). (b) Full fiber including the 150 mm long sensing line and the connection part, followed by a 3 m flexible capillary to reach the seal-ing flange. (c) Drawseal-ing of the W-coated graphite component showing the lateral groove (back view).
FIG. 7. (a) CAD view showing the FBG upper system (located 3.5 mm below the surface). (b) Picture showing the FBG lower (located 7 mm below the surface) after installation on the sector.
FIG. 8. Overview of the DTFIB#1 diagnostic as deployed in WEST includ-ing drawinclud-ing of the lower divertor, pump-ing duct, and sealpump-ing flange followed by a schematic view of the data acquisition system. 424 425 426 427 428 429 430 431 432 433 434 435 436 437 438 439 440 441 442 443
000000-7 Corre et al. Rev. Sci. Instrum. 89, 000000 (2018)
FIG. 9. Averaged temperature measurement performed by the FBG system, including FBG upper (located 3.5 mm below the surface) and lower (7 mm below the surface) optical fibers further duplicated in two different divertor sectors (named Q3A and Q4A, each sector having 30◦toroidal extension), fully immersed in thermostatically controlled water bath at 80◦C.
V. TEST AND QUALIFICATION OF THE WEST FBG DIAGNOSTIC
The full multiplexed FBG system has been manufactured by the CEA List Institute and delivered in June 2016. The sys-tem has been tested in the laboratory before the implementation in the tokamak. The laboratory tests include three successive experiments to characterize the performance of the system: a thermostatically controlled water bath, high temperature fur-nace, and fully instrumented PFU with a set of six halogen lamps.
A. Thermostatically controlled water bath
The four sensing lines are fully immersed (without any component), one after the other, in a thermostatically con-trolled water bath at 80◦C. The results obtained for each of the 44 FBGs are presented in Fig.9. The standard deviation obtained at 80◦C is ±5◦, and the temporal variation is below
0.4◦which is consistent with the specification of the system.
B. High temperature furnace
The FBGs are tested successively (without any compo-nent) in a high temperature tubular furnace at the atmospheric pressure. Type-N TCs are used to get the temperature in the furnace with a temperature stability of ±1◦C. The furnace is
open at the extremity on the entrance side; therefore, the tem-perature is close to the setpoint value at the bottom and lower at the entrance sides, respectively. The experimental setup and results obtained for a set of three FBGs are presented in Fig.10. In the experiment presented here, the instruments are intro-duced in the furnace for about 150 s at 250◦C. The overall
dynamic of the TC/FBG measurements is coherent during the transitory phase. FBG#11 heats up first, followed by FBG#8 and #6, as we introduce and take away the sensors (slow move-ment) in the furnace. After their introduction, the FBG fiber and TC are rapidly thermalized with the furnace and the steady state condition is almost reached. The TC measurements are coherent with the positioning; we found 243◦C at the bot-tom, 240◦C in the middle, and 228◦C close to the entrance. Although the overall dynamic is well reproduced with the FBG measurements, the absolute values given by FBG are slightly different from TC: FBG#11 shows 10 ◦C discrepancy with
the TC, while FBG#8 shows less than 1◦ and #6 less than
3 ◦C along the temperature excursion. Such a discrepancy
can be attributed to sensor positioning in the furnace, ther-mal convection in the furnace which is open at the entrance, or FBG calibration and accuracy of the system itself. Amongthe Q13 tested FBGs, the maximum discrepancy is found to be 10◦C with a temperature furnace of 250◦C which is, nonetheless, consistent with the specification of the system.
C. Fully instrumented PFUs heated with halogen lamps
After the test andcharacterization of the four FBG sys- Q14 tems standalone, the FBG probes are then fixed in the lateral grooves of the W-coated graphite PFUs with graphite adhesive. The fully instrumented PFUs are tested in the laboratory using halogen lamps. Besides the four FBG instrumented PFUs, a fifth PFU is used with 4 embedded thermocouples to derive the thermal time constant of the two systems, the TC and FBG fibre, in the material. The halogen lamp system delivers about 4 kW m−2continuous and quasi-homogeneous power on each target. The five PFUs are pre-heated to about 80◦C (which is slightly above the nominal temperature of the water cooling system in WEST), this is followed by a 10 min switch-off of the power to thermalize the component, and then we apply successive 30 s-on, 150 s-off power steps to compute the time response of the different diagnostics (τdiag). The experimental
setup is presented in Fig.11(a)and the measurements are pre-sented in Fig.11(b)for TC and one FBG probe. We report very good dynamic behaviors of the different systems and accurate
FIG. 10. (a) Picture of the experimental setup before the introduction of the TC and FBG sensors into the tubular furnace. (b) TC and FBG temperature measurements at three different locations (FBG #6, #8, and #11) with a set point temperature of 250◦C. 444 445 446 447 448 449 450 451 452 453 454 455 456 457 458 459 460 461 462 463 464 465 466 467 468 469 470 471 472 473 474 475 476 477 478 479 480 481 482 483 484 485 486 487 488 489 490 491 492 493 494 495 496 497 498 499 500 501 502 503 504 505 506 507 508 509 510 511 512 513 514 515 516 517 518 519
000000-8 Corre et al. Rev. Sci. Instrum. 89, 000000 (2018)
FIG. 11. (a) Picture of the experimental setup with FBG and TC embedded in the W-coated graphite PFUs and halogen heating system. (b) Temperature excursion dur-ing 30 s heatdur-ing steps of the PFUs as measured with TC (yellow signal) and one FBG probe (11 spots measure-ments).
measurement of the relative heating (∆T = 2◦C during each power step). However, we also report about 8◦C discrepancy between the two extreme FBGs temperature measurements, similar to the previous experiment. TC data (yellow curve) are slightly lower than FBGs data because the fifth PFU includ-ing the TC is slightly out of the center of the beam light [at the bottom as shown in Fig. 11(a)]. The time response of the diagnostic is determined with 2D FEM thermal model-ing of the component. The heatmodel-ing is assumed to be uniform along the PFU (the x direction) so that the geometry can be simplified in the toroidal-vertical plan (y, z). The numerical temperature reported at the sensor location is convoluted to the temporal step response of the full system (component with the instrument),
u(t)= 1 − e− t
τdiag,
where τdiagis the time response of the system which is
esti-mated with a Particle Swarm Optimization (PSO) algorithm18 in order to minimize the residuals between the model and the measurement. We found τdiag= 250 ms with ±50 ms standard
deviation attributed mainly to the lighting up and electrical stability of the lamps.
VI. BAKING AND EARLY DIVERTED PLASMA EXPOSURE
The
Q15 full FBG system has been installed in the WEST toka-mak beginning of 2017, before the first plasma breakdown attempts. The system is working properly for more than one year, and we have been able to investigate the variation of tem-perature during the baking of the machine and during early
FIG. 12. Reflected power as a function of the wavelength at 70◦C (red) and
during baking at 185◦C (green), focus on the first and second FBG.
diverted plasma exposure. During baking, the water cooling system is raised up to 185◦C in order to remove the remain-ing gas from the wall. As a consequence, the temperature is similar in all the PFUs of the divertor. This provides the oppor-tunity to check the FBG temperature measurement in a real tokamak environment by comparing the results with the set of 20 embedded TCs also available in the W-coated graphite PFUs. The reflected powerpassing through one of the FBG Q16 probes and measured by using the spectrometer is presented in Fig.12with a specific focus on the two first FBG #1 and #2. The resulting signal is about 4 dB above the baseline signal of the spectrum and therefore adequate to detect the position of the Bragg peak. The shift of the Bragg peak measured during baking is also illustrated.
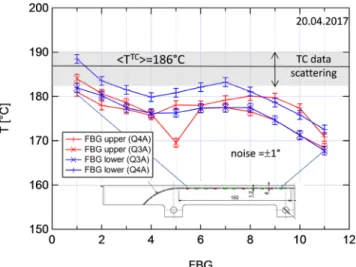
The temperature measurements of the four FBG probes during baking (performed in April 2017) are presented in Fig.13together with the average of the TC measurements. The averaged value for the 44 FBG measurements is hTFBGi
= 177.6◦C, while the TC averaged value is hTTCi= 186◦C,
close to the water temperature. This shows that FBG measure-ments have an offset of 10◦C lower than expected. Data
scat-tering of the FBG measurements is about ±10◦C around the
averaged value. These discrepancies are attributed to the FBG calibration and peak detection algorithm which are currently under review to improve the data processing (some fluctuation of the baseline signal of the spectrum is observed and attributed
FIG. 13. Temperature measurement with FBG located in two different diver-tor secdiver-tors (named Q3A and Q4A, plotted with cross and plus signs, respec-tively) and TC systems during baking. FBG upper (3.5 mm below the surface) and lower (7 mm below the surface) are plotted in red and blue, respectively.
520 521 522 523 524 525 526 527 528 529 530 531 532 533 534 535 536 537 538 539 540 541 542 543 544 545 546 547 548 549 550 551 552 553 554 555 556 557 558 559 560 561 562 563 564 565 566 567 568 569 570 571 572 573 574 575 576 577 578 579 580 581 582 583 584 585
000000-9 Corre et al. Rev. Sci. Instrum. 89, 000000 (2018)
FIG. 14. Temporal evolution of the temperature during the cooling down, from baking of the machine down to 70◦C, as measured by FBG upper (a) and lower (b).
FIG. 15. Heating measured with the FBG lower (a) and embedded thermocouples diagnostics (b) during early WEST diverted plasma exposure (#52693). The diverted plasma expo-sure lasts for about 7.2 s, from 32.8 s up to 40 s.
to the Fresnel reflection introduced at the extremity of the fiber).
Figure14shows the temporal evolution of the tempera-ture as measured with the FBG upper (a) and lower (b) probes as well as the temperature of the water in the cooling loop of the divertor coils (the signal called here as TTBB
Q17 ) at the
end of another baking phase (performed in March 2017) when the temperature of the machine decreases down to 70◦C for
plasma operation. The typical duration to heat or cool the machine for baking is 24 h. As for the laboratory experiment with the halogen lamps, the absolute value shows a 10 ◦C
offset with the expected temperature, but it is important to stress that the overall heating or cooling is well reproduced (we found ∆T = 110◦C between the normal condition and baking).
Plasma breakdown, plasma current ramp-up, and diverted plasma have been developed after the machine commission-ing. First diverted plasmas with additional heating power have been achieved in WEST in early 2018. Figures15(a)and15(b)
Q18
show the temporal evolution of the temperature rise as mea-sured with the FBG (DTFIB#1) and thermocouple diagnostics, respectively, during a 700 kA plasma current diverted plasma experiment (#52693). The thermocouples are embedded at 7.5 mm distance from the surface of the PFU, close to the lower FBG probes that are embedded at 7 mm. The space between two thermocouples is 37.5 mm, while it is 12.5 mm between two FBG spot measurements (we have therefore one thermocouple every three FBG spot measurements). The two different systems show similar heating distribution along the PFU and similar intensities. Looking at the signal variation as
a function of time first, we clearly see the benefit of the optical solution (with noise measurement ≤1◦) compared to electri-cal measurement such as TC data which are more sensitive to electromagnetic disturbance (up to few degrees, variation is observed during the plasma current ramp up and ramp down phases). Second, looking at the signal intensity, about 11◦ heat-ing is reported on FBG#10 and thermocouple TCIat the end Q19 of the pulse (blue curves), both sensors being located at the same position along the PFU. Such a temperature rise, regard- Q20 ing the duration of the pulse, corresponds to plasma heat flux of about 100 kW m−2, a value which is small but also
coher-ent, on top of the TC measurements, with Langmuir probe measurements. The FBG and TC data presented here were obtained in the very first WEST plasmas having an important level of radiated power losses. Further experiments will aim at decreasing radiated power fraction while increasing injected power.
VII. CONCLUSION
This paper shows the design and integration of the new embedded FBG diagnostic called DTFIB#1 to monitor the PFU temperature during tokamak plasma operation. Fourhigh Q21 temperature probes including each having eleven FBGs have been specifically designed and manufactured by the CEA List Institute according to the WEST plasma and material conditions. Each sensing part of probe is inserted in the PFU through a tiny lateral groove (at two different depths 3.5 mm and 7 mm) and attached with graphite adhesive. The multiplexed and regenerated FBG probes have been
586 587 588 589 590 591 592 593 594 595 596 597 598 599 600 601 602 603 604 605 606 607 608 609 610 611 612 613 614 615 616 617 618 619 620 621 622 623 624 625 626 627 628 629 630 631 632 633 634 635 636 637 638 639 640 641 642 643 644 645 646 647 648 649 650 651 652 653 654
000000-10 Corre et al. Rev. Sci. Instrum. 89, 000000 (2018)
tested and characterized in three laboratory experiments before installation in the machine. The accuracy of the measurement is found to be about 10◦C at low temperatures (up to about
250 ◦C in the tubular furnace), which meets the
specifica-tion even if there is still some margin for improvement (the calibration and peak detection algorithm are currently under review). However, the relative heating of the component which will be further used to compute the absorbed heat load is well reproduced. The time response of the FBG diagnostic in the component is found to be 250 ms with ±50 ms standard deviation, which is relatively small compared to the standard duration of the plasma experiment in WEST (from several sec-onds up to couple of minutes). The diagnostic DTFIB#1 has been installed in the real tokamak environment and success-fully tested during baking (up to 185◦C in WEST) and early diverted plasma exposure (with high radiated power losses and a small amount of power reaching the divertor). It is now fore-seen to use the 44 available spot measurements of the new FBG diagnostic to cross-check the IR thermography measurement and characterize the heat load absorbed by the components over the coming plasma experiments. The next step will be to ensure that the diagnostic is working properly during plasma operation with high heat flux and high temperature in the lower divertor.
ACKNOWLEDGMENTS
We wish to thank our colleagues Jean-Claude Vallet, at the CEA IRFM Institute, to have had the bold idea of using FBG sensors in WEST and Pierre Ferdinand, at the CEA List Institute, for his enthusiasm to commit to working in close cooperation with the two institutes. This work has been
Q22 carried
out with the support of the A∗MIDEX Project (No. ANR-11-IDEX-0001-02) funded by the “Investissements d’Avenir”
French Government program, managed by the French National Research Agency (ANR).
1G. Laffont, R. Cotillard, and P. Ferdinand,Meas. Sci. Technol.24, 094010
(2013), (5p.).
2A. Poncet, S. Brun, A. Foussat, R. Gallix, J. Knaster, F. Rodriguez-Mateos,
and F. Simon,IEEE Trans. Appl. Supercond.22(3), 9500604 (2012).
3A. Li Puma, G. Aiello, F. Gabriel, G. Laffont, G. Rampal, and J.-F. Salavy, Fusion Eng. Des.85, 1642–1652 (2010).
4K. Ioki, A. Bayon, C. H. Choi, E. Daly, S. Dani, J. Davis, B. Giraud,
Y. Gribov, C. Hamlyn-Harris, C. Jun, B. Levesy, B. C. Kim, E. Kuzmin, R. Le Barbier, J.-M. Martinez, H. Pathak, J. Preble, J. W. Sa, A. Terasawa, Yu. Utin, and X. Wang,Fusion Eng. Des.88, 590–596 (2013).
5C. Lescure, S. Hotchin, E. Ivings, M. F. Johnson, V. Riccard, M. Walsh, and
A. West, in 23rd IEEE/NPSS Symposium on Fusion Engineering (SOFE 2009) (IEEE, 2009).
6C. Vorpahl, W. Suttrop, M. Ebner, B. Streibl, H. Zohm, and ASDEX Upgrade
Team,Fusion Eng. Des.88, 537–540 (2013).
7S. Pal, J. Mandal, T. Sun, K. T. V. Grattan, M. Fokine, F. Carlsson, P. Y.
Fonjallaz, S. A. Wade, and S. F. Collins,Meas. Sci. Technol.14, 1131–1136 (2003).
8J. Bucalossi et al., Fusion Eng. Des. 89, 907–912 (2014). Q23 9S. Carpentier-Chouchana et al.,Phys. Scr.T159, 014002 (2014), (7p.).
10T. Hirai et al., Nucl. Mater. Energy 000, 1–7 (2016). 11M. Missirlian et al.,Fusion Eng. Des.89, 1048–1053 (2014).
12M. Firdaouss, Y. Corre, P. Languille, H. Greuner, E. Autissier,
C. Desgranges, D. Guilhem, J. P. Gunn, M. Lipa, M. Missirlian, J.-Y. Pascal, C. Pocheau, M. Richou, and E. Tsitrone,Phys. Scr.T167, 014012 (2016).
13M.-H. Aumeunier, M. Kocan, R. Reichle, and E. Gauthier, Nucl. Mater.
Energy 000, 1–5 (2017).
14J. Gaspar, Y. Corre, J.-L. Gardarein, M. Firdaouss, D. Guilhem, M. Houry,
G. Laffont, C. Le Niliot, M. Missirlian, C. Pocheau, and F. Rigollet, Nucl. Mater. Energy 000, 1–5 (2016).
15H. Bufferand, G. Ciraolo, Y. Marandet, J. Bucalossi, Ph. Ghendrih, J. Gunn,
N. Mellet, P. Tamain, R. Leybros, N. Fedorczak, F. Schwander, and E. Serre,
Nucl. Fusion55, 053025 (2015), (9p.).
16T. Eich et al.,J. Nucl. Mater.438, S72–S77 (2013).
17K. O. Hill and G. Meltz,J. Lightwave Technol.15(8), 1263 (1997). Q24 18J. Kennedy and R. Eberhart, “Particle swarm optimization,” in Proceedings
of the IEEE International Conference on Neural Networks (IEEE, 1995).
19The edge plasma refers to the external part of the plasma where magnetic
field lines connect to the material surfaces. Q25
655 656 657 658 659 660 661 662 663 664 665 666 667 668 669 670 671 672 673 674 675 676 677 678 679 680 681 682 683 684 685 686 687 688 689 690 691 692 693 694 695 696 697 698 699 700 701 702 703 704 705 706 707 708 709 710 711 712 713 714 715 716 717 718 719 720 721 722 723 724 725 726 727